More than 2400 people played the Pareto Game last week and we got some interesting results. This post provides my responses to each of the six questions that were posed. If you have not played the game yet, please stop reading this post & play the game at https://benchmarksixsigma.com/blog/let-us-play-pareto/. Once you play it, reading this post shall be more enjoyable and hopefully, a better learning experience.
Question 1 – Is it necessary that the categories used in the Pareto Chart are mutually exclusive?
A) YES, categories must be mutually exclusive.
B) NO, I do not worry about exclusivity as I just need some meaningful direction.

For this question, one can argue in favor of either side. My answer is option A) Yes, they must be mutually exclusive, especially if severity of the problem is high. You may go for option B) while using it as a preliminary analysis tool, as you may not know initially if categories are really mutually exclusive. It is understandable that we just want to begin with some numbers and direction but, while using option B) we should be aware of the risk which we are exposed to. In any case, we must avoid making the kind of logical mistake highlighted in the image above. In this example, the four reasons are not exclusive and actually mean just one.
Question 2 – While solving a business problem, the best way to work with a Pareto Chart is to plot number of occurrences (frequency) and corresponding cumulative percentage on the Y axis. Do you agree?
A) YES, the number of occurrences should be used on Y axis.
B) NO, instead of that, I prefer plotting a business impacting output like cost on Y axis.
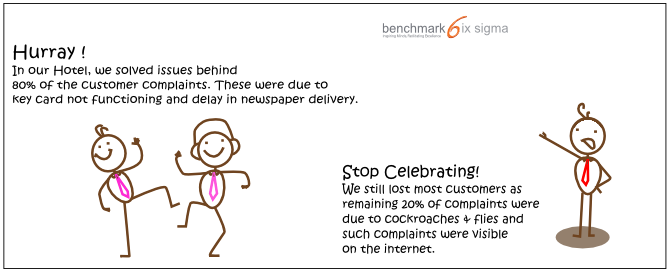
My choice is B) – I prefer plotting something like risk, cost or revenue on the Y axis, if that is possible. 80% of occurrences of causes may not have 80% of the business impact. In other words, majority of occurrences do not always create majority of business impact. In the example shown in the image, it is easy to imagine that key card malfunction or delay in newspaper delivery are issues that guests have learned to live with, at several hotels. For such issues at most places, people may quietly lodge a personal complain without making much fuss. While these high recurrence problems need to be addressed, they do not classify as highest priority, especially when something like presence of insects is waiting for attention.
Question 3 – Pareto principle is universally applicable to every problem. Do you agree?
A) YES, Pareto Principle applies to each business problem without exception.
B) NO, it may or may not apply. It is not a universal principle.
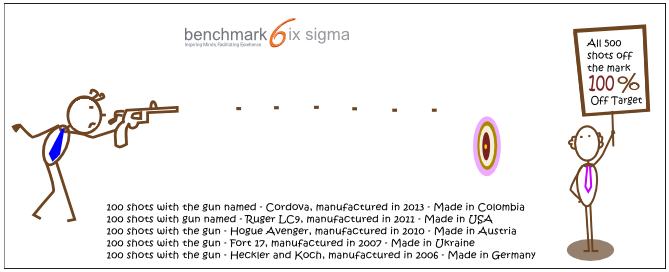
My response is B) – The principle may or may not apply. For the shooter shown above, 80% of the mis-hits are due to 80% of guns. While categorizing in this way does not help him find a solution, it should tell him that type of gun does not seem to be a factor in accuracy of the outcome. So, when the 80-20 principle does not apply, it might tell us something about low likelihood of influence of the considered factor (here, gun type) on the outcome.
Question 4 – Repeated application of the principle – For a given problem, Pareto is not a principle meant for one time use. One may like to identify the most dominant categories from a high level pareto analysis and then IN MOST CASES, it is possible to carry out a next level Pareto analysis on each of the dominant categories. Do you agree?
A) YES, I agree with this and I find “more than one level use” practical in MOST cases.
B) NO, I find “more than one level usage” practical in very few cases.
My preferred choice is A, I find “more than one level use” practical in MOST cases. but even option B cannot be classified as wrong here. This question relies on your experience with Pareto Principle and depends on several things. If you are detail oriented and wish to dig deep, you are likely to see more opportunities. If you are a member of senior management or manage MIS, with access to data at various levels, you have more possibilities of doing Pareto Analyses at multiple levels. In the Lean Six Sigma world, many of the drill downs from big Y to small Y are done this way. The usage also depends on type of data. If your data is such that can be split in mutually exclusive categories repeatedly, you are likely to have opportunities for using Pareto multiple times.
Question 5 – The categories that end up as low priority as a result of Pareto analysis can be safely ignored. Do you agree?
A) YES, low priority categories can be safely ignored while solving the problem.
B) NO, low priority categories cannot be ignored in all cases. It really depends.
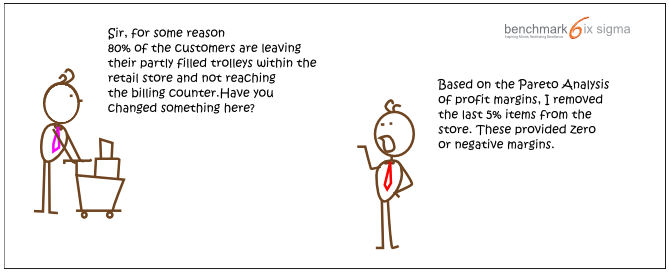
My answer is B) It really depends. Let us consider staple goods. These are daily need items providing low margins to retailers. If a retailer checks the contribution to profits, he may feel the urge to remove staple goods from his home store. However, if attractive staple goods prices bring bulk of customers to the store, their presence is vital to business success. They also need high priority and focus all the time. In this example, it may be affordable to do away with some slow moving items which provide the highest margins. In other words, what is low priority in one Pareto Analysis may be high priority in another Pareto chart. Multi-perspective analyses are needed sometimes.
Question 6 – The 80-20 rule is not an absolute rule. It can be 70:30 or even 90:10 – the total must remain 100. Do you agree?
A) YES, the total must be 100.
B) NO, I do not agree. The total may be a number other than 100.

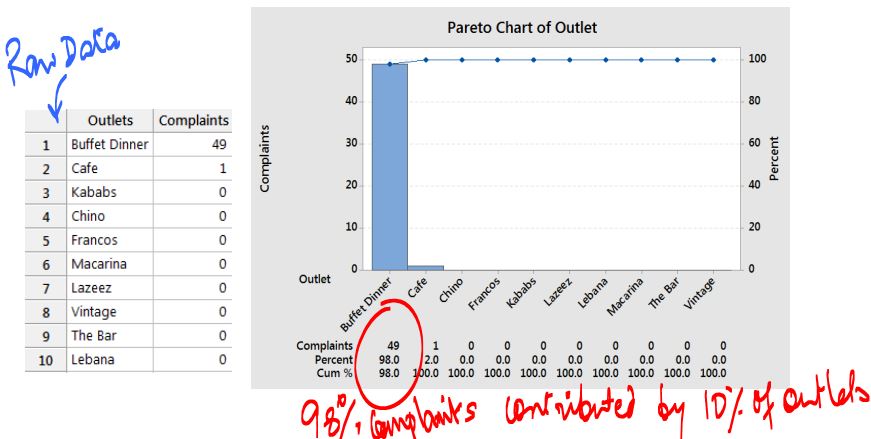
The answer is B). The total does not have to be 100 as these percentages are calculated from different sets of data. In the above example, 98% complaints (49 out of 50) came from 10% (1 out of 10 outlets) of the outlet categories.
The data and Pareto Chart for this situation is here –
If you have liked this post, do share it with others using one of the share links on the left side. Feel free to comment and share your views. To comment please click here.

Benchmark Six Sigma conducts workshops related to problem solving and decision making all across India and partners with a limited number of companies each year on "build your transformation team" projects. Public Workshops calendar can be seen here - http://www.benchmarksixsigma.com/calendar
Linkedin Group - To ask your own questions or to participate in interesting questions already posed, you may join our Linkedin Group - Lean Six Sigma War Room.
- When Design for Six Sigma Fails - September 24, 2015
- The root cause is missing - July 15, 2014
- Process Excellence Vs. Human Psychology - June 11, 2014
Nice way of explaining your view with the example.Not fully convinced with 6 th answer..
Thanks for your comment Rajagopal. Have a look at the data and the chart for last one – https://benchmarksixsigma.com/blog/wp-content/uploads/2014/05/Pareto-Explained.jpg
Let me know if you have a question.
don’t fully agree with #6; should be two sets of 100%s; have to normalize somehow
enjoyed your pareto game–fun way to get a refresher. Thanks Vishwasdeep.
i too dont agree with the last point . To apply the 80/20 principle you need have two set of data ,both adding up to 100 .
Hi Anusha,
Pareto requires a single set of data which is categorized meaningfully. Here is an image which I added to show the data and the chart – https://benchmarksixsigma.com/blog/wp-content/uploads/2014/05/Pareto-Explained.jpg
Hope this helps.
Convinced with all question excluding the last one.
Hi Laxmi,
Here is the data and the chart for the last one – https://benchmarksixsigma.com/blog/wp-content/uploads/2014/05/Pareto-Explained.jpg
Hope this clarifies. Do let me know if you have any question.
Dear Sir,
I find all your posts very useful and interesting. Thanks a lot for making such boring topics so interesting and informative.
Thanks Ananya.
the last post is little sketchy mr.vk.
you have to have a set of data to see 80: 20. in the sixth example, you are comparing ratios… not a data set.
Hi Ashok,
It just shows one real application of the Principle which may be hard to comprehend in absence of another graphic. 98% of complaints came from 10% of customer categories. If you wish to see the data set and the chart, here it is – https://benchmarksixsigma.com/blog/wp-content/uploads/2014/05/Pareto-Explained.jpg
Hope this helps.
Beautiful explanation
Thanks Benita.
It appears that your answers are totally from your experience. I would suggest that you try to find a copy of Dr. Juran’s videos where he explains how he came up with and applied the principles of Pareto (the Italian economist). I find that more and more people are using incorrect interpretations of principles originally put forth and proven by experts like Drs. Juran, Deming, Ishikawa and Kano. The Grand Masters got it right. Let’s use the correct interpretations by studying the works of the Grand Masters.
Jim. thanks for your advice. Yes, observations are based on my experience just as your comment is based on your experience. You might be aware that experts you have listed have altered their own explanation based on new learning that they got in their lifetime. I am sure how they applied is not exactly the way you or I would like to apply this observation based principle which has no statistical derivation. I like to apply what I learn and explore situations to discuss them. I really want to understand what you consider as incorrect interpretation in this post and look forward to your response.
Dear VK, I strongly disagree with Q6 answer. To me Pareto is used for a given set of data and combining two sets of data in a Pareto analysis cannot be correct. In above example one set of data tells you the what kind of customers have the majority of the complaints while other set of data will tell us that 10 % of the outlets are main cause of these complaints. We can always infer from these two analysis to work upon the corrective measures. However, the Pareto principle has to be applied on one set of data at a time to have meaningful or rather relevant conclusion. As such we did two types of Pareto analysis above.
Dear Neeraj,
Thanks for your comment. I agree that Pareto analysis is done for one set of data grouped into categories. Here is an image that shows the actual Pareto chart for example shown for question 6 – https://benchmarksixsigma.com/blog/wp-content/uploads/2014/05/Pareto-Explained.jpg
80% of effects are due to 20% of categories (or causes) that contribute. Hope this explains.
Good questions and very good explanatory answers
Thanks Vamsidhar.
Dear VK, Thanks for the kind reply. It would have been great if you had put up this graph earlier. 🙂
Dear Neeraj, you are right. I did realize this a bit late. 🙂
thanks for getting the answer to questIon 6 CORRECT!
It should be easy to demonstrate that the the two numbers don’t have to add up to 100 – but because they do in the original formulation, people persist in thinking that coincidence is important/relevant.
Examples
In the USA 1% of the population own far more than 50% of the wealth. The split is DEFINATELY not 20% of the pop own 80% of the wealth.
Take two dice. Roll them 200 times record the value of each roll, calculate the sum of all the rolls. Sum the values for the highest 20% of the rolls. Does that sub total represent 80% of the total for the whole series? I would be astounded if it did. Conversely – take 80% of the grand total and then figure out how many of the highest value rolls you need to extract to add up to the 80%…. I doubt it will be 20% of the rolls.
In both of the examples above, the DATA is what speaks to us, not the historical coincidence that 20% of landowners in Italy happened to own 80% of the land
The difference in opinion about #6 you are seeing is the difference between rote learning, and actually playing with real data to understand the concepts within an idea.
Pareto’s observation is about the reality that similar things (customers for example) do NOT generate the same outcomes (profit, sales, complaints, workload etc etc) and that if we wish to optimize processes we should exploit those variances in outcomes. Pareto is an incredibly powerful tool – when we use it correctly.
Great post. Even better discussion.
Peter, thanks for your comment and the excellent explanation contained in it.
My comment included an error (happens when I don’t search for the exact figures) the top 1% own more than 35% – not as I stated.
Source: http://www.businessinsider.com/charts-on-us-inequality-2013-11?op=1
Hi VK,
Thanks for the data.
Looking @ the data, i would conclude directly. No Pareto rule needed …
moreover- % is always in reference to 100.
I have not come across any academic literature supporting this view… please challenge me.
Thanks
Hi Ashok, in #6, I agree Pareto Analysis is not really needed, but it brings out the point that 98% of the effects may be due to 10% of the category of causes. We can always mention proportions as percentages (out of hundred) and that has been done in this case. Hope this helps.
Hi VK
Thanks for the answers and explanations. My feelings are mixed right now (since some of my answers didn’t match yours :)). Some of the answers are pretty straight forward while some are truly scenario based. From what I have learnt from you is to understand the theory behind the tool and then use common and business sense while applying it.
For me Pareto is a prioritizing tool and depending on the business scenario, i could argue in favor of either of the options for all questions.
#1 – I would never use Pareto in this situation. My experience (definitely not as vast as yours) tells me that if the problem statement is stated correctly, Pareto will help you out
#2 – If the hotel lost more customers due to 20% of the complaints, then the problem statement and the pareto were done incorrectly. If I were to do the pareto, I would plot 2 different ones – one for the complaints leading to loss of customers and second where complaints doesn’t result in the loss of customers.
#3 – it is like giving an incorrect input and expecting the system to give the correct output. Going by the logic of histogram (where each frequency has to be in unique bins), option B does not make sense to me
#4 – I personally have used pareto for drill downs and it has helped greatly
#5 – Agree to the explanation. I have used this in FMEA extensively….where even though the RPN is less but because it is critical to business, we implement some control measures for it
#6 – this was a real eye opener. I mean I always knew that 80% and 20% are coming from different data sets but got stumped when the question was asked 🙂
All in all a good game….some exercise for the grey cells!!!
Hi Mayank, good to see your detailed comment. #3 is an interesting dilemma. Sometimes, factors seem mutually exclusive, when we draw Pareto during preliminary investigation, but are later found to be correlated through knowledge gained during the project. Not drawing a Pareto, during initial analysis may also not make sense as it helps to provide some meaningful direction in absence of anything else. #6 is truly a discovery. It is an area where the mind refuses to align with 80:20 connect for so many people.
Cheers!
Hi Vk,
Thanks for sharing this. I think most of us disagreed on the 6th answer but stands corrected after going through the thread.
The second point that I want to state is on the application of Pareto tool which can’t be used in all Six sigma / Continuous Improvement projects but can be very insightful and can give us meaningful direction in most of the improvement initiatives.
Loved the presentation of the content because of the innovative way in which it was shared.
Cheers!
Tushar Ghosh
Hi Tushar, I agree with you. Thanks for the comment.
This was a real good refresher.
Cheers
Nilanjan
Stay inoftmarive, San Diego, yeah boy!
This is wonderful game to refresh the tool. I am not totally convince by answer 3. Is it possible to give one more example. Most of the problems / solution will follow Pareto principal, may not be exactly like 80:20 but like mentioned in question 6 the proportion will change.
some of the answers are really depend on what kind of a project data we are handling. Really appreciate the way you have explained it, looking forward for other tools :-).
thanks,
Veena
Hi Veena, here is another example. If 10 students fail in each of the five Sections of class X in a school, and we try drawing the Pareto Chart for these, it does not give us meaningful ratios to focus our attention on any specific Section. Here, the Pareto Rule is not of utility for the focusing objective as each Section has exactly the same number of failures.
It was a very crisp refresher topic. Thank you!
Hello VK
Last point is little confusing, can I please give some more details on this
Last point is little confusing, can you please give some more details on th
Hi Raj,
If flight delay is attributed to 10 reasons and the first three reasons cause 80% of the delays – We will conclude that 80% of the delays are due to 30% of the causes (3 out of 7). Hope this clarifies.
Thank you. Nicely explained, very meaningful.
Dear VK Sir,
Pareto explained in a very innovative way. Never thought we could have a quiz like this around Pareto. Thank you
Good to see that you liked it.