In recent weeks, I have enjoyed interactions on certain concepts with games on problem solving, the why- why analysis and Pareto principle. This week, let us have a contest that focuses on assessing genuineness of data.
When I used to conduct management system audits, I faced several amusing situations where the audited process’s owner wanted me to believe that the data being shown to me was real while I strongly felt that it was fudged. Such situations do get tricky sometimes as I have a tendency to go deeper to find the truth, and maintaining good relations moves to a slightly lower priority. Here is what happened in one of such situations.
In the middle of an audit, I found myself looking at complaints received for the account creation process in a financial services company. According to the process owner, the number of complaints was to the tune of 1%. He showed me complaints in the system which matched his claim. To be more specific, there were 110 complaints for about 11000 accounts that were opened. In another location of this company, as per my audit records, the complaints were consistent over time and much higher in terms of percentages. I could not find any specific difference in processes at this location that should keep the number as low as 1%. Fortunately, each complaint here had an auto generated serial number. These complaints started from serial number 1 and the biggest serial number was 998. Obviously, hundreds of serial numbers were missing as visible complaints were just 110 in number. On inquiring the reason for missing serial numbers, I was told that many complaint get wrongly marked as account creation complaint, and they are moved to another queue which is managed by a team overseas. I looked at the complaint serial numbers carefully after arranging them according to their first digit, and I was sure that these books are cooked. The serial numbers actually indicated that the data was fudged. To convert the situation into a game, I have created two data sets which are shown in the image below. The question is – which out of these is likely to be genuine and which one is supposed to be a fudged data set?
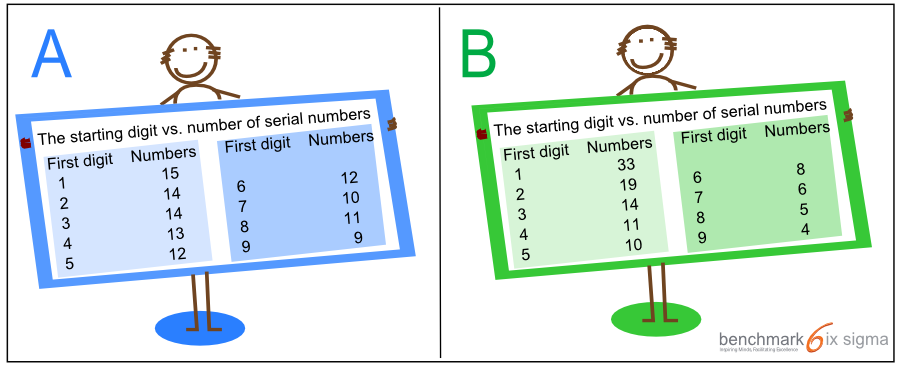
Question – Which data set is more likely to be genuine?
[dilemma cats = ‘1056’]
Like always, you may compare your thinking with others by clicking on A or B. Once you have clicked on your preferred response and are ready to compare with mine, please click here – https://benchmarksixsigma.com/blog/how-to-find-if-a-data-set-is-genuine-part-2/. To create a comment on this post, please click here.

Benchmark Six Sigma conducts workshops related to problem solving and decision making all across India and partners with a limited number of companies each year on "build your transformation team" projects. Public Workshops calendar can be seen here - http://www.benchmarksixsigma.com/calendar
Linkedin Group - To ask your own questions or to participate in interesting questions already posed, you may join our Linkedin Group - Lean Six Sigma War Room.
- When Design for Six Sigma Fails - September 24, 2015
- The root cause is missing - July 15, 2014
- Process Excellence Vs. Human Psychology - June 11, 2014
Thanks for creating such interactive games. Looking forward to the answers
Hi Vaishali, answer has been posted here – https://benchmarksixsigma.com/blog/how-to-find-if-a-data-set-is-genuine-part-2/
This is quite interesting VK… this is also a very common question we have while auditing..
it would be interesting to see the responses.
Enjoying these puzzles VK..
Thanks Vrinda, here is the remaining part of the story and my response to the question – https://benchmarksixsigma.com/blog/how-to-find-if-a-data-set-is-genuine-part-2/
Thanks Vishwadeep. Awaiting the answers..
Hi Suresh, here is the remaining part of the story and my response to the question – https://benchmarksixsigma.com/blog/how-to-find-if-a-data-set-is-genuine-part-2/
Hi
Hi Jeyashri, thanks for your comment. Here is the remaining part of the story and my response to the question – https://benchmarksixsigma.com/blog/how-to-find-if-a-data-set-is-genuine-part-2/
Hi VK..Its good to see your responses and play such interactive games from you which challenges our thought process and understandings
Thanks Sanjay, here is the remaining part of the story and my response to the question – https://benchmarksixsigma.com/blog/how-to-find-if-a-data-set-is-genuine-part-2/
Thanks Vishwadeep. Awaiting the answer to this one…
Hi Shweta, here is the answer – https://benchmarksixsigma.com/blog/how-to-find-if-a-data-set-is-genuine-part-2/
B looks to be more random and A on the other hand lacks in randomness and seems to follow a pattern hence more likely to be fudged considering the fact that human brain fails to produce randomness and each individual follows certain pattern
Hi Sujan, thanks for your comment. Here is the remaining part of the story and my response to the question – https://benchmarksixsigma.com/blog/how-to-find-if-a-data-set-is-genuine-part-2/
Does the frequency distribution really matter if the person is playing with the numbers ? I mean don’t you think we will be under estimating the persons capability if we think he will be foolish enough to delete the data at one lot. In the above example if the process manager claims he has removed data as it was wrong reporting of problem the fact that he accepts it will make it all the more difficult to prove that the numbers are fudged. He can claim that a untrained person did a mistake in one lot, or kept doing it till it was identified which ever suits him / her.
I have faced such problems in Data Analysis so your inputs would be very valuable to make my life easy.
Thanks in advance.
Hi Ashish, thanks for your comment. Here is the remaining part of the story and my response to the question – https://benchmarksixsigma.com/blog/how-to-find-if-a-data-set-is-genuine-part-2/
Hi Yogesh. Here is the remaining part of the story and my response to the question – https://benchmarksixsigma.com/blog/how-to-find-if-a-data-set-is-genuine-part-2/
Hello Vishwadeep thanks for your response. I think this example will be very useful in my future endeavors.
In this example what happened was the wrong reporting was actually not wrong reporting. But at KPO or data analytics organizations at times what happens is the data entry team or a person in this team might be doing mistakes and if the internal audit is not immediate and strong enough, then god save the process. Later on it becomes very difficult to verify the authenticity of the data as it is actual mistake and not intentional and it will happen in bulk so no pattern is identified.
What would you suggest me to do in that situation? Thanks in advance.
I do wonder how 1-99 were encoded in your data set above. As a mathematician I’d be looking for a starting 0 digit.
Having said that, I would tend towards A as I see repeating numbers and an increase between digits 7 and 8. B, with its steadily declining sequence, triggers alarms in my SPC thought center.
Absolutely right Jeff! I also agree with your comment that numbers shall start with many zeroes in general instead of 1-99. All for the game! Here is the remaining part of the story and my response to the question – https://benchmarksixsigma.com/blog/how-to-find-if-a-data-set-is-genuine-part-2/
In set B, it also seems like when the complaint numbers reached higher digits (6,7,8,9s), i.e. the number of complaints increased beyond comfort, the process owner panicked and started fudging.
Right you are Himanshu! Here is the remaining part of the story and my response to the question – https://benchmarksixsigma.com/blog/how-to-find-if-a-data-set-is-genuine-part-2/
B looks genuine
Hi Suresh, thanks for your comment. Here is the remaining part of the story and my response to the question – https://benchmarksixsigma.com/blog/how-to-find-if-a-data-set-is-genuine-part-2/
Nice information. Really Its nice articles
Thanks Raghu, Here is the remaining part of the story and my response to the question – https://benchmarksixsigma.com/blog/how-to-find-if-a-data-set-is-genuine-part-2/
Great puzzle, curious to know the answer 🙂
Hi Jagpreet, thanks for your comment. Here is the remaining part of the story and my response to the question – https://benchmarksixsigma.com/blog/how-to-find-if-a-data-set-is-genuine-part-2/
B seems too methodical and rapid to be true / wrong data collection techniques appear to have been used there, creating a wide gap in the first series and last series.
How large a gap can be considered acceptable ?
With regards,
Dr Arvind Khanijo
Absolutely right you are! ere is the remaining part of the story and my response to the question – https://benchmarksixsigma.com/blog/how-to-find-if-a-data-set-is-genuine-part-2/
Good problem and I believe ‘B’ is genuine. Looking for an answer.
Hi Rajiv, thanks for your comment. Here is the remaining part of the story and my response to the question – https://benchmarksixsigma.com/blog/how-to-find-if-a-data-set-is-genuine-part-2/
Data set ‘A’ seems more genuine that data set ‘B’. The no. of account opening complaints per 100 total complains ( 1 – 9) is similar for set A. We expect same trend in no. of complaints as the system and person performing the account opening process is same. However the data set ‘B’ does not have any account opening complaint pattern per 100 complaint received and is highly random though the person responsible and system is same
Absolutely right, Rahul. Here is the remaining part of the story and my response to the question – https://benchmarksixsigma.com/blog/how-to-find-if-a-data-set-is-genuine-part-2/
The data set in B looks more random, although the decreasing number of serial numbers is very much consistent with what one would find in nature or in a practical world. Hence, to me, B looks more genuine.
Hi Himanshu, thanks for your comment. Here is the remaining part of the story and my response to the question – https://benchmarksixsigma.com/blog/how-to-find-if-a-data-set-is-genuine-part-2/
Dear Sir,
Dataset A seems to be more genuine. Let me explain. (By the way, I am also keenly awaiting your reply, as and when you post it !! )
LOGIC: If it is true that there are many instances of cases being wrongly marked in to a particular category and later being assigned to another, then there is a Random error in their process. Because the population is quite high (serial nos up to 998 means there are more than 900 nos that can be generated), the errors can be safely assumed to follow a Normal distribution. In a normal distribution, the instances of the errors overshooting the Mean would be almost same as (or in same order of) them undershooting the mean. (In this eg, the Mean can be understood as the process of correctly marking the complaint to the required category). Thus, we should see near equal numbers of serial nos in every block (a block here is denoted by starting digit of the serial number). This is visible only in dataset-A, which seems to have come out of this logic. Whereas dataset-B, which shows unequal spread of serial nums in various blocks, seems to defy this logic.
Thanks & Regards,
Bharath G
Bharath, right you are! Here is the remaining part of the story and my response to the question – https://benchmarksixsigma.com/blog/how-to-find-if-a-data-set-is-genuine-part-2/
B, as per statistical approach
Hi Vivek, here is the remaining part of the story and my response to the question – https://benchmarksixsigma.com/blog/how-to-find-if-a-data-set-is-genuine-part-2/
Aayush, You are right!. Here is the remaining part of the story and my response to the question – https://benchmarksixsigma.com/blog/how-to-find-if-a-data-set-is-genuine-part-2/
Pattren B seems fudged, looks like intentionally numbers being reduced
I agree with you Bala, here is the remaining part of the story and my response to the question – https://benchmarksixsigma.com/blog/how-to-find-if-a-data-set-is-genuine-part-2/
There is a pattern seen in A – which is indicative of a systematic approach used to fudge data in A.
I see more randomness in B – which probably is more genuine and does not point to a systematic manipulation
Hi Ashok, thanks for your comment. Here is the remaining part of the story and my response to the question – https://benchmarksixsigma.com/blog/how-to-find-if-a-data-set-is-genuine-part-2/
Informative, waiting for the answer.
Hi Debasri, thanks for your comment. Here is the remaining part of the story and my response to the question – https://benchmarksixsigma.com/blog/how-to-find-if-a-data-set-is-genuine-part-2/
B seems to be more genuine
Hi Om, thanks for your comment. Here is the remaining part of the story and my response to the question – https://benchmarksixsigma.com/blog/how-to-find-if-a-data-set-is-genuine-part-2/
Thank you VK,
I have problems to find a convincing method to discern between the two groups. Looking forward to find out the logic behind the game.
Hi Luis, thanks for your comment. Here is the remaining part of the story and my response to the question – https://benchmarksixsigma.com/blog/how-to-find-if-a-data-set-is-genuine-part-2/
Hi VK
B looks like cooked up simply because the error counts are decreasing. the randomness in the process of erroneous account setups should be as is if no improvements have happened which would mean that for every 100 accounts set up same number of errors should be received. However there are too many variables involved here basis which one can argue for either A or B but for now I would like to stick with A as the genuine data set.
Right you are ! Here is my response – https://benchmarksixsigma.com/blog/how-to-find-if-a-data-set-is-genuine-part-2/
I am in the progress of completing my school project, insufficient data is one of many issues and we were told to add any variables that may help give insights to the data set ( we are measured on method and process followed rather than result) ,that being said after a randomly assigning data to the given data set i realized a sort of even distribution of the randomly assigned data, therefore failing to meet the reason i added data in the first place. I can see a similar pattern in option A. option B seems like a more real scenario only because of the distribution .
waiting for the explanation !
Hi Sylvester, thanks for your comment. Here is the remaining part of the story and my response to the question – https://benchmarksixsigma.com/blog/how-to-find-if-a-data-set-is-genuine-part-2/
Option A seems more correct to me .. but curious to know the Answer
I agree with you Mahesh! My response is here – https://benchmarksixsigma.com/blog/how-to-find-if-a-data-set-is-genuine-part-2/
Thanks VK for putting this scenario in form of an interesting puzzle. I think A is genuine as that is more random. This answer is based on assumption that no process change implemented. B could have been genuine option if there is a correction process in place.
Awaiting your answer and reasoning.
You got it right, Pankaj. My response is here – https://benchmarksixsigma.com/blog/how-to-find-if-a-data-set-is-genuine-part-2/
Based on an application of Benford’s Law the second data set (B) is more likely to be legitimate. The distribution of leading numbers in the first data set is too even. Real live data sets tend to have a distribution that favors 1 as the leading digit with 9 being fairly uncommon. While Benford’s Law usually is not used for serial number assignments, this is actually a second order cull of the data set (certain complaints have been ignored) which would, in my opinion, tend to make it more likely to comply with Benford’s Law. It should also be noted that this is not an absolute answer, but is indicative of a data set that has potentially been manipulated in some fasion.
Thanks for participating and bringing up Benford’s Law, Mark. My response is here – https://benchmarksixsigma.com/blog/how-to-find-if-a-data-set-is-genuine-part-2/
I do not think that simply evaluating the distribution is the answer. It is more of a guide on how to proceed with the investigation. As previously mentioned by other readers, set B is indicative of an improving system. However, I believe that set A also indicates an improving system, just not as radically. If the numbers are supported by evidence of how the system was improved either radically or gradually, then there should be evidence in both cases. Neither system would improve on its own.
Another thing to think about… If these numbers were plotted on a control chart, assuming a relatively flat customer number every month, that both of the systems are in a state of flux B>A. Once again, I would need some sort of investigation to occur to determine why the numbers were only going in one direction.
Thanks for the interesting posts!
Hi George, I appreciate your well thought comment. My response is here – https://benchmarksixsigma.com/blog/how-to-find-if-a-data-set-is-genuine-part-2/
The answer lies in Benford’s Law/first-digit law.
B will be more appropriate.
Very interesting questions in all the posts..thanx and keep continue it.
Thanks Sandeep, my response is here – https://benchmarksixsigma.com/blog/how-to-find-if-a-data-set-is-genuine-part-2/
It is very much interesting to participate with you as happy participation with enriching knowledge i,e enjoy & learn
Thanks KV, my response is here – https://benchmarksixsigma.com/blog/how-to-find-if-a-data-set-is-genuine-part-2/
Quite interesting.Such case studies initiates a thought process on analyzing the situation and making right decision.
Hi Suchita, my response is here – https://benchmarksixsigma.com/blog/how-to-find-if-a-data-set-is-genuine-part-2/
Cant make out really. Need to knw the knack of finding out
Thanks for participating, Deepmala. My response is here – https://benchmarksixsigma.com/blog/how-to-find-if-a-data-set-is-genuine-part-2/
The information provided is less, based on that, it is hard to reach any conclusion. However, in general observation, I can see that there is huge decline in number’s at “B” option, which seems to be manipulated to show average/standard target set by organisation to show there good book. whereas, option “A” shows, consistent and gradual reduction in number, which can be expected to be genuine.
Looking forward the correct answer and method of finding that.
Thanks for participating, Rakesh. You got it Right! My response is here – https://benchmarksixsigma.com/blog/how-to-find-if-a-data-set-is-genuine-part-2/
A seems to be genuine
B is more likely to be genuine
Thanks for participating, Hoda. My response is here – https://benchmarksixsigma.com/blog/how-to-find-if-a-data-set-is-genuine-part-2/
B seems to be more genuine.
Thanks for participating, Sweta. My response is here – https://benchmarksixsigma.com/blog/how-to-find-if-a-data-set-is-genuine-part-2/
Interested to know the answer
Hi Subhash, my response is here – https://benchmarksixsigma.com/blog/how-to-find-if-a-data-set-is-genuine-part-2/
Very good observation.
Hi Joseph, My response is here – https://benchmarksixsigma.com/blog/how-to-find-if-a-data-set-is-genuine-part-2/
Keen waiting for answer.B?
Thanks for participating, Ramadass. My response is here – https://benchmarksixsigma.com/blog/how-to-find-if-a-data-set-is-genuine-part-2/
A seems to be more genuine
Congrats! Radhika, you got it right. You may also like to understand the First Digit Law which does not apply here – explanation is here – https://benchmarksixsigma.com/blog/how-to-find-if-a-data-set-is-genuine-part-2/
If I understand the problem, A seems genuine, as over time, the average number of complaints is consistent. Set B shows a pattern of declining complaints, which means that either the company performance improved steadily, or data was fudged to give that appearance.
HI DP, you are absolutely right, you may also like to look at First Digit Law which does not apply here – the explanation is here – https://benchmarksixsigma.com/blog/how-to-find-if-a-data-set-is-genuine-part-2/
Waiting for answer.
Here is the answer Naveen – https://benchmarksixsigma.com/blog/how-to-find-if-a-data-set-is-genuine-part-2/
I think A is more genuine because the numbers are evenly distributed amongst different buckets.
Hi Phanindra, you are right! my response is here – https://benchmarksixsigma.com/blog/how-to-find-if-a-data-set-is-genuine-part-2/
Benford’s law doesn’t apply here since the serial number distribution isn’t evenly distributed over many orders of magnitude. Serial numbers and therefore the starting digits are supposedly uniformly distributed within the range, which in this case is 1-998. starting digit 1 occurs 100 times, so does 2, 3, 4, 5 etc.
Hence the incorrect issues identified, should also be uniformly distributed. Hence A is genuine.
There might be a very specific case where B may be genuine i.e. if there’s a learning curve associated. As time progressed the team got better and fewer issues were made and hence the reduction in complaints with a higher order starting serial digit. But other issues, i.e. those managed by overseas team didn’t decrease and more movement happened towards the end. What this would mean is that in the starting when serial 1 starting digit complaint IDs were generated there were many actual account generation issues. But towards the end the account creation issues weren’t as many but the other issues, managed by overseas team continued.
Absolutely right you are, Saurabh. I made a special mention of your name in my reply post which is here – https://benchmarksixsigma.com/blog/how-to-find-if-a-data-set-is-genuine-part-2/
I think I am in a similar soup. Please let me know the answer
Hi Harsha, here is the answer – https://benchmarksixsigma.com/blog/how-to-find-if-a-data-set-is-genuine-part-2/
good one, interested to know you comment.
Hi Krishna Pal, my response is here – https://benchmarksixsigma.com/blog/how-to-find-if-a-data-set-is-genuine-part-2/
Games are interesting I would like to know the answer………
Hello Sagar, here is the answer – https://benchmarksixsigma.com/blog/how-to-find-if-a-data-set-is-genuine-part-2/
Awaiting your answer…!!!
Hi Anupam, the answer has been posted here – https://benchmarksixsigma.com/blog/how-to-find-if-a-data-set-is-genuine-part-2/
Gradual decrese in compliant compared to very Very high slide