
Topics
-
TSMC, the world's biggest chipmaker, is planning a significant price hike. Reports from Nikkei Asia indicate that they'll be increasing their chipmaking costs by as much as 10% starting in 2027. This move could impact the cost of many electronic devices we use daily. View the full article
-
Q891 Scenario An organization sells something to a large base of customers — this could be a product, a subscription, a service, tickets, or a booking. Right now it charges one price for everyone. Its yearly revenue is about $50M. An AI pricing model can switch this to personalized pricing: instead of a single price, it sets a price tuned to each customer, based on signals like their history, timing, location, and how much they seem willing to pay. Some customers would be offered less than today


Leaderboard
-
Vishwadeep Khatri
Administrators290Points6,686Posts -
Mayank Gupta
Members139Points679Posts -
Venugopal R
Members82Points238Posts -
R Rajesh
Members75Points160Posts


Popular Content
Showing content with the highest reputation since 10/04/2011 in all areas
-
19 pointsThe most essential facet of being a manager, be it in any walk of life, is for sure the one skill that differentiates him/her from anybody else and that is: Decision-making. It is most definitely the power, rather the ability of a person to take prudent, relevant and effective decisions that set him/her a notch ahead in the race that the corporate run comprises. Thus, we not only need to know what or why, but how to make decisions, how to make the choices that we make, to be able to foresee what lies in store having made those choices and to be positive that the alternatives have an opportunity cost that is less likely to exceed the benefits from the plan A that we choose. The mind always works on matter, matter that is assimilated, accumulated, observed, absorbed and created. This matter more often than not comprises facts and figures that we come across over a period of time and it is this that formulates our opinions on issues and circumstances and should guide us in choosing the way forward. One’s experiences are a key to learning and avoid mistakes, but life is all about new challenges and it isn’t necessary that one’s challenge will be the other’s or that one’s solution will work out for the other, problems, solutions and hence decisions, vary, with time and tide, to each his own. Decision-making is a crucial skill for treading on the path to success. It is imperative thus that one take informed decisions, rather than impulsive or intuitive ones. This itself can be illustrated by the use of numerical figures in terms of probability of a decision being a thumbs-up or a downer based on whether it is based on gut-feeling or not, where a gutsy decision has a fair and square half chance of hitting the bulls-eye, an informed, data driven decision based on historical data can warrant a chance much greater than that of being a winner. Data analytics, a field of research, an active component of all industrial data processing and reporting, has become the buzz-word in the world of business. It is owing to the stress on hard core historical data projection and information related to past trends, their relevance, their cyclical patterns, any relational change between parameters and many other such ways of engineering data to deduce important facts and identify occurrences, areas of improvement, effect of factors and even have a decent foresight by extrapolating trends, assuming at times ceteris paribus. It is the mere fact that this subject is being undertaken as a specialization in some of the newer and premiere business schools in the country that relays its importance, its applicability and the extent to which it can play a role in making key decisions easier for every managerial level all courtesy the heavy data dependency, real data building up virtual images only for a clearer picture albeit a surer one. While the success of data driven decision making can itself be proved through data, its wonder lies in the fact that one can also prove the risk related to intuition based choices in a data driven manner. There is a reason the rational mind which processes such data is called analytical. It overcomes the biases of the emotional mind and loosens the shackles of a narrow-minded attitude towards things or the safe zone preference based on conservative beliefs, prevalent practices and recency effect of happenings. Strong and concrete data has the power to shake people out of the herd mentality and of Utopian expectations based on rosy optimism rather than hard-hitting realism. Mostly intuitive decisions tend to land people in false situations, because they are taken either in haste or due to ignorance. Either way, it makes waste due to the hurry in which it is taken without any deliberation or any heed to the consequence, totally reliant on luck for the outcome, well if good, expected if bad. In case of ignorance, the risk is even higher as the stakeholder in question very conveniently underestimates the potential risk and can in fact land in a whole lot of trouble, based on the decision ending up seeming gullible, irrational and more often than not irresponsible and unreliable. Thus we can say that data plays a key role, be it that of the number of germs that a disinfectant can kill or that of the amount of disposable income in the economy that drives consumption, be it the household consumer or the government bodies, be it the decision of keeping yourself healthy or the nation, it is data alone that can be relied upon for a less blurred vision of the future through the spectacles of the past. If such decisions were to be made on the flip of a coin, only probability data related to the outcomes of a coin flip can tell us which side we would be losing, the health of the nation or the its people, either of which states the vulnerability of intuition as a tool for making choices against rationality which is but obvious the only choice to make when deciding, anything, big or small, for the better and not remotely for the worse. Note - Visitors shall not be able to comment on this article until they are logged in.19 points
-
13 pointsIn the FMCG sector, our company is rated among the top 5 organisations both by the consumers and industry. Much of the success is attributed to the increased consumer confidence and round-the-clock shelf SKU availability of our product line. The role of our Purchase Division has always been at the core for achieving this mark. Over the years our team under your guidance has been able to keep the inventory at optimum levels thereby helping the Production Unit to make delivery on time. It is due to the careful execution of our fundamental function - 'Material Management' which ensures that raw material is procured from the suppliers at the right time and in right quantities. This is the key to success in our sector and thus any minuscule improvement towards this can play an important role in raising our organization's bar. Our well maintained database of daily Material Management activities can help us in this direction for making more accurate estimations. An approach-'Data Driven Decision Making' can be applied in which assessment data and background information can be used to take decisions related to planning activities. According to a study by MIT Center for Digital Business, organizations driven most by data-based decision making had 4% higher productivity rates and 6% higher profits. With data driven decision making we can deploy Just-In-Time as approach and Material Resource Planning as the method for waste minimization in the purchase cycle. To demonstrate the strategic, operational and financial advantages of DDDM approach, we can consider the following conventional process being carried out at our unit. Under usual circumstances, we have to keep a safety stock of inventory items so as to counter the market and supply chain uncertainties. These may include logistics delay, plant failures, supply side variability, demand side variability and others. This leads to estimations made with the help of brainstorming methods within the team and experiential knowledge that cumulatively determine the amount of inventory to be ordered. With the help of estimations, performance is delivered in terms of fulfilling various conditions like on time delivery, safety stock, safety time related to inventory items. But there could occur estimation errors during the process due to which stores or warehouses can have lower or excessive amounts of inventory. This can affect the overall process efficiency both in monetary and operational terms. To improve this scenario, Data driven decision making mode can be deployed. Considering the situation that we faced last month. The production unit had given a demand forecast of 100 packs for one of our products and keeping safety stock levels in mind, we had ordered 120 packs. But we received only 115 packs from the supplier due to production based variability at his end which had not been a factor of consideration in our process. Also, the actual demand turned out to be 118 packs which was closer to our safety stock levels. So, overall we faced a shortage of 3 packs. From this we can identify that there is a chance of around 4% variability in delivery from supplier's end. This data if incorporated in taking decisions before ordering again from the same supplier can help us in achieving more accurate outcomes. This was an example of countering lower inventory received from the supplier where DDDM could have helped otherwise. Considering another situation that occurred 6 months back where we had ordered around 200 packs where as the production had ordered for 120 packs only but finally picked up around 150 packs from the warehouse. We had a rough idea of up-scaling from demand side as well as in the costs from the supplier's end due to which we increased the order. Though a more accurate estimation using DDDM would have given an additional gain by reducing the wastage of the remaining underutilized 50 packs as well. Using DDDM as one of our modus operandi would be convenient and beneficial too as its output depends on the quality of data gathered and a well managed database already in place can help us in reaping maximum benefits out of this investment. Further its effectiveness depends on defining the questions to be considered before analyzing the data and with your experience level in this area, we can easily frame pertinent questions to get relevant results from the data. Data driven decision making would give us added advantages of faster processing, refocusing our resources to increase the yield, relevant data backing to explain our rationale behind purchase decisions to the management, foreseeing the opportunities and threats in the market and overall supply chain. Over a period of time, this approach can also lead to building a reliable group of suppliers giving us a competitive advantage gained by adopting a data backed strategic purchasing model. An early adoption of Data driven decision making would bring maturity to our supply chain infrastructure and resilience towards unforeseen circumstances so that we can quickly respond to them without compromising on financial and operational aspects. Note - Visitors shall not be able to comment on this article until they are logged in.13 points
-
As a Computer Illiterate growing up in the new millennium, I had tremendous difficulty making sense of how to do most of my stuff. Most of my decisions were snap, on-the-moment and intuitive ones. By the time I was in my teens, I had learnt my way around the big computer problem. My experiences and the Great Indian “Jugaad†mind-set had provided me with a sufficient enough method wherein I only worked on the computer when absolutely necessary. If there was any other way to do the task, any escape route, I gladly followed it. By now you must have realised that I was and am sceptic and data-averse. Data to me was always those unreadable files that eat a hell lot of my storage space. I was gaining proficiency in getting around this data problem and along came Big Data. Everyone from Google to Barrack Obama was using it.[1] As a student at one of the most prestigious B-Schools in the knowledge market, not only was I supposed to know what it was, but was expected to be able to tune in and utilise it to make a difference. Life has strange ways of getting back at us, mere mortals, and here was my customised gut wrenching sucker punch. The fighter in me knew I had to do this, but I did not find a way I could. A 3 month long research in the field led me to Data Driven Decision Making or D3M. Simply put, it is the pleasure of sipping a coffee in your office chair while you watch your computer work up some algorithms and provide you invaluable decision making tips to face some of your most frequently encountered problems. Immediately after, I experimented with the different sorts of decisions that can be made with D3M. The results were a true eye-opener. If we think of decision making as a broad spectrum from operational decisions at one end to strategic decisions at the other. Operational decisions can be characterized as highly structured, routine, short-term oriented and increasingly embodied in sophisticated software applications. On the other hand strategic decisions are taken by the top management and serve to set the long-term directions, policies and procedures of an organization. They tend to be complex and unstructured because of the uncertainty and risks that generally accompany longer term decisions. In between these two extremes, we can have varied decisions including non-routine ones in response to new or unforeseen circumstances beyond the scope of operational processes, and tactical decisions dealing with the necessary adjustments required to implement longer term strategies. [2] Half a decade ago, D3M could have only helped you with the more structured forms of decision making but no more. With the advent of Big Data, machines know much more about humans and human behaviour than humans themselves. Sample this, personal analytics can actually allowed me to analyse my Whatsapp chat history and find why most of the girls I chatted with refused me a date. The word cloud usage showed me that my texting skills were uninspiring to say the least with the most common words being “ok†and “yaâ€. I realised I needed to be more creative and engage better. What did not help was that most girls chatted in the window of 8-12pm whereas I had the habit of taking a short nap at the time. Also it helped me identify my most productive work hours and helped me plan out my work better. Thus far, all seemed well with D3M but on further research most early moving corporates into the field were still undecided on its benefits. A closer look exposed a distinctly similar pattern in them. Most early moving managers thought that D3M will help them save money or time or both. Research shows that they are misguided to say the least. D3M does neither, atleast not in the short term. What D3M does allow though is discovering solutions you never knew existed. What it will do though is finding needles in the haystack consistently. Another interesting insight was that D3M depends a lot on the data collection. Great collection leads to great results. All we are required to do is ensure data cleanliness, variety and velocity. In his book, Data Driven: Profiting from Your Most Important Business Asset, Prof. Thomas Redman summarizes the whole decision making via data as “Good decision makers follow at least three Bayesian principles. First, they bring as much of their prior experience as possible to bear in formulating their initial decision spaces and determining the sorts of data they will consider in making the decision. Second, for big, important decisions, they adopt decision criteria that minimize the maximum risk. Third, they constantly evaluate new data to determine how well a decision is working out, and they do not hesitate to modify the decision as needed.†After months of thorough investigation and experimentation, I have arrived at this conclusion, “To stay a step ahead in this ever competitive world, using Data Driven Decision making is a must. So let D3M take care of all the external data that you need to work with and let your mind focus on understanding “the data from insideâ€. That will surely lead you to not just success but contentment. References 1. http://swampland.time.com/2012/11/07/inside-the-secret-world-of-quants-and-data-crunchers-who-helped-obama-win/ 2. http://blogs.wsj.com/cio/2013/09/27/data-driven-decision-making-promises-and-limits/ Note - Visitors shall not be able to comment on this article until they are logged in.13 points
-
12 pointsData driven decision making (DDDM) As it is rightly said by Plato, “Necessity is the mother of inventionâ€; it comfortably fits in the life and business perspective. In today competitive world, we cannot even think of succeeding over others if we are not better than them. It is applicable in both day to day lives as well as in Businesses. In day to day life, we have numerous examples of us competing with our colleagues for ranks, posts or various other things. But it is the candidate which has better skills and qualities will always succeed. This thing is also applicable to a larger extent to businesses where every day lakhs and crores of transactions are performed. Any organization should use all its data available judiciously and all the decisions should be based on these data instead of personal beliefs. This process of making decisions based on data is called Data-Driven Decision Making. In a recently published article, “Data Science and its Relationship to Big Data and Data-Driven Decision Making,†Foster Provost and Tom Fawcett define Data-Driven Decision Making as “the practice of basing decisions on the analysis of data rather than purely on intuition.†Equally succinctly, they view data science “as the connective tissue between data-processing technologies (including those for big data) and data-driven decision making.†This DDDM is being viewed as a tool to help people make smarter, more effective decisions. Also according to Electronic Learning Assessment Resources (ELAR), a DDDM focus uses student assessment data and relevant background information, to inform decisions related to planning and implementing instructional strategies at the district, school, classroom, and individual student levels. Even the concept of Data literacy meaning “a person possesses a basic understanding of how data can be used to inform instruction†is closely inter-weaved with DDDM. We can say Data Literacy as an underlying technique of use of DDDM. Considering the reference from the research paper “Strength in Numbers: How Does Data-Driven Decision making Affect Firm Performance?†by Erik Brynjolfsson, MIT & NBER Lorin Hitt, University of Pennsylvania and Heekyung Kim, MIT. A detailed survey data on the business practices and information technology investments of 179 large publicly traded firms, it was found that firms that adopt DDD have output and productivity that is 5-6% higher than what would be expected given their other investments and information technology usage. Such surveys and studies have every now and then showed the importance of data in taking important managerial decisions. Even the share-market is not luck or belief based. It is based on various complex logics which have to interpreted using different other factors. So it is the need of the hour to work on the data analysis for having better forecasts, demands and market scenarios. If we see all the prospering companies of the world, they go by numbers. It is the challenge on the part of the management to lead the organization towards data-driven decision making. This DDDM is important because of the following reasons: 1. Commodity priced computing 2. Massive file system storage and retrieval technology 3. Bandwidth 4. Smart devices: Records are everywhere Keeping in mind these important factors, it become necessary for any company to take decisions very precisely as each and every decision has very long term effects on the company and its revenues. Recently, so many technologies have evolved including Big Data which have made the analysis of data far easier as it was earlier. Now even small information which is sort out of crap data is very useful for the organizations in taking future decisions. In last few year many new organizations had come up which provide services in the field of data analysis which indirectly helps the companies hiring them. Lots of social networking sites provide some data which are used by these analysts to provide related advertisements to the people. This explosion of decision making from personal instincts to data driven can be largely attached to Big Data. With the advent of Big Data, this has come out even more drastically and most of the companies shifting towards it. Lot of money is being invested in getting meaningful data out of bulk of data available in the companies. It’s not surprising that data-driven decision making is one of the most promising applications in the emerging discipline of data science. It has an explosive growth. There are large numbers of characteristics of Data which have to study before taking certain decision. These include variety, volume, velocity, veracity, variables and sources. In finding meaningful information from the raw data the following steps are to be followed: 1) Collect all data from various sources 2) Create a file of raw data and arrange properly 3) According to predefined index, interpret the data to make a data file 4) Analyze this data file generated This complete procedure is a basic process of DDDM. It has to be followed if the accurate analysis is required. In a nutshell, we can conclude that this data driven decision making is the need of the hour and each and every company should move towards it as soon as possible. It may be looking a tedious and unnecessary at the present moment but its long term effects are very soothing and beneficial for the entire company. References: · http://blogs.wsj.com/cio/2013/09/27/data-driven-decision-making-promises-and-limits/ · http://online.liebertpub.com/doi/full/10.1089/big.2013.1508 · www.a51.nl/storage/pdf/SSRN_id1819486.pdf‎ · https://www.950.ibm.com/events/wwe/grp/grp017.nsf/vLookupPDFs/Michael%20Kowolenko%20Presentation/$file/Michael%20Kowolenko%20Presentation.pdf Note - Visitors shall not be able to comment on this article until they are logged in.12 points
-
Q1 - How would you define, compare and contrast the following terms - Personal Excellence, Process Excellence, Operational Excellence and Business Excellence? (In your answer to this question, please explore these in detail and you may like to cover the following and more - You may like to explain how these are related. You may like to mention if it is possible to achieve one in absence of another? What should an Organisation actually pursue? What kind of approaches, techniques do you think are naturally likely to be included in these terms, etc.) You may like to carry out research over the internet, talk to your partner, and colleagues while framing your response. Each club may submit maximum two responses, one by each member. Please write the answer in your own words. Please do not copy and present someone else's explanation as your own. As Excellence Enthusiasts, we are against plagiarism. Note for website visitors - Two questions are asked every week on this platform. One on Tuesday and the other on Friday. All Questions so far can be seen here - https://www.benchmarksixsigma.com/forum/lean-six-sigma-business-excellence-questions/ Please visit the forum home page at https://www.benchmarksixsigma.com/forum/ to respond to the latest question open till the next Tuesday/ Friday evening 5 PM as per Indian Standard Time. The best answer is always shown at the top among responses and the author finds honorable mention in our Business Excellence dictionary along with the related term.10 points
-
Excellence : Excellence is defined as the quality of being extremely good So what is Personal excellence? In simple words, setting up the bar higher [benchmark] in whatever activities, the individual(who is compared with the rest) does. Process Excellence: Providing an environment where the processes are highly stable and controlled with a minimal or no variation and with minimum or no wastage(Muda). Focus is on continuous improvement to ensure processes are highly stablized Operational Excellence: It reflects the way how as a person, unit, you or your team/organisation excel at parameters such as Cost, Human Resources, scope, time, quality etc.,. By excelling at this, the provider of a service, can provide value to the customer with optimal/maximum efficiency. Business Excellence: It is through which you make your business, with effective strategies ,efficient business plans , best business practices so that optimal results are achieved at a sustained rate. How each one is related to the other one(s): Personal Excellence is directly tied to Process Excellence. If and only if the individual is interested to adhere to the processes laid out, then process excellence or for that matter any other activity can be successful . If the cultural shift/mindset is not there amongst the individual/team , then no change would work. This can be represented by the formula : Quality of the solution (Q) * Acceptance of the solution (A) = Effectiveness of the solution (E). Unless there is an acceptance to any thing (which is the human part) nothing can be done. So if the individual has the desire to excel at his/her work, then he/she would strive to make sure he/she/the organization achieve Process Excellence. Process Excellence provides a way for continuous improvement. Purpose of process excellence is to streamline all the processes , make them stable and in the process to achieve minimal degree of variation and minimal wastage. By having a process excellence system in place, grey areas in Operational excellence and Business excellence can be identified and improved/rectified upon. Practically it is difficult to achieve excellence in one when another one is absent. For instance, Business and Operational excellence would require process improvements. If streamlining does not happen there then there is no excellence in Business and in Operational aspects as well.Similarly without human intervention or the elevated mindset of the individual, it becomes difficult to successfully run the processes at a top-notch. From an organisation perspective, the organisation should Provide a conducive environment to work with wherein by individuals can be encouraged to share their ideas/thoughts and create a transparency, making them feel belonging to the organisational/unit's problems/constraints (Personal Excellence) Encourage individuals to showcase their creativity in designing/providing solutions to problems (Personal Excellence) Create Challenging contests and rewarding people on various categories such as best creativity,best solution, optimal solution,... (Personal Excellence) Setup process standards and metrics for each parameter(Define the expectation).Set the Upper & Lower limit & also customer specification limits (Process Excellence) Conduct awareness sessions on process expectations with reasoning and justifications. Provide details with SMART goals (Process Excellence) Ensure that individuals/teams adhere to the standards with constant monitoring through Audits/Inspections/reviews. (Process Excellence) Look out for scope for continuous improvements periodically and accordingly adjust the process baseline if required. (Process Excellence) Define the Operational parameters that requires excellence. (Operational Excellence) Conduct awareness sessions to key stakeholders on those operational parameters and provide the plan on when and how to achieve them (Operational Excellence) Ensure the status of operational excellence through Project Management Reviews/status reports and other similar artefacts and address the deviations (Operational Excellence). Preserve the best practices that were followed to achieve Operational Excellence (Operational Excellence) Define the strategies/plans needed for improving the business results (Business Excellence) Define the best practices in getting business-oriented goals/activities done (Business Excellence) Conduct Confidential meeting with key stakeholders and provide the envisaged plan to them and convey your expectation (Business Excellence) Conduct monthly/quarterly review meetings with respective units and look onto the 4-quarter dashboard. (Business Excellence) Get Business Mgmt section of Customer Satisfaction Survey from the customer to see if organisation is in target with its objective (Business Excellence) Document the outcome of the business results and the effective means to achieve them (Business Excellence)9 points
-
7 pointsCause is a variable which affects the outcome by increasing its chances or making it happen. Problem is the outcome of the cause. Scenario Understanding Conclusion Action A cause (X) may be necessary but not sufficient for a problem (Y) to occur. Problem (Y) occurs ONLY when cause (X) is TRUE Problem (Y) may not occur even when the cause (X) is TRUE Causes other than X (A, B, …) must occur together with X for problem Y to occur Fix the cause (X) to remove one of the factors causing the problem (Y) however this will not fix it so look for other causes (A, B, ..) that result in this problem (Y) and address them too to fix the problem (Y). A cause (X) may be sufficient but not necessary for a problem (Y) to happen. Problem (Y) occurs whenever cause (X) is TRUE Problem (Y) can occur even when cause (X) is not TRUE Cause X is a definite cause for the problem (Y), however other causes (A, B, … ) can also result in this problem (Y) Fix the cause (X) to address some scenarios in which the problem (Y) occurs. However look for other causes (A, B, ..) which may also result in this problem to fix it for all scenarios. A cause (X) may be neither sufficient nor necessary for a problem (Y) to occur. Problem (Y) may not occur even when cause (X) is TRUE Problem (Y) can occur even when cause (X) is not TRUE Cause X is not established as a reason for the problem (Y) Fixing cause (X) may not fix the problem (Y). Look for other causes (A, B, ..) which are likely to be more relevant cause for this problem (Y) A cause may be both sufficient and necessary for a problem to occur. Problem (Y) occurs ONLY when cause (X) is TRUE Problem (Y) occurs whenever cause (X) is TRUE Cause X is a definite cause for problem Y Fixing cause (X) may fix Y completely.7 points
-
7 pointsMost of the textbook definitions of Six Sigma talk about Six Sigma being a strategy, methodology, metric, philosophy etc. There is another definition that I use in my training programs frequently. Lean Six Sigma provides you with world best methods of data driven decision making. If you are working in an organization or running a business, it is inevitable that you shall need to use data in decision making. Some pointers that highlight the importance of data driven decision making are given below. Even if one uses brainstorming techniques with teams, one can generate and use data.The use of basic cause-effect approaches for analysis like fishbone diagram get strengthened only by effective use of data.All functions in an organization generate data of various kinds. It makes sense to learn correct methods and techniques that help in decision making for business success.Analysis of wastes in a process requires data (like cycle times, takt times, value added time, non value added time, productivity, etc)Finding whether internal/ customer requirements (or regulatory requirments) are met requires data driven techniques like hypothesis testing.Forecasting methods are essentially a set of data driven techniques.Comparison of two or more sets of data( for comparing vendors, technology, techniques, materials, processes, customer types, teams etc) is a common need.Market research or R&D makes us of data all the time.Problem Solving is strengthened by usage of data.Project Management requires data driven decisions.Performance management cannot be considered fair unless data is capured, analyzed and used properly.To get more ideas on how Lean Six Sigma is useful in a specific Industry or Functional area, please make use of tags present at the top right section (found after clicking on forum tab above).7 points
-
At our e-commerce product company, we have an AI powered search and recommendation engine feature. It can be configured on each customer project to leverage multiple data sources (ERP, e-commerce, PIM, purchase history) to personalize search and product recommendations. Personalization features include adjusting results based on purchase history, brand preference, and customer profiles. Our learning has been The recommendation engine can personalize shop assortment for different customer segments. While designing customer flows for this feature, we must ensure that the engine does not unintentionally limit catalog visibility or surface exclusive categories disproportionately. If historical purchase data, browsing patterns, or segment profiles reflect societal biases (e.g., preferences along gender, age, ethnicity, or socioeconomic lines), the algorithms can and will replicate and propagate these biases—such as recommending certain products less to some demographic groups or showing limited assortments. Segment-based catalog restriction could reinforce silos and limit choices for certain customer groups, mirroring or reinforcing pre-existing marketplace or data biases. Customizing algorithmic weighting based on customer profiling without scrutiny could favor or disadvantage groups. We had a real example of a sports attire retailer using our product where we experienced that “Inclusive Sizing” (sizes beyond standard American XS–XL, such as plus sizes or petite/tall fit) appeared in only about 10% of products in a given search result. The dynamic facets logic tended to omit these size attribute from the filters entirely. As a result: Customers seeking inclusive sizes were unable to filter effectively. The represented bias favoured mainstream size ranges, thus marginalizing niche segments. The system then further skewed visibility toward products that align with majority sizing, and had potential to worsening representation over time. Some real world complains from users were - "I can never find anything smart with a good price in my size unless they are your top-of-the-line products" - "I see models wearing new designs in the ads but I can't find enough trendy but age-appropriate colours on the website" Additionally, one real risk that was evaluated was that our model/engine might consistently push popular products from high-traffic regions, while under-representing niche or emerging markets. This not only skews visibility but may also limit growth opportunities for less dominant segments. Some steps that we have attempted to apply Design Phase - Curate diverse and representative data inputs - Allow manual overrides for known critical attributes and for attributes deemed socially or commercially significant (e.g., inclusive sizing, accessibility features) were treated as “defined facets,” ensuring consistent visibility regardless of prevalence. - Ethical guardrails in personalization logic: Forbid certain features (like region or size) from driving recommendation weighting unless justified. Testing Phase - Synthetic Test Profiles across demographics - Manual Testing to find if the engine is developing such biases Monitor and Audit Facet Presentation - Track which facets are consistently hidden across queries and evaluate whether they represent systematically underrepresented groups or product lines - Before releasing compliance review is emphasized on Legal, Privacy(GDPR), Security & Accessibility These proactive steps are now taken on early and help ensure our AI serves all buyers fairly, avoiding the “bias in, bias out” trap in new implementation projects.6 points
-
I suppose everyone agrees that if one is not good with numbers, career growth is likely to face a serious roadblock at one stage or the other. I have noticed several people who fear mathematics and this leads to certain problems in learning or applying Six Sigma. Many have already given up hope assuming that they can never cover up. Good news, however is that this weakness can be addressed by most people. It definitely needs a persistent effort to capture Mathematics concepts that are really important. Some of these are Algebra, Data Handling, Decimals, Equations, Exponents and powers, Fractions, Graphs, Integers, Mathematical modelling, Mathematical Reasoning, Probability, Proportions, Ratios, Rational Numbers and Statistics. If you are one of those who felt this way and wish to improve your math, I can provide you a step by step approach which shall broadly follow the sequence below. Plan study time for these topicsUse the uploaded materialStudy identified topics and answer questions provided in the text. Check your answers with answer key provided.Conquer your weakness and face the Six Sigma world more confidently.In case good number of people see value in such a sequence, I shall be putting in extra effort and make the content and sequence available to you free of cost. I have written this post just to know whether there are many people out there who really wish to use such content and approach. Reply to this post showing your interest so that I can view the count. Best Wishes, VK6 points
-
Data Driven Decision Making - injecting rationality in your gut feeling Sector: Banking Sector in India The data centricity of banking industry is the universal truth. Traditionally banking has been the one sector which handled the maximum data about any person that are particularly critical and dear to those persons as they deposit their trust with the banks in the form of their finances. In the recent times this has been further reinforced with the RBI implementing the “Know your Customer†mandate that aims to compulsorily maintain the customer data which should be relevant, concurrent & authentic. Despite the proliferation of such data, effective analytics and data mining techniques has been at its elusive best. The information industry has grown leaps and bounds and the remarkable advances in analytics software and its processing power aided by the cloud computing systems is just the tip of huge iceberg of potential that such data is capable of achieving. As the industry tries to grow out of the recent financial crisis towards the shady future of uncertainty, banking and retail banking in particular must inculcate the power of analytics in them to be able to improve decision making, indulge in constant innovations which ought to become the bread and butter for survival & be more compliant with the stringent financial regulatory environment that the RBI is supposed to impose for greater control. The siloed approach to banking should give way to enterprise wide resource planning (data being the most critical resource) for fostering greater transparency, efficiency & effectiveness through integration and unified image of the entire sector. This will also help in garnering greater customer trust & rejuvenate customer relationship which is the single most critical factor for survival in times of uncertainty, mistrust & risk. The recessionary trends have forced the clientele of banks to a more frugal approach to managing their funds. Careless consumption has been replaced by need based one and “ROI†has suddenly become the buzzword which never had such a great reputation except amongst the business houses. However it is interesting to note that despite reduced spending the world has not stopped itself from the adoption of latest technologies. Be it smart phones or social media presence the huge numbers are truly defiant of the existing economic conditions and its implications. Such behaviour re-confirms the value of innovations in today’s society besides such channels could provide source of huge data tapping which can help retail bankers to provide a more rewarding experience to their customers enhancing their brand loyalty. The usage of “Big Data†as the new window to the world of increased productivity, innovation & competition is important to be considered here. The rapid adoption of analytical tools would help banks process the information they have into market knowledge which would enable them to differentiate themselves through service excellence. It may sound contradictory that previous paragraphs talked of unified image and integration and now differentiation is promoted. Well, competition has been and will always be the root for future growth without which the need for existence of mankind comes under the radar. Rather we should look at a new dimension of competition – “Competition through Cooperation†where competitors would be on the same page with respect to technology and new inventions yet they would have to constantly evolve themselves to be relevant. Advanced analytics provides the banks with a new path of continuing business by overcoming the obstacles of risk and uncertainty, the prime growth drivers being stricter regulation, better risk management, effective strategising and stronger CRM. The various ways to achieve data salvation is revealed as below: The analytics software would speed up the financial and risk reporting services as required by the new norms as and when implemented by the government ensuring service delivery with no or minimal cost. The usage of Enterprise wide data architecture would provide a single version of banking creating transparency and restoring customer confidence. Data crunching would enforce better risk management by identifying malicious transactions and preventing its recurrence. Usage of technology to combine past and current data can help in predicting future scenarios with greater accuracy and provides an opportunity to face the shady future in a planned manner with confidence. Besides the data analytics tools may be used to boost revenues as well like, Customer data analytics – enhance service and bring more clients Investment analytics – improve lending process Process analytics – find process inefficiencies and take corrective measures thereby reducing costs, to name a few. [*]Data collection from various sources like KYC, social media websites etc... and it analysis using Big Data and relevant technologies can help in providing customized banking solutions, new financial products to suit customer needs & gather feedback on marketing campaigns launched. This would lead to greater customer satisfaction and tighter relationship. Mobile banking is the new brainchild of the banking sector that allows customers carry out transactions on the move. This means greater volume of transactions to be handled and the usage of analytic software to integrate data across channels become essential. Also multichannel banking is constantly evolving with the endeavour of providing cross channel banking across websites. So far the discussions lead us to the conclusion that usage of Data Driven Decision Making through Data Analytics & ERP is imperative to the future competitiveness in banking industry. But there are major speed breakers in the path to this rediscovery, which are as follows: Modifying existing IT infrastructures and the corresponding data migration might incur substantial initial costs Using analytics at the strategic level would require identification of relevant data and standardization of processes and data structures Resolving frequent data issues & inconsistencies that exists in the customer data in the baking domain Required expertise in analysing data points, process expertise & technical expertise is important Support & Initiative of key stakeholders Finally the embracing of analytics as a service depends on the internal culture and dynamics of the organization. Hence to successfully implement the same nurturing of the employees to convince them of the power of data driven decision making is very crucial. However the conviction in employees can be developed only if the leaders & top management of the enterprise believe in the vision of “Analytics as the future of bankingâ€. Hence the purpose of this article would be to inspire the top management, so that they can realize the importance of using data in their organizational decision making and inject rationality in their decision making. Note - Visitors shall not be able to comment on this article until they are logged in.6 points
-
While ChatGPT warns about the inaccuracies, some people tend to follow ChatGPT's responses for questions that are not straightfrward. This is a risky approach. Have a look at the following chat to understand more. Now this error is not a small one. I explored further Of course, Google Maps is not a ride-hailing service. So, I continued. The takeaway - ChatGPT is not a reliable tool for questions that are not straightforward.


 5 points
 -
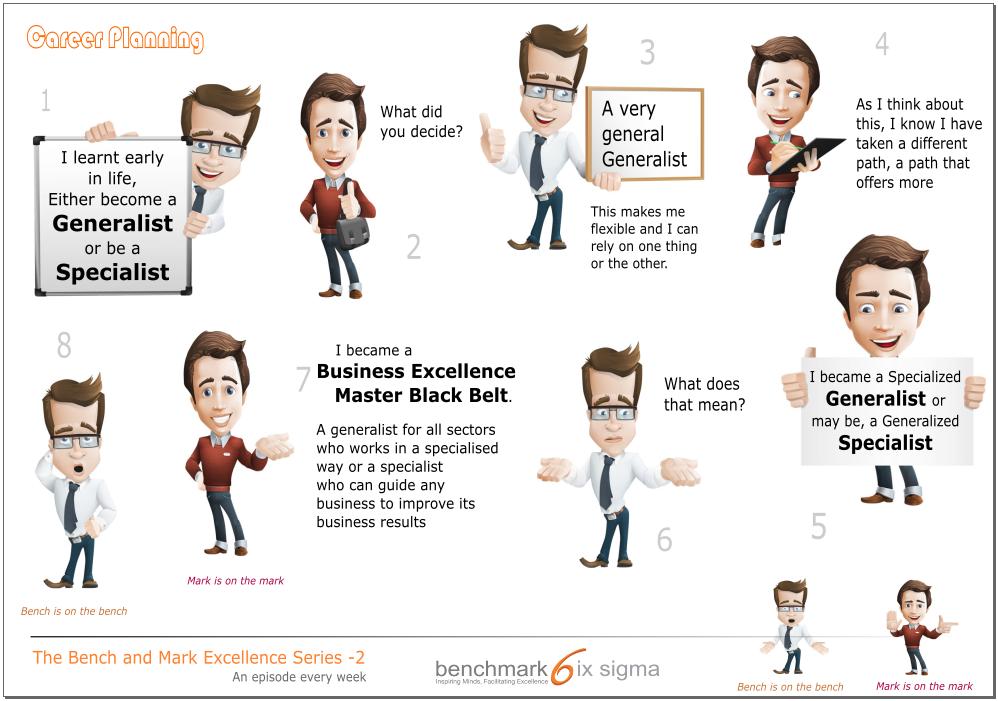
5 pointsDescription - Bench happily highlights that while planning his career, he had considered the choice between being a Generalist or a Specialist early in his life. Mark wants to know about the decision that he took. Bench says that he decided to keep options open for himself and proclaims himself as a "very general Generalist". After listening to Bench, Mark says that he has realized that he has taken a path different from the two options. He considers himself as a "specialized Generalist" or what can be considered as a "generalized Specialist". Bench want to understand what this means. Mark explains that he is a Business Excellence Master Black Belt. He calls himself a generalized Specialist as he specializes in problem solving which he can do in any sector. He further explains that he could be considered a generalist too as he can work with large variety of processes but in a specialized way. This cartoon depicts that Lean Six Sigma and Business Excellence competencies allows one to be specialized without dependence on a specific industry or functional domain.
 5 points
 -
5 points5 pointsMisuse of tools and techniques is a very common phenomenon. Misuse of a tool primarily happens because of two reasons 1. Intentional Misuse (it is better to call it as Misrepresentation) 2. Unintentional Misuse (due to lack of understanding of the concept) Pareto analysis or the 80/20 rule is a prioritization tool that helps identify the VITAL FEW from TRIVIAL MANY. 80/20 implies that 80% of problems are due to 20% of the causes. Intentional Top 20% causes might not be the ones leading to bigger problems - usually it is observed that causes with smaller effects occur more often. Applying the Pareto principle will divert the focus of the team to the causes that have a smaller effect on the customer while the actual cause might be languishing in the trivial many Prioritization without keeping in mind the goal - Pareto will help if the significant contributors identified help us achieve the goal. However, it is seldom checked whether the VITAL FEW will help us achieve the goal or if there is a need to take a larger number of causes. As an example, if our goal is complete defect elimination, we will need to consider all causes. If our goal is elimination of 95% defects, we will need to cover more of the cause. Unintentional Going strictly by the 80/20 rule - some people take the 80/20 principle in the literal sense. They will do a Pareto plot and blindly apply the 80/20 principle. What needs to be noted is that 80/20 is a rule of thumb and it is not necessary to always have 80/20 split. It could also be 70/30 or 90/10 Keeping the total to 100 = 80+20. This is one of the most common misunderstanding of the 80/20 rule where one beliefs that the sum should always be 100. It could be 80/15 or 75/25 as well Unclear about the purpose of using a Pareto Analysis. Pareto can be used while defining afocus area and also in Root Cause Analysis to identify significant contributors. In the former, data is for problems and their occurrence while in the later, it is causes and their occurrence. Due to lack of clarity of purpose, if problems and causes are clubbed together in the same Pareto, then meaningful inferences cannot be drawn. Treating Pareto as a non-living tool - Pareto is usually done once and the same result is treated as sacrosanct for a long period of time. Pareto chart only provides a time snapshot. Over a period of time, the defect categories or causes and their occurrence numbers might also change and hence if Pareto Analysis is done at different points of time, it might yield different results Some that could fit in both categories Small data set - Pareto Analysis will help if you want to prioritize vital few from a big data set. Doing a Pareto analysis on 4-5 categories will seldom yield a good result Completely ignoring the trivial many - Pareto analysis helps identify the vital few but it does not say that one should ignore the trivial many. It simply states that first fix the vital and then move on to trivial. However, most people consider that if they fix the top 20%, they do not need to work on the remaining. Pareto can be used to continuously improve the process by repeatedly prioritizing the causes that you need to focus on Doing Pareto at a high level only - Like most of the tools in Root Cause Analysis, Pareto can also be used to drill down. E.g. Pareto can be done first to identify the top defect categories and then a second level Pareto can be done for the top defect categories (using the causes)5 points5 pointsBy and large, we come across situations where we favor the mean value of the outcome of a process (central tendency) to be focused around a specified targeted value with as less variation as possible (dispersion). There are situations where the variation assumes relatively higher importance than the central tendency; mostly because higher variations are more intolerable than some shifts in central tendency. Interestingly, there may be certain situations where variation or controlled variation is advantageous as well. Study of Process Potential: The process potential index Cp is used to study the variation, or spread of a process with respect to specified limits. While we study process potential, we are interested in the variation and not in the central tendency. The underlying idea is that if the process is able to maintain the variation within specified limits, it is considered to possess the required potential. The centering of mean can always be achieved by setting adjustments. Or in other words, if Cp is not satisfactory, Cpk (process capability) can never be achieved, since Cpk can never exceed Cp; it can at best equal Cp. Many examples where the variation is generally considered unfavorable to the outcome: 1. Analysis of Variance While evaluating whether there is a significant difference between means (central tendency) for multiple sets of trials as in ANOVA, the variation between sets and within sets are compared using F tests. Thus in such situations, the variation comparison assumes high importance. 2. Relative grading systems For many competitive examinations, the concept of ‘percentile’ is used, which is actually a relative grading system. Here, more than the absolute mark by a student, the relative variation from the highest mark is more important, thus the relative variability becomes key decisive factor. 3. Control chart analysis While studying a process variation using a control chart, first the instability and variation are given the importance. Only if we have control on these parameters we will be able to meaningfully study the ‘Off-target’ i.e. the central tendency. 4. Temperature variation in a mold While performing certain compression molding process, temperature variation across different points on the surface of the mold does more harm than the mean temperature. Here the mean temperature is permitted to have a wider tolerance, but the variation across mold does more warping of the product. 5. Voltage fluctuations Many electrical appliances get damaged due to high variation (fluctuation) in the voltage, although the mean voltage (central tendency) is maintained. Controlled variation is favorable: 1. Load distribution in a ship While loading a ship the mean value of the load can vary, but the distribution of the load is more important to maintain the balance of the ship on water. 2. Science of music Those who understand the science of music would agree that more than the base note, the appropriate variation of the other notes with respect to the base note is extremely important to produce good music. Some examples where variation is favorable: Systematic Investment plans (SIPs) take advantage of the variation in the NAVs to accumulate wealth. Here even an adverse shift of the central tendency is compensated by the variation! Law of physics states that Force = Mass x Acceleration (F = ma). Thus, if we consider speed as the variable, it is the variation of speed that decides the force and the mean speed (central tendency) appears to have little relevance.5 points5 pointsGeneric Definition: Necessary means something needed. Sufficiency - an amount of something that is enough for a particular purpose 1). A cause may be necessary but not sufficient for a problem to occur: This means that the problem did/do not arise because of a single cause. There could be multiple causes which could lead to the problem Eg: An Application running in the system is responding very slowly. We could think that it could be due to less memory space in hard disk/RAM . But it may not be the only reason. It could be due to too many applications opened up thereby busying the CPU. It could also be because of some heavy processes running in the background or any other reasons. So our approach should be: a). To find out what other causes could be there which can make the problem to occur. b). Do try to drill down with 5-Why analysis or tree analysis of the problem or make Fishbone analysis and find out the other causes/category of causes. 2). A cause may be sufficient but not necessary for a problem to happen: This implies that a particular cause can be a potential source for the problem to occur but not necessarily be the primary one which will create the problem. Eg: If System "Welcome Screen" (logging in) taking time is a problem, then increasing the RAM size may be useful but it may not necessarily be increasing the speed as still the Processor CPU/Processor Speed(Frequency) could need to be addressed. There could be some more ways which can make this speed increased to Our approach should be : a). Find out the ways to have necessary conditions and satisfy sufficiency 3). A cause may be neither sufficient nor necessary for a problem to occur This portrays the fact that you are aware of the causes and have sufficient and needed information to resolve.But still there is a better workaround to ensure that problem does not occur Eg: You/Your organisation has technical challenge on Non Functional requirements and you think you know the causes and has sufficient and needed knowledge. However It will take 2 months of time for your team to complete this . But management outsources this to expedite this activity. So the approach should be a). To make effective use of the alternative method/approach that is being planned out for the problem. 4). A cause may be both sufficient and necessary for a problem to occur This means that initial assumptions are made on the necessity and sufficiency of causes, for a problem. Eg: If the problem is the smelling(bad odour) of Septic tank of the house, then immediately the assumption is made that the tank could be full and hence the smell is arising. So our approach would be : a). To validate as much as you can to ensure that the assumptions made are true. If not, then course correction needs to be done b). Depending on the assumptions , we need to proceed. If assumptions are false, then follow one of the approaches from the remaining 3 options/conditions5 pointsCreating an idea is personal excellence. Creating efficient process for that idea is process excellence. Executing that idea effectively is operational excellence. Gaining profits through that idea is business excellence.5 pointsI observed that the scope of six sigma has increased it is now applicable in many industrial sectors. When Bill Smith created this methodology his main focus was defect reduction and improvement which brings excellence and process improvement, later on Quality formed the core of other methodology/framework too. I have seen that the approach of employees toward quality management has not yet changed, they still consider this as the job of quality unit, as for them quality means compliance, reporting, QMS manual and most importantly Audits. I found that organizations are spending good amount of money in quality related training/workshops/paperwork etc. but still are not successful in changing the approach of individuals. At high level, every organization’s policy talks about quality and its importance but at ground level due to fixed processes, departmentalized structure it become a task of small number of people, like managers and specifically of those who belongs to quality department, since it’s their job. Induction program- By definition an induction program is an important process for bringing staff into an organization. It provides an introduction to the working environment and the set-up of the employee within the organization. An induction program is part of an organizations knowledge management process and is intended to enable the new starter to become a useful, integrated member of the team. But I believe now organizations have a need to adopt a new approach of induction program: Organizations should provide Process Excellence/Quality training to each and every employee at the time of induction, this training they can design as per the requirements of their LOB (Line of Business). Also when induction of an employee gets conducted at that time we can tell employee that they are suppose to share their views (positive or negative) after six months from now about quality of process/operation to which they belongs (preferably through a presentation) so that this training of quality not become just a training and they feel involved with the things they have learned. This kind of treatment at induction will make employee responsible for his own quality as well as quality of his team and organization. Why this should be done at induction program because when we start with induction: 1. The new employee will feel himself linked with the quality department. 2. This will make new employee feel that he is responsible for the quality of operation to which he belongs. 3. This will convey a message to employee that organization has a serious approach towards quality. This approach will bring mutual benefits and this also links with the high level objective of each and every organization that is “alignment of individual objectives with organization’s objectiveâ€. Now the question comes since induction is for new employee what will happen to those who are already working? For this we need not to do anything but to ask them to attend this “Quality session†which we are conducting for new employees and they can join this from there and then. I believe that each and every individual should feel himself responsible for quality and there is a need to make quality a routine habit rather than an event.5 points“A point of view can be a dangerous luxury when substituted for insight and understanding. – Marshall Mcluhan †We all have come a long way from industrial revolution where mass production and consumption was the order of the day. Over the years, the once not so knowledgeable consumer has transformed into a living storehouse of information. What has changed over the years? Why did the companies who were the industry leaders at one point of time failed miserably later on? What changed? The answer to all this lies in data. In our thirst to find newer markets for products and differentiate them from our competitors, we pushed the consumer towards seeking knowledge and then when he demanded, we failed to live up to standards. We pushed the customer to give more importance to value i.e. value today has become emergent as compared to the old times when it was measurable. Now the new age customer wants more and he/she will switch, the moment he/she finds more value from another product or another competitor. How do we live up to this? Given the rapid changes in technology and the rapid adoption of management information systems by almost all industries, we need not look further. We have the solutions but we are too thick skinned to look at it. Today’s customer is like a walking hard drive with copious amounts of data. What we need to do is analyse it, find patterns where none exist, combine it with the experience of mankind and predict the needs and demands of future backed by strong data analysis. If we stop and look back into the history what will be distinctly visible to us is the fact that companies that were present in the first list of Standard & Poor’s 500 only 74 remain in operation today. Almost half of the 25 companies that passed the rigorous test for inclusion in Tom Peters and Robert Waterman’s 1982 book “In Search of Excellenceâ€, have gone bankrupt or have shut down due to poor performance. The reason being that when organisations are thriving and successful, it creates an illusion that whatever gave them success in the past will work in the present and still remain valid in the future. They forget the fact that the world is constantly changing, constantly evolving and to survive they need to evolve with it too. Today there is no dearth of examples of companies that failed after achieving success on a grand scale, to quote a few, Wang Labs, Digital Equipment, Borders and Blockbusters and many more; of which many either fell after achieving industry leadership position or shrunk in size. The reason is not that they failed to act or didn’t know what was happening but the fact that they had all the data but didn’t analyse it. The patterns were there, had they analysed the data they already possessed they would have seen it. They believed that experience can upstage data but they failed to comprehend that with today’s rapidly changing global economy, it’s impossible for the human mind to absorb all factors that go into making sound decisions. Statistical analysis often uncovers correlations that no one could have predicted on the basis of their past experiences. We won’t be wrong in accepting the fact that data and statistical analysis isn’t perfect but who hasn’t made poor decisions on pure gut instinct!! It is said that sustainability is based on transforming data into analyzable information for insights and decision-making. This is where data driven decision making comes in and plays its part. (Cokins) Take for example the case of Wal-Mart as reported in New-York Times. This occurred when Hurricane Frances was moving across the Caribbean, threatening to directly hit on Florida’s Atlantic coast. Residents were making a rush for the higher ground, but at the same time, far away, in Bentonville, Ark., executives presiding over the Wal-Mart Stores decided that the situation opened a great window of opportunity for their newest data-driven weapons, Predictive technology. A week ahead of storms predicted landfall date, Linda M. Dillman Wal-Mart’s CIO at that point of time asked her staff to come up with forecasts based on what happened when Hurricane Charley struck several weeks earlier. Their experts mined for data and found that the stores would need certain products more than the usual batteries, flashlights, and bottles of water. All this brought out some very interesting facts about the pre-storm behaviour of consumers. Strawberry pop tarts and beer were the top-selling items. By predicting what was going to happen rather than waiting for it to happen, Wal-mart was able to deal with this unexpected situation in a holistic manner. It is said that if we can improve our ability to estimate for a given customer, we stand to gain by applying the same logic to millions of customers. This applies to many other areas where intense application of data science and data mining is seen like direct marketing, credit scoring, financial trading, help-desk management, fraud detection, search ranking, product recommendation and many more. An example for this would be the instant recommendations of Amazon.com and Netflix which are a result of split-second advertising decisions based on the items a user has previously seen or is viewing right now, which has resulted in increased revenues for both of them. The increasing amount of data generated by humans while doing their daily chores has lead us into a world where the purchases and habits of a consumer give us an insight into the behaviour of the consumer, how he reacts to various offers , what are his preferences, Is the customer a sort of person who will pay back loans. The algorithms have been designed and implemented which predict accurately how likely a person is to get diabetes. All this has a potential to give rise to platform of customization for every consumer i.e. mass customization. A recent study by MIT professor Erik Brynjolfsson has brought out the fact that most revolutions in science begin with better methods of measurement. When we can see new things, we are driven to seek answers and thus build new ways of thinking and operating. The main underlying part of his findings was the fact that organisations that relied on data driven decision making, enhanced their performance by 4 – 6 % viz–a-viz their peers in the same market. This figure has remained robust despite taking into account the contributions for labour, capital, purchased services and traditional IT investment. (Lohr) Another research conducted by Mr. Erik along with Mr. Lynn Wu, an assistant professor from Wharton Business School used publicly available web search data to predict housing-price-changes in metropolitan areas across the United States. They didn’t possess any special knowledge of the housing market when they began their study, but they reasoned that virtually real time search data would enable good near term forecasts about the housing market- and they were right. In fact their predictions proved to be more accurate than the official ones generated by the National Association of Realtors which had far more complex model but relied on slow changing historical data. (Brynjolfsson) Now if we analyze the business that exist today and have been running on intuition, tradition and convenience, we observe that they have scattered staff development programs, the budgetary decisions are based on prior practice and programs, Staff assignments are based on interest and availability and goal setting is based on votes , favourite initiatives or fads. In contrast, the companies that have adopted data driven decision making for the staff development programs are more focussed as an improvement strategy to address the problems identified by the analysis of data. Staff assignments are based on skills required for future as well as the present requirement. Goal settings are done on the basis of problems identified by data analysis and their possible explanations. One factor that we must consider is that with the ever increasing rapidly changing pace of technology, companies today have multiple points of contact with the customer i.e. blogs, call centres , customer reviews or simple comments on social media platforms which are all a valuable source about client segments , insights and behaviour. Today it can be observed that increasing competition, decreasing margins and availability of information has left many companies struggling for survival. The only way out seems to stem from the fact that it is very important today to analyse the vast amount of data being generated daily and convert it into actionable knowledge so that client needs are addressed adequately. (Mike Lynch) An example worth mentioning here is that of researchers at John Hopkins School of Medicine, who provide a classic example of how simple models and big data win over more elaborate analytic approaches. They used the data from Google Flu Trends, which is publicly available, to forecast surges in flu related emergency visits a week before similar warning were received from the Centres of Disease Control. Similarly, twitter updates provided accurate records similar to the official reports that were tracking the spread of cholera in Haiti after the 2010 earthquake. (Brynjolfsson) From the numerous examples quoted above, it can be substantiated that data analytics unlock huge amounts of useful information, which can be made more transparent in nature by use of Big Data. It is often seen that we search for data in forms other than electronic and then transfer it to electronic form. This effort represents a huge inefficiency; if we could the information directly from other forms to electronic form without human intervention it could save us a lot of resources and time. Our online financial transactions or any transaction for that matter, if and when collected over a period of time can bring out interesting facts about our choices and behaviour. Now if we apply the same to a huge organization, what we have is copious amount of data that can provide us with very accurate and detailed information about various aspects of the organization. This further helps the middle level and upper level management make meaningful and informed decisions regarding day-today decisions to designing long term plans for the organizations along with requisite data to support it. Data collected from consumer transactions can help us predict the behaviour of the customers and help the organisations in maintaining requisite inventory levels. They can also tailor and customize the products and services according to the needs of an individual customer without the customer making an additional effect in telling the provider about it. It also leads to narrower segmentation of customers. Data obtained when combined with power analytics techniques can be used to find hidden patterns which otherwise would remain hidden and help in predicting future needs , improvise after-sale services and meet the expectations of the consumers in a holistic manner. In short the transfer of information between consumer and manufacturer can be defined as the art of communicating; without actually communicating; as no formal/informal communication takes place between the parties’ involved; just observation, which leads to predicting the needs and aspirations of consumers. We need to understand that the data is not the only tool for the decision making. If applied in isolation without experience, the end result is a Frankenstein’s monster of business process and best practices woven together. As value increases its dependency on unique knowledge and human experience, objective data sources must be supplemented with perspectives from organizational cultures, communities of interest and other relationships. Only then can we take holistic and sound decisions. Bibliography (Debates, 2011) Bonabeau, E. (n.d.). Harvard Business Review . Retrieved 11 21, 2013, from hbr.org : http://hbr.org/2003/05/dont-trust-your-gut/ar/5 Bono, E. D. (n.d.). Search Quotes. Retrieved 11 21, 2013, from searchquotes.com: http://www.searchquotes.com/quotes/author/Edward_De_Bono/3/ Brynjolfsson, A. M. (n.d.). Harvard Business School . Retrieved 11 21, 2013, from Harvard Business School Website : http://hbr.org/2012/10/big-data-the-management-revolution Christensen, C. (n.d.). Design Intelligence. Retrieved from di.net: http://www.di.net/articles/the-innovators-dilemma-when-new-technologies-cause-great-firms-to-fail/ Cokins, G. (n.d.). analytics-magazine. Retrieved 11 21, 2013, from analytics-magazine.org : http://www.analytics-magazine.org/may-june-2012/577-corporate-decision-making-why-do-large-once-successful-companies-fail Debates, D. (2011). When it comes to important business decisions , should you trust your gut or follow the numbers . Deloitte Development LLC. Lohr, S. (n.d.). New York Times . Retrieved 11 21, 2013, from New York Times Website : http://www.nytimes.com/2011/04/24/business/24unboxed.html?_r=0 Mike Lynch, c. e. (n.d.). Financial Times . Retrieved 11 21, 2013, from Financial Times Website : http://www.ft.com/cms/s/0/62f37a4a-931c-11de-b146-00144feabdc0.html#axzz2lITs0aA5 Plisch, B. G. (2004, 02 04). WTN News . Retrieved 11 21, 2013, from WTN News Website : http://wtnnews.com/articles/557/ Tim McGuire, J. M. (n.d.). Ivey Business Journal . Retrieved 11 21, 2013, from iveybusinessjournal.com: http://iveybusinessjournal.com/topics/strategy/why-big-data-is-the-new-competitive-advantage#.Uo47PsXlbrN Wladawsky-Berger, I. (n.d.). Irving Wladawsky-Berger. Retrieved 11 21, 2013, from Irving Wladawsky-Berger blog: http://blog.irvingwb.com/blog/2013/09/data-driven-decision-making-promises-and-limitations.html Zwilling, M. (n.d.). Forbes . Retrieved 11 21, 2013, from Forbes.com: http://www.forbes.com/sites/martinzwilling/2012/03/25/too-many-leaders-still-rely-on-their-golden-gut/ Note - Visitors shall not be able to comment on this article until they are logged in.5 points5 pointsOnce when asked what he does, if the data does not support his decision, John Maynard Keynes replied – “I change my opinion. What do you do?†In a haystack of information today, that one thing which helps organizations take sound decisions is the ‘analysis of data’. Often, companies find themselves in situations where from a variety of choices, they need to pick one. In such cases, data-driven decision making enables following a systematic procedure. A successful completion of any process begins from a decision well made. It forms the first step of any execution process, and is thereafter followed by modification, as and when changes in information arise. The question that one would ask then is – ‘If it is data that is needed, then exactly how much of it?’. Authors like James Taylor and Stephen Covey, in their writings explain keeping ‘the end in mind' before undertaking a course of action. They say that the goal is never to build on the data; rather it is to use the facts to make work easier. Thus, the perfect quantity would be one which helps an organization make ‘timely’ as well as ‘correct’ choices. But even a manager’s power to predict can do this job, isn’t it? On digging deeper we realize that the ‘intuition' we are referring to is nothing but the gut feeling that arises based on a manager’s experiences of the past, and thus its own roots lie in data as well. What people actually follow is ‘informed intuition' – that uses previous occurrences as its basis. This is justified, since not only is complete information necessary, but also alongside is corporate alignment and clarity. These days, a term that managers often hear is ‘big data’ – which refers not only to the volume of data available, but also to the variety of it and the rapid pace at which it alters. Big data brings with itself the complexities of processing and interpretation, causing confusion and delays. It is here that just-the-right-kind of filtration is needed, to separate what is relevant and what is not.Infact sometimes, even lesser amounts of data can lead to better decisions being taken. As they say, the ‘first impression’ can indeed be beneficial if taken as the ‘last impression’. This is exactly where the use of instinct comes into picture. Whether it be studying a consumer insight or predicting the future, it is a blend of analysis and a manager’s intuition that leads to the apt solution. In a post in Forbes, Robert Carraway, a professor at the Darden School of Business said that big data and the increasing use of frameworks require not less, but a higher amount of managerial insight to accompany them. There have been faults based on judgment (remember Google claiming to overtake Firefox when launching Chrome?) ; and so exist popular crisis due to over-reliance on data. The idea hence is to strike a balance between these two seemingly different ways that managers use to reach a conclusion. The more an association can accommodate diversity in terms of style, emotions and experiences, the higher is the probability of improved performance. In a nutshell, if a corporation can make sure that it has as members both left-brain and right-brain thinkers – it can strike the nail on its head! (*source for the cartoon : Google images) Note - Visitors shall not be able to comment on this article until they are logged in.5 pointsIn 2022, Klarna launched a full-speed AI deployment automating most of its processes using AI solution and realized cost savings equivalent to 700 FTE. One of the processes they automated was their Customer Service Support. After a while, customer complaints and dissatisfaction ballooned. Customers claimed that AI responses were too generic and unhelpful when dealing with real-life problems. While AI solution like chatbots can handle simple and repetitive queries, emotions or complex issues were not addressed. Klarna realized that while AI solutions promise speed and cost savings, it can compromise service quality and customer satisfaction. Klarna decided to rehire employees to address poor service quality and customer complaints. This is a testament that AI solution isn’t about replacing humans, but rather, enhancing the human workforce with smarter tools and better support system. As an MBB, following were my recommendation: 1. Use VOC to identify critical customer requirements (CCR) where complex issues and customers needing to talk to human to solve their concerns will surface. 2. AI solution aims to enhance customer experience leveraging on personalized interaction for higher engagement. This was not apparent in case of Klarna. It is recommended to take advantage on Deep Learning capabilities of AI solution. Such model can identify complex patterns, making it suitable in image recognition, voice recognition, and natural language processing. 3. Lastly, while drawing the to-be process map, HILT (human-in-the loop) principle is recommended. In cases of complex customer concern, AI can escalate the concern to its human counterpart to further assess the given concern and provide necessary resolution.4 pointsAccording to what VK noted under his forum questions, “Some people seem to be using AI platforms to find forum answers. This is a risky approach as AI responses are error-prone..” AI is created by humans who are prone to error. We must always remember this and be diligent to make sure AI will make the best decisions. “Making sure” will ALWAYS to be and, I believe, will forever be, a human responsibility. I can’t ever imagine anyone shirking their responsibility and pointing at the AI solution and saying “It’s the AI’s fault that we lost revenue”. Yes. It might have been that we trusted the AI agent to make the decision but ONLY after we allowed it to make that decision. So, the real accountability still falls back to a human. Knowing that AI is prone to make errors, just as humans have done to mitigate making our own errors, we created guardrails to increase proper decision making and better outcomes – ergo, Business Excellence. Think of AI as another person. But now you are responsible for the decisions and actions of that person. It will need oversight, accountability, and transparency to make sure AI is making the right decisions on our behalf. Here are some of the elements that I think could be included in a governance framework to ensure responsible, high-impact use of AI in a process-driven organization. Creating a governance team or committee to oversee all AI solutions. This team would comprise people from IT, the business, legal, risk management and defining each role and responsibility throughout the AI development, deployment and maintenance. For transparency and accountability, conducting regular impact assessments to identify potential risks, biases and consequences of AI-driven decision. Also, implementing techniques that can provide insights into the how AI is making its decisions, such as feature attribution or model interpretability methods. Lastly, performing audit trails that let us see the data inputs, processing and outputs the AI used to make its decision. For agility and control, using agile development methodologies to allow for rapid iterations and deployment. Using change management to capture the all the changes made throughout the development which can easily be reviewed, tested, and validated. Lastly, establish access controls to prevent unauthorized changes to the AI system or data.4 pointsProposed Business Excellence Metrics for the AI Era - The use of AI in the core business processes is reshaping how value is created and delivered by organizations. Subsequently, the traditional KPI metrics we have used to measure performance in areas like quality, cost, and efficiency are becoming insufficient and redundant. Using these old metrics in an AI-driven environment can be misleading, causing organizations to optimize for the wrong behaviors and not reap ROI on their technology investments. Let us begin by assessing the Traditional metrics and their shortcomings in an AI driven environment. 1. Assessment of Traditional Metrics Metric 1: First Call Resolution (FCR) It has long been a primary KPI to monitor contact center efficiency and customer satisfaction, indicating a low effort experience for the customer and low cost for the business. In an AI-Driven Environment: Using AI-powered chatbots, IVRs, and self-service portals to manage simple, high-volume, transactional queries is an attempt to give the “Easy” Calls today to machines instead of humans. These were precisely the calls that used to be FCR wins for human agents. By filtering simple issues, AI is ensuring that the only calls reaching human agents are the complex, emotionally charged, or multi-faceted problems that the AI could not solve. And it turns out that these problems are more difficult to solve in one phone conversation. Following these developments, a high FCR rate might actually be a concern! It could potentially indicate that the AI is not being effectively used to screen issues, or human agents bring complex problems to a premature close just to attain an outdated target. While a lower FCR could signify that agents are appropriately handling the highly complex issues that require follow-up, research, and collaboration. Metric 2: Average Handle Time (AHT) AHT measures the average duration of customer interaction. It has been a pivotal metric in gauging operational efficiency, used for staffing models and cost control. The goal has always been to reduce AHT. In an AI-Driven Environment: Since the calls that are able to reach human agents as mentioned above are likely to be important ones. We shouldn't be obsessed with how soon the agent can get the customer of the phone but rather with what quality and value is one giving. A complex issue, high-value customer retention or an upsell opportunity might require a longer AHT. Stressing agents to cut AHT on complex calls can have detrimental effect not only with regards to poor outcomes, customer churn, and repeat calls (which negatively impact other metrics). The AHT metric also disregards entirely the time customers may have already spent interacting with an AI chatbot, rendering the “AHT” only a partial — and potentially misleading — view of the overall customer journey effort. 2. Proposed New Metrics In order to track performance in an AI-driven setting, we need new metrics capturing proactive problem-solving, and the utility of human-AI interaction. Proposed New Metric 1: Proactive Resolution Rate (PRR) PRR is the ratio of potential customer issues that are identified and resolved proactively by the AI system before the customer initiates contact. PRR Logic o The AI tracks customer journey data, usage patterns, and system logs for anomalies that indicate there is a problem in the process (e.g., missed payment, delayed delivery, odd user behavior in a software application). o The AI then initiates an automated resolution using the SOP’s, FAQ’s and KB updates to assist the customer (e.g., retries the missed payment, informs the logistics partner, proactively sends a "how-to" guide, or sends a system alert to the user). o PRR Calculation: (AI-initiated Proactive Resolutions / Total potential issues detected) x 100 · This metric, most importantly, switches the mindset away from reactive service and illustrates the value of preventative excellence. It captures a measure of the organization's ability to avoid problems, which is a far stronger indicator of operational excellence and customer-centricity than how effectively it cleans up messes. Proposed New Metric 2: Human-Assisted Value-Add (HAVA) · HAVA Score is a metric for evaluating the efficacy and efficiency of human agents involved in complex situations escalated by AI. The HAVA Score replaces the use of simplified metrics like AHT and FCR for these high-value encounters. · HAVA Logic: The HAVA Score is calculated after the interaction and based on a weighted calculation of the following: Problem Resolution Success (40%): Was the customer's issue ultimately resolved? (Binary: Yes/No, or a scaled rating). Customer Sentiment Analysis (30%): AI parses the text or audio of the communication to measure customer sentiment levels (i.e., measuring if the customer's levels of frustration decreased, positive language increased, etc.) Customer Lifetime Value (CLV) Impact (20%): Did the interaction led to customer retention, a new purchase, or an upgrade, this can be done by mapping the service interaction to CRM data. Knowledge Base Contribution (10%): Did the agent record the solution for this unique problem, so it could be used for training the AI in the future? (thus helping avoid similar escalations). · HAVA provides a path away from basic efficiency and instead reflects the true value of the human agent in the world of AI. HAVA rewards agents to be thorough and empathetic problem-solvers. HAVA also promotes a learning cycle in which the agent is incentivized to make the AI smarter through KB updates, contributing to the improvement of the system over time. 3. Linkage to Business Excellence These proposed metrics are directly aligned with the core principles of Business Excellence. Business Excellence Principle How Proposed Metrics Align Customer Centricity PRR is a measure of an organization’s ability to solve problems before the customer even knows about them, it is the most efficient form of customer-centricity and true commitment to an effortless experience. The HAVA Score ensures that when customers do need to talk to a human, the focus is all about solving their complex needs and maintaining the relationship that impacts their perception of value and care. Operational Excellence & Quality Improvement PRR actively measures the quality of operational processes. A high PRR means that the underlying systems and processes that are driving the standard approach we work towards, are efficient, intelligent and self-healing, which is an essential component of modern operational excellence. The HAVA Score assists and develops an environment for continuous improvement. Agents are rewarded for contributing to a knowledge base, ensuring human knowledge is captured, and then used to build up the overall human-ai capability to get smarter and smarter, and to be able to do more at scale over time. Employee Engagement & Empowerment HAVA, also enhances the human agent's role from "call handling" to "resolution expert or relationship builder." It enables and rewards them for spending time in solving complex issues whilst creating value - leading to higher job satisfaction and lower turnover. It recognizes and rewards the value of empathy, creativity and complex problem solving that are inherent to being human. Value-Driven Leadership With these metrics available to leaders, they can get a clearer and more informative view of their business performance. Instead of managing counterproductive metrics, they can focus on the real priorities: stopping customer issues before they occur, getting the most value for each human engagement, and designing a learning system that continuously improves with every transaction.4 pointsReminds me of an old saying - "Nakal ke liye, Akal ki bhi zarurat hot hai"4 points4 pointsGrubbs test is a statistical method used to find the outlier in the data range. Also, this test is used to find a single outlier in a normally distributed data set. This test is used to find if the maximum or the minimum value is an outlier in the given data range. Definition - Hypothesis of Grubbs test: Ho - There are no outliers in the given data set Ha - There is only one outlier in the given data set Test Statistic for the Grubbs' test - Y¯ represents sample mean and s represents standard deviation, the Grubbs test statistic is the largest absolute deviation from the sample mean in units of the given sample’s standard deviation. This is a 2-sided version of the test, the Grubbs test can also be defined as one of the following one-sided tests, 1. Test whether the minimum value is an outlier, 2. Test whether the maximum value is an outlier, Grubbs Test Example: Range given - 199.31, 199.53, 200.19, 200.82, 201.92, 201.95, 202.18, 245.57 Firstly a normal probability plot was generated, This plot indicates that the normality assumption is reasonable except for the maximum value. We, therefore, compute the Grubbs test for the given case to find whether the maximum value of 245.57, is an outlier or not. Test Results, H0: there are no outliers in the data Ha: the maximum value is an outlier Test statistic: G = 2.4687 Significance level: α = 0.05 Critical value for an upper one-tailed test: 2.032 Critical region: Reject H0 if G > 2.032 Hence we conclude that the maximum value is in fact an outlier at 0.05 significance level. Boxplots are used to graphically display different parameters briefly. Among other things, the median, the interquartile range, and the outliers can be read in a boxplot. The data used must have a metric scale level. Such as a person's age, electricity consumption, or temperature. How to interpret the boxplot? The box indicates the range in which the middle 50% of all values lie. Therefore, the lower end of the box is the 1st quartile, and the upper end is considered the 3rd quartile. Below q1 lies 25% of the data, and above q3 lie 25% of the data. In the boxplot, the solid line represents the median whereas the dashed line represents the mean. The T-shaped whiskers in the boxplot are the last part, which is within 1.5 times the interquartile range. This means, that the T-shaped whisker is the maximum value of your data but at most 1.5 times the interquartile range. Therefore, if there is an outlier, then the whisker goes up to 1.5 times the interquartile range. If there is no outlier present in the data, then the whisker is the maximum value. Hence, the upper whisker is either the maximum value or 1.5 times the interquartile range. Depending on which value is smaller. The same applies to the lower whisker as well, which is either the minimum or 1.5 times the interquartile range. Points that are further away are considered outliers. If no point is further away than 1.5 times the interquartile range, the T-shaped whisker thus gives the maximum or minimum value. Box Plot Example: Range - 199.31, 199.53, 200.19, 200.82, 201.92, 201.95, 202.18, 245.57 From the above example it’s graphically visible that the data value of 245.57 is not falling within 1.5 times the interquartile, hence it’s an outlier. Conclusion – I would prefer a box plot to find the outliers in normally distributed data range, since its less complex and easy to easy to understand because of its graphical representation. Thanks.
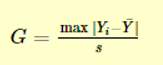

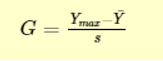


 4 pointsWho does not like a pat on the back!! We also like it and hence we would like to hear from you. Your positive feedback helps us stay motivated and continue to deliver excellent workshops. Please click on 'Reply to this Topic' and share the comment that you want to be displayed on this forum as your positive feedback? We value your opinion!!!4 points4 pointsThe following Japanese words related to “handling of manpower” in production process according to the organizational requirements; Shojinka: This is the Japanese word that originated from the lean manufacturing principles of Toyota. When we translate from Japanese to English, it gives direct meaning of “Various people”, shortly it can be “Vary people". i,e Flexible manpower lines maintain productivity with fluctuating demand. Shoninka: It means “Manpower saving”, by providing machines / equipment in order to free one or two operators: Shoryokuka: It means “ labour savings” partial removal or combining two operations by automation to support the process Productivity = outputs/ inputs i.e it is a measure of efficiency of production line. More often the Shojinka is defined as having to main categories; first, the workers are multi skilled and they can perform in multiple workstations at a time in a production line. The second is, the line should be designed in a way to accommodate or vary people based on the fluctuating customer demand. In simple words; Shojinka can be defined as “ability of a production line can be balanced when the production volume goes up or down" Demand Vs Supply: Shojinka techniques developed based on the Demand Vs Supply and no excess production as they considered as an inventory by deploying flexible machines and man powers. Capacity planning is the process of determining the production capacity needed by an organization to meet changing demands for its products. The capacity is normally developed based on takt time: Takt time: Available production hours per day / customer demand per day (Generally it is calculated on annual basis with full speed of line capacity). When the demand fluctuates, the organizations have some broad questions; · How to absorb the fluctuations in demand that will occur over next 12 months? · To what extent should inventory be used for this purpose · Can demand fluctuations be met by varying size of workforce (Shojinka?) · Why not absorb the fluctuations by changing activity rates and varying work hours( overtime) · Why not outsource to maintain a stable work force and let suppliers change activity rates to absorb demand fluctuations? · Will the organization lose orders if doesn’t meet all demands? Should the organization adopt this policy? Each of these choices determine the moves of the organizations. The organizations will adopt basically three strategies of planning to managing supply · Chase strategy: - when demand fluctuates, the organizations should adjust the capacity to match the demand as close as possible. E.g seasonal business demand like sale of apparels during festivals · Level strategy: - a firm maintain constant capacity over a period of time, irrespective of fluctuations in demand; e.g When more investment or skilled labour required, this strategy will apply · Mixed Strategy: Individual firms devise infinite combinations of the above strategies based on the situation. Shojinka is suitable to apply when organization adopts chase strategy. Flexible manpower line: The production line is designed in such way to meet the changing production requirements: Before designing of any production capacity, the following parameters to be considered; Takt time : Net production time / Customer demand Cycle time : Net production time / No.of Units produced No. of stations / Operators: Cycle time ( Work content) /Takt time In the competitive market, the organization has to prepare some strategy to prevent the business loss and shojinka is a solution for the flexible manufacturing; Calculating Manpower / machines: The following formula will help us to determine the manpower / machine requirements to meet the demand; Overall cycletime / Takt time = Manpower / machines Cycle time is the sum of the processing time to complete one unit of assembly Examples: Case: 1 Overall cycle time: 240 secs Takt time: 80 secs No of manpower = 3 So, we can use the manpower formula and assign no. of operators based on the demand Case: 2 When demand goes down, we can remove the manpower and he can be used in other machines/ assembly lines; Overall cycle time : 240 secs Takt time : 120 secs No of manpower : 2 When the demand low, we reduce 30% manpower and two manpower will produce the output to meet the low demand. Shojinka demands employee training, multiskilling to manage / operate different machines / practical standard operating procedure in place for flexible manpower line. Advantages of Flexible manpower line: · Avoid overproduction · Better usage of capacity · Smooth material movement · Kaizen culture Disadvantages of Flexible manpower line: · Design of production process is complicated as the forecast are not realistic · Require high skilled operator · Not suitable for small, medium size industries Conclusion in my purview: At the present time, most of the industries look for outsourcing when the demand peaked up. The peak demand may not be long-lasting, as the demand lows they withdrawn the order from the supplier. This will affect the supplier relationship in long term. However, organization should design flexible manpower line to the peak volume and if the demand is lower, the assigned manpower can be used in another production area, provided if they are competent. But practically it is complex in real time production situation. Industries, normally extend their work hours to meet the peak demand and cut off the extra hours if the demand goes down. If the forecast is realistic, the cell design is flexible to manpower, Shojinka is a best tool to apply.4 points4 pointsKaizen : It is a combination of two Japanese words , kai and zen . Kai means “Change” and Zen means “for the better” resulting in the meaning as “Change for the better”. It refers to any continuous improvement done in workplace, using small incremental changes Kaikaku: It is the Japanese term for ‘ radical change’ . It talks about the fundamental cum radical changes that we make to the system, in which we are working Kakushin: In Japanese it means ‘Innovation’ . It talks about the fact that changes done in the system (that we work upon) can sometimes lead to a paradigm shift in the working of the system such that that we need to realign our thinking to be more innovative S.No Kaizen Kaikaku Kakushin 1 Focuses on elimination of waste (Muda), Productivity improvement and Over hard working of employees (Muri ) with small continuous improvements Focuses on radical or revolutionary changes with big improvements Focuses on Breakthrough ideas /products /services 2 Cultural change is slowly imbibed into the working DNA of the employees . Cultural change happens explicitly and drastically changes Cultural change happens consciously due to focused thinking 3 Participation(involving in the activity) of all workers normally happens as kaizen activities deals with process kaizen (Individual workstands)and flow kaizen(material and information) Not necessarily all workers need to be involved Not necessarily all workers need to be involved How do they complement each other ? Kaizen is the base . Its the building block on top of which Kaikaku and Kakushin can be done. Objective is to remove any non-value adding work by doing a kaizen and then see what needs to be done. When too many Kaizen activities are not yielding any results , then we go got Kaikaku. This is akin to DMAIC and DMADV. If we think that DMAIC is not going to work, then no point in trying to improve the existing process. So we opt for DMADV as we think old process cannot be improved. Same way, we move to Kaikaku and hence that becomes a radical shift in our approach (again think of DMADV for analogy). Now this is done . What next ? What if we find a better way to optimise our benefits . Our system then should be in a transformed state with our thought process realigned with innovative approach. So Kakushin comes into picture . This is akin to DMAODV in Six Sigma parlour. Conclusion:All the three are a must so that an organisation can stay competitive in the market. What would a company lose if one of these as a concept was not utilised? Case 1: If Kaizen not utilised: If thats the case, it would be like building a house without a strong base. Kaizen helps in setting up individual standards and also helps in eliminating waste/non-value added activities. Also it helps in controlling the over work of employees. By not having Kaizen, the disadvantages would be a). Impact of other two type of improvements may not be effective as still the processes would be weak because non-value added activities would be present because those 2 improvement types may not have addressed this aspect b). Kaikaku and Kakushin focus on system improvements primarily and will not focus on individual standards unlike Kaizen . As a result, employee focus would be missing c). Employee morale may go down as cultural challenge is thrusted upon and as there is no Kaizen which speaks about Muri . Employee might spend long hours to adapt to the cultural changes brought by other 2 types of improvement Case 2: If Kaikaku not utilised: 1. 1. Potentially it could happen that small changes might keep on happening eternally for ages with not much impact 2. Management/Key stakeholders may not be able to take decisions on issues/problems Case 3: If Kakushin not utilised: 1. 1. The Organisation will not be competitive in its business 2. 2. Difficult to grow in niche market 3. Business growth and hence revenue will be stagnated 4. Morale of top management will go down Example for Kaizen, Kaikaku, Kakushin: Assuming we are in a primitive age of IT , explaining the concepts of Kaizen, Kaikaku and Kakushin Problem Statement Before Kaizen Kaizen Results Often multiple developers working on same code/functionality creates instability and also delays deployment of files Code written by one developer is inadvertently overwritten by another. This happens at times on the delivery date creating customer escalation Have a Version Control System which will alleviate the problems Version control eliminates overwriting. Latest code is always used for delivery and right file is deployed eliminating customer escalation Now Version control available . Next issue. Problem Statement Before Kaikaku Kaikaku Results As more than one developer working on same file and multiple files, changes need to be frequently deployed in the code repository which is not happening Due to time pressure , code deployed in the code repository throws error while testing the application . Tester would not be able to test in such a case Do a Continuous Integration (CI). Have an Integration Server which can seamlessly integrate all codes and provide a build (compilation of the code –ready for consumption by the users) and also intimate whether build is failed or passed Tester and Developer can get notification about the success or failure state. It makes easy for testers to test In today’s environment , Time to Market is the key. So the sooner we make the changes , the faster we should deploy it in the production environment . Else business would be lost. Now as we frequently make changes and deploy it in our local environment and test the application, do we have the capacity to deploy those changes in real time(production environment?) Problem Statement Before Kakushin Kakushin Results As frequent changes are done to the code and tested in local environment , it becomes difficult to deploy the changes everytime in production as the environments are different and we need to make changes in various places including code so that northing gets broken in production Takes 2 days of effort to do the manual changes . Also the stress in doing these changes (staying at office for long hrs) takes its toll on the health of the individual . More SMEs required to do this job since its for more than 1 day Automate the deployment part Avoids manual effort for deploying the changes 1 SME who knows automation is alone required If automation sequence is done properly, no mental stress or boredom will happen4 pointsHi All Please find below comparison on the topic. Hope I can connect to the lot here. Business Excellence Process Excellence Operational Excellence Personal Excellence INQUIRY What am I supposed to do How am I supposed to do When am I supposed to do Who am I CRITERIA Vision Outcome Output Realization FOCUS AREA Market Competitiveness Continuous Improvement Quality Service Learning RELATIONSHIP Transforming Reframing Refining Acting ORDER You start with You design it into You execute it as You reinvent each time ABSENCE CAUSES Annihilation Variation Waste Insatiety APPROACH Balance Score Card Etc Value Stream Mapping Etc 7 QC, 7 MT, 7 Waste Selflessness and learning Regards Igniting Minds 95 ( Nagraj Bhat - On behalf of )4 pointsBusiness Excellence 4 Sept 2017.docx Define, Compare and contrast Personal Excellence, Process Excellence, Operational Excellence & Business Excellence. Personal Excellence: - Is a state of an individual or any person in which the individual or a person inherits an excellent or highest level of ability to be fully aware and to be fully able to rightly work upon one’s own strengths and weaknesses. This is a state that a person or an individual has reached upon experiencing the higher degree of self-evaluation & at which the person or an individual can guide other person or persons to make them be able to reach the state of excellence. Process Excellence:- Is a control of any process in order to be able to course with higher degree of efficiency & effectiveness. This is a state at which the process could deliver exactly the right required output. Operational Excellence:- Is a state of operations in which the operations are running exactly as per the expectations of the Business by having the excellent processes in place with excellent team working on Operations Business Excellence:- Is a state in which the Business has reached to a level where it becomes remarkably successful in achieving the set vision and by fulfilling all the expectations from the trail of the business in parallel. This is the state in which a business itself becomes the way of life. Business Excellence is more of a macro level where it is very important that it surpasses the states of Personal Excellence, Process Excellence & Operational Excellence. It is not so easy to achieve the Business Excellence unless an individual, process & operations are contributing towards the whole of the agenda. Personal Excellence is more of a micro level & is very important as without this it is very hard to achieve any further steps/state of excellence either in Process, Operations or in Business. Process excellence is directly contributing to Operations & further to Business to achieve higher degree of excellence. Operation Excellence follows Personal & Process excellence. It is highly impossible to achieve Business excellence state without being excellent as a person or an individual contributing to the Business, without having an excellent process & operations. Business excellence is the final result of Personal, Process & Operational excellence. An Organization must make sure that it empowers every individual to be able to involve to the fullest extent possible. It is an individual who can actual make a big difference in the whole of the Business. According to me it is finally the individual who can design & lead the right process, who can identify the right tools and techniques in order to perform to a level of excellence. Finally it is an individual who can bring the business as the way of life as the life in the business is finally the individual itself, despite the business is fully correlated to customer or market in its business sense. Group 14: Srinivasa Vampathi & Abhijeet4 pointsMy simple take in this is that the relationship described in this is reversely related i.e. Business Excellence cannot happen without Operational Excellence which cannot be achieved with no Process Excellence which in turn cannot be conceived without Personal Excellence. In other words, excellence of a business is directly interlinked to the personal excellence quotient of its founders, core members and its employees. A sense of desire to achieve self excellence in individuals leads to defining excellent process in an organization which leads to operational excellence within business units which ultimately leads to the company or the business a whole to excel.4 points4 points
 The story revolves around the growing of square watermelons in Japan. Japanese grocery stores had a problem. They are much smaller than their US counterparts and therefore don’t have room to waste. Watermelons, big and round, wasted a lot of space. Most people would simply tell the grocery stores that watermelons grow round and there is nothing that can be done about it. But some Japanese farmers took a different approach. ”If the supermarkets want a space efficient watermelon,” they asked themselves, “How can we provide one?” It wasn’t long before they invented the square watermelon. The solution to the problem of round watermelons wasn’t nearly as difficult to solve for those who didn’t assume the problem was impossible to begin with and simply asked how it could be done. It turns out that all you need to do is place them into a square box when they are growing and the watermelon will take on the shape of the box. This made the grocery stores happy and had the added benefit that it was much easier and cost effective to ship the watermelons. Consumers also loved them because they took less space in their refrigerators which are much smaller than those in the US - which resulted in the growers being able to charge a premium price for them. What does this have do with anything besides square watermelons? There are a five lessons that you can take away from this story which will help you in all parts of your life. Here are a few of them: 1.) Don’t Assume: The major problem was that most people had always seen round watermelons so they automatically assumed that square watermelons were impossible before even thinking about the question. Things that you have been doing a certain way your entire life have taken on the aura of the round watermelon and you likely don’t even take the time to consider if there is another way to do it. Breaking yourself from assuming this way can greatly improve your overall life as you are constantly looking for new and better ways to do things. 2.) Question Habits: The best way to tackle these assumptions is to question your habits. If you can make an effort to question the way you do things on a consistent basis, you will find that you can continually improve the way that you live your life. Forming habits when they have been well thought out is usually a positive thing, but most of us have adopted our habits from various people and places without even thinking about them. 3.) Be Creative: When faced with a problem, be creative in looking for a solution. This often requires thinking outside the box. Most people who viewed this question likely thought they were being asked how they could genetically alter water melons to grow square which would be a much more difficult process to accomplish. By looking at the question from an alternative perspective, however, the solution was quite simple. Being creative and looking at things in different ways in all portions of your live will help you find solutions to many problems where others can’t see them. 4.) Look for a Better Way: The square watermelon question was simply seeking a better and more convenient way to do something. The stores had flagged a problem they were having and asked if a solution was possible. It’s impossible to find a better way if you are never asking the question in the first place . Always ask if there is a better way of doing the things that you do and constantly write down the things you wish you could do (but currently can’t) since these are usually hints about steps you need to change. Get into the habit of asking yourself, “Is there a better way I could be doing this?” and you will find there often is. 5.) Impossibilities Often Aren’t: If you begin with the notion that something is impossible, then it obviously will be for you. If, on the other hand, you decide to see if something is possible or not, you will find out through trial and error.4 pointsWhen we first started using AI to track production downtime patterns, I built a simple flow that pulled operator inputs and generated quick insights for the shift leads. At one point, I decided to tweak the prompt that asked operators to describe the issue, just to make issues clearer and easy to understand by the technical team. I thought it was an improvement. A week later, my phone was buzzing during a site visit because the reports coming out of the system suddenly had big gaps. Turns out my “clarity” change made operators give shorter answers that didn’t have enough detail for the analysis to work. Since then, I’ve treated AI flows exactly the way I treat any process change in manufacturing: I save every version before I touch it. Not just the file but a quick note on what I changed and why. I run the new version in a controlled test with a small team, not the whole plant. If it performs better on the KPIs we care about like accuracy, speed, usability, then it graduates to live. If it doesn’t, I roll it back in minutes because the last good version is sitting in my folder. I also keep two environments: the stable one for what’s proven, and a “playground” for experiments. That way, I can test bold ideas without worrying about disrupting a live process. It’s the same mindset I use in CI projects: measure first, change deliberately, and always keep the option to go back. With AI flows, that discipline makes the difference between steady improvement and a messy guessing game.3 points3 pointsWhy do those wins sometimes slip away in the Control phase? There are various reasons why solution to improved process slip away in the Control Phase. Here are some: 1. Thinking that identifying a solution is enough. Oftentimes, organization and project team missed to establish controls to sustain and ensure consistency of the injected solution. Testing of impact and feasibility of the solution is missed, only to find out that local staff implementing the solution on their day-to-day task find it difficult to sustain. 2. Poor communication of intended changes. Formal handover of improved process to its process owner/local management is essential, more importantly to its local staffs who will deal with day-to-day work where improvement took place. A better understanding of what was the problem and why improvement was made must be clear and aligned with the local team. Buy-in and ownership of local team is vital to sustain the solution. This means making them involve from the start and all throughout the project’s phase. 3. Inadequate training in new condition. Lack of enablement of local management and staff who’ll be implementing the solution and who’ll be using it daily will surely make successful implementation fail. Conducting training and enabling local staff before full implementation of solution will provide knowledge, familiarity, build confidence, and likely ensure success of implementation. Adequate training puts the local staff in a controlled environment where learning curve is monitored and supervised. Under scrutiny, old behaviors will be guided and replaced with new intended behavior tied up with the change throughout the training process. Local management’s involvement in training brings alignment, trust, and confidence with local staffs. 4. New process not captured in written procedure. Procedure provides guide and clarity to the doers. It should contain the process details, working sequence broken down into elements, with hints and tips how to perform an activity or task. Updated written procedure of the improved process is an essential supplement to the enablement of local staff and management alike. Procedure should be crafted in such a way not bounded to misinterpretation in order to avoid human error. 5. No monitoring to check that solution is working as intended. Local management’s involvement in the handover of the improved process is essential. Management oversight alongside with tools and best practices such as Control Plan, Process Control Chart, Gemba Kaizen, and process audit should be understood and taught to them by the project team. Having a KPI metric that shows process performance where improvement was made is of equal importance for sustainable management oversight. What tools or techniques do you rely on to keep things on track and make sure the improvement sticks for good? Handover process management is crucial to sustain the successful process improvement in long term. Process documentation such as to-be process flow chart, training & enablement plan, process aids/visual references, control plan, process control chart, updated procedure, FMEA (whenever applicable), and implementation plan should form part of the handover process to local management. This is a structured way to provide clarity on how the improved process works and how it should be monitored to sustain the gain of its financial and non-financial benefits. Lastly, involvement of process improvement team or at least its leader in KPI monitoring and random process audit for the next three to six months upon handover is another key on sustainability of the improvement made.3 pointsSince each one of us works with data and metrics, plus given that AI is increasingly getting integrated in our processes and work, it will be a worth while investment to go through all the answers. You will get ideas on what you need to focus on and what you can let go. Best answer has been provided by Sargun Diwan. Well Done!!3 pointsBelow listed are the traits of a good AI Governance Model – 1.) Clear and Fair – Identify and reduce any biases in the model, provisioning options for human interventions for big decisions and ensuring POCs are defined and known to all stakeholders in case something goes wrong. 2.) Strategic Fit – Ensure every AI deployment directly supports the organization's strategic goals and delivers clear value 3.) Managed Lifecycles: AI systems should have a defined route from initial conception to continuing upkeep. This calls for extensive testing prior to deployment, ongoing performance monitoring, and a defined procedure for modifications or even retirement. We require accurate documentation of everything. 4.) Training – Ensuring that relevant teams are well trained to work effectively with the AI. Also, teams need to be aware of what the AI can and cannot do. Stakeholders of an ideal AI Governance Model – 1.) Leadership 2.) AI oversight group 3.) Ethics and compliance team 4.) Internal Auditors Mechanism to ensure both agility and control 1.) Smart Risk Assessment – Design and approval framework aligned with the risk quotient of the deployment. 2.) Use of standardized tools and reusable modules – Provision pre-approved tools and use of reusable building blocks to cut down redundant work. 3.) Build in governance from day 1. 4.) Centralized guidance from the AI oversight team. 5.) Clear and defined RACI. 6.) Provision Human-AI collaboration for high risk decisions.3 pointsTraditional KPI metrics such as productivity, quality, cost, delivery, efficiency, and many more should not leave management lenses, rather, targets associated with them should be adjusted accordingly. Customer and employee satisfaction surveys however can be done through AI, leveraging on its capability to detect emotion, interpret facial expression, body language, and many more which is difficult for human eye to decipher and prone to certain biases. To track AI’s real performance and value, I recommend Input Data Integrity, and Bias Detection as two additional KPI metrics that management should add under their lenses. These are crucial for AI’s model creation, accurate training and analysis, impacting AI’s recommendation for business decision-making process.3 points3 pointsThe Cobra Effect is a classic example of unintended consequences, where an attempted solution to a problem leads to adverse outcomes. Here are some real-life examples across different businesses and industries: Some major real-life examples of the Cobra Effect are - The Cobra Bounty in India: Cobra Effect originally came from a government initiative in undertaken in the colonial India. The initiative's aim was to reduce the cobra population in India by offering a bounty for each dead cobra. To get larger bounty, people started to breed cobras, kill them and get the bounty. When the government got to know about the misuse of their initiative, they stopped it. This caused all the alive cobras to be released by their breeders which in turn led to an increase in the population of cobras. China’s 4 Pest Campaign: The "Four Pests" campaign in China was aimed to reduce the spread of disease by killing rats, flies, mosquitoes, and sparrows. The campaign was successful in achieving its goal of reducing the spread of diseases, however the killing of sparrows had a negative impact on the ecological balance in the farm areas. Sparrows, by eating locusts, traditionally kept their populations in check. The killing of sparrows led to a high increase in locust population which in turn led to them eating large portions of grains and plants that were being cultivated. This resulted in the Great Famine in China which lasted from 1958 to 1962 and caused the death of 20 to 30 million people. Odd-Even Car Schemes: Many cities across the globe have applied the odd-even vehicle strategy to reduce pollution. In this strategy, odd car plate numbers can be taken out on one day and even car plate numbers on other days. However, families which needed to use both cars the same day could not do so. This led to people purchasing more cars which led to an increase in pollution. Opium Destruction in Afghanistan In 2002, British officials tasked with suppressing opium production in Afghanistan offered poppy farmers $700 an acre in return for destroying their crop. This ignited a poppy-growing frenzy among Afghan farmers, who sought to plant as many poppies as they could in order to collect payouts from the cash-for-poppies program. Some farmers harvested the sap before destroying the plants, getting paid twice for the same crop. To avoid the Cobra Effect during the Improve phase of a project, consider the following strategies: We should identify the possible consequences by conducting in-depth and thorough assessments of potential solutions, which should also include stakeholder analysis and scenario planning. Before rolling out the changes fully, small scale pilot programs should be implemented which will allow us to observe outcomes and make relevant changes and adjustments through the feedback we receive. To help us in identifying issues early and formulating our solutions accordingly, we should aim at establishing robust feedback channels and loops. This helps us in gathering data from stakeholders and the team continuously. We should intend to have more cross-functional collaboration since the involvement of diverse teams can help us gain invaluable insights and open our eyes to different perspectives for a proposed solution. The focus should be on long term goals and an alignment with the company’s objectives. Focusing solely on short-term fixes may tempt the team to get quick wins that might lead to larger problems down the road instead of working on a thorough process improvement plan which will give long term benefits. The teams should focus more on critical thinking and data driven decision making instead of just gut feelings and certain feedback points. This kind of bias in decision making may lead to disastrous consequences in the end. With a more adaptive management style and data driven approach, businesses can mitigate the risk of the Cobra Effect and promote more effective and sustainable solutions.3 pointsI have been compiling a comprehensive list of contemporary methodologies for Business Transformation. I started this in the year 2005. Over time, I have made several modifications to ensure the list covers all established and emerging approaches. To ensure the list was inclusive, I deliberately avoided methodologies limited to a specific industry, such as enterprise architecture, or those useful only for a particular function, such as Customer Relationship Management. I also tried to avoid subsets, for example, by recognizing that BI is already part of Business Performance Management. Currently, the list includes ten methodologies that have proven to be effective across different industries and functions. These are - Lean Management Lean Six Sigma DMAIC or Six Sigma DMAIC Six Sigma DMADV Agile Leadership Digital Transformation (includes Business Analytics and Big Data) Business Performance Management (includes BI) Design Thinking Theory of Constraints Creativity and Innovation (includes product innovation, process innovation, business model innovation, and marketing innovation) Business Process Reengineering (BPR) I propose that we collaborate on developing this list by discussing it together. We can explore whether there are any reasons to modify, enhance, or change it based on our collective insights and expertise.3 points3 pointsLean Six Sigma is a powerful methodology that can be used to improve business processes. It is a structured approach to problem-solving that can be applied to any process - manufacturing, sales, marketing, IT, BPO, accounting, purchasing, you name it. All processes have variation. Variation is the cause of all evil - it leads to defects and customer dissatisfaction. Lean Six Sigma methodology can be used to reduce variation from any source and thus improve costs, quality, and hence customer satisfaction. The standard methodology that is used to improve existing processes is called DMAIC. The acronym DMAIC stands for Define - Measure - Analyze - Improve - Control. If you think about it - this methodology is common sense. Before we start working on a problem, we need to have a good definition of what is the problem, why we are working on it, where is the pain area, what is in the scope of the project etc. All of these are accomplished in the Define phase. Secondly, in the Measure phase, we are interested in ensuring that the data used for further analysis is free of measurement errors. Lean Six Sigma is about making decisions based on facts & data. If the data is inaccurate, we would end up making the wrong decisions. Hence, the measured phase ensures good data. Before making any improvements, it is also important to establish a baseline so that we can clearly communicate the benefits obtained from our project to other key stakeholders. The next phase, Analyze, is all about making the hypothesis and using data to either prove or disprove our hypothesis. We make the hypothesis about what is causing the problem and then establish the real root causes. The fourth phase, Improve, focus on getting the best possible solution to solve the root cause of the problem. The solution is optimized and any potential failure modes are resolved before the solution is deployed in the real world. The last phase, Control, is all about ensuring that the solution is sustainable in the long run. Any financial benefits obtained from the project are also quantified. Finally, the improved process is transitioned over to the process owner. As we can see from this paragraph, any problem can be addressed using this structured approach. Here are some things that should come to your mind when people talk about Lean Six Sigma: Business Process Improvement Methodology 3.4 defects per million opportunities Customer focused Uses facts & data Quantify financial benefits Structured improvement approach3 points3 pointsAnalytic Hierarchy Process (AHP) is an organized decision-making method that enables analysis around a problem, needed for making a choice between available alternatives by determining the criteria basis which selection or prioritization will be done. It is a process of quantifying criteria and alternatives and relating each element to the desired outcome. Pugh Matrix is most popular decision making six sigma tool that uses scores awarded to criteria and scoring them for each alternative. It is a qualitative technique which allows stakeholders to make a choice between alternatives basis scores. While both are used for the same purpose but preference and usage are largely driven by the stakeholder approach, problem in hand and proof of concept needed. Let’s look at some of the differences. AHP PUGH Matrix 1. Pair wised Matching – compare two criteria at a time and amongst alternatives 1. Each alternative is independently awarded a score and compared with DATUM and against the weightage decided for each criteria 2. Quantitative method used for evaluation 2. Qualitative method by awarding scores 3. Complex Statistical Method 3. Simple Method based of Ranking 4. Enables a direct comparison between alternatives and via defined criteria 4. Each Alternative is not compared with each other 5. Consistency Index (<10%) aids validation of the comparison outcome. Improving a decision is possible 5. No such validation and standard are possible 6. Based on Continuous Data – Ratio 6. Based on Discrete Data – Ordinal Data Type 7. Is not LEAN SIX SIGMA QUALITY Tool 7. Is integral part of the LEAN SIX SIGMA QUALITY Playbook 8. Very difficult and time-consuming process especially with more criteria 8. Preferred tool to handle several criteria’s 9. Based on stimulus – response, a mathematical numeric relationship is established 9. Based on Logical thinking, experience and willingness of stakeholders. 10. Individual and Group decisions can be combined. Everyone has a strong reason to believe in the outcome 10. Stays Subjective to a great extent, enables understanding of each alternative compared to existing one The complexity involved and the ability to run AHP, differentiates the choice to be made in comparison with Pugh. AHP is more time consuming and requires complex calculations to reach towards conclusion, ability to handle data and using the method is the key. Hence, AHP is less preferred compared to Pugh and mostly due to simplicity factor. Example scoring movies to judge the most preferred for annual reward compared to a preference of IT Software involving investments. In first case Experience and Knowledge of stakeholders in reference to the problem in hand, governs the success and accuracy of Pugh Matrix outcome. Hence Pugh Matrix can handle sensitive analysis better and where quantitative data is available in abundant. Where as the client would want to have more statistical proof concept for deciding which Software to install and WHY, AHP will be the preference.3 points3 pointsQ 482. Explain the KT Analysis method of problem solving using an example. Does it provide any advantage over other problem solving approaches? Note for website visitors - Two questions are asked every week on this platform. One on Tuesday and the other on Friday. All questions so far can be seen here - https://www.benchmarksixsigma.com/forum/lean-six-sigma-business-excellence-questions/ Please visit the forum home page at https://www.benchmarksixsigma.com/forum/ to respond to the latest question open till the next Tuesday/ Friday evening 5 PM as per Indian Standard Time. Questions launched on Tuesdays are open till Friday and questions launched on Friday are open till Tuesday. When you respond to this question, your answer will not be visible till it is reviewed. Only non-plagiarised (plagiarism below 5-10%) responses will be approved. If you have doubts about plagiarism, please check your answer with a plagiarism checker tool like https://smallseotools.com/plagiarism-checker/ before submitting. The best answer is always shown at the top among responses and the author finds honorable mention in our Business Excellence dictionary at https://www.benchmarksixsigma.com/forum/business-excellence-dictionary-glossary/ along with the related term3 points3 pointsMost companies fail in implementing a solution or a project not because solution was bad, but they did not engage stakeholders in the change. Hence for a change to be effective, change management becomes critical for successful adoption of the solution. One of the tools used by GE widely to successfully implement project was CAP-Change Acceleration Program Change Acceleration Program talks about the equation which is important to understand how change will be effective. Q x A = E Q = Qualitative/Technical Solution A = Acceptance/Engagement E = Effectiveness For any solution to be successful and adopted, acceptance from stakeholders is important. Engaging them in the project journey is important will make better adoption of the project/solution. Few key reasons for failures of major change efforts: - Decision-driven and behavior-dependent change. Failure to mobilize and engage pivotal groups. Over reliance on structure and systems to change behavior. Inability and unwillingness of Leaders to change. Criteria for performance not clear. Lack of a winning strategy. Failure to make a compelling and urgent case for change. Not willing to confront how they and their roles must change. Having the right strategy is only one of these factors; others relate to poor implementation and execution. Change Acceleration Process Model Leading Change: Having a champion who sponsors the change. Creating A Shared Need: The reason to change, reason to drive project or solution should be communicated well within the organization and should be pursued through data, assessment, demand from business and not anecdotal. The need for change should be acknowledged so that resistance is reduced. Shaping A Vision: The desired outcome of change should be clear to everyone and adopted widely. Mobilizing Commitment: There is a strong commitment from key stakeholders, understanding their role and ensuring they are invested in the change, make it work. Forums in the organization to ensure management are updated periodically to get their support on time. Making Change Last: Change is not about implementing a project/solution or a change but ensuring enough controls and owners who will own it and enable adoption of change. Monitoring Progress: Tracking the progress to ensure the changes and expected benefits are getting delivered. Setting KPIs/KRAs and other indicators to ensure accountability Changing Systems and Structures: With change getting implemented and to ensure they are long lasting and permanent, existing practices, system and structures should change. Modifying and updating the management practices which complement and reinforce change to executed. Commonly used CAP tools to help create a shared need and drive change are: Stakeholder Analysis ARMI Model Stakeholder Analysis Stakeholder Analysis is an important change management tool. It helps analyze various stakeholders getting impacted with the change and their role. It helps in planning to onboard stakeholders who may not be pro change. Below are the steps that done to map the stakeholders and plan actions to ensure they are onboarded · Plot where you think individuals currently are with regard to desired change (ü = current). · Plot where you think individuals need to be (X = desired) in order to successfully accomplish desired change – identify gaps between current and desired. · Plan action steps for closing gaps to move from current to desired. ARMI (Approver, Resource, Member, Interested Party) Model ARMI model is another CAP tool used to assess each person’s role in the project during different phases of the project. ARMI is an acronym which stands for: A - Approval of team decisions R - Resource in the team whose expertise will be required M - Member of team, with the authorities to execute steps as per charter I - Interested Party, someone in business who needs to be informed on direction and findings ARMI helps in defining the role of everyone in the project team. It helps in clearly defining the roles and responsibilities of each individual to avoid any ambiguity. Below is an example of ARMI:
 3 points3 pointsAs Uday and I were in the final year of our graduation, everyone around us was sure of Uday's future. They said Uday could sell anything. Others spoke highly of his emotional intelligence. Sounds like an instant marketing hit, doesn’t he? Well, so he was! Filled with the indomitable energy of a sales newbie and exuding charm he sped his way to step into the shoes of a Area Sales Manager after 5 years of introductory sales engineer experience. Although he surmounted every problem that came his way, human errors made by subordinates served as regular bottle-necks. He’d ensure the avoidance of billing errors on his own but communication gaps would result in one. He would often suffer the embarrassment of differential pricing quotes for the same offering. And his team's efficiency was blotched with documentation errors, material dispatch errors, poor after-sales service etcetera all along the way. These debacles soon earned him the ire of his clients and he began to invest substantial time in resolving issues with them. What came to his rescue during such delicate times were his soft-skills. His juniors hero-worshiped him. They all said that Uday had his way with the clients and had to be seen tackling them to be believed. His success prevailed. The changing times soon saw him as GM Sales and in his stewardship saw the automation of many processes. Just when he was expecting technology to result in perfection, errors persisted due to a high rate of attrition amongst sales professionals. Uday sought help in sales counselling sessions but the organization was still infested by errors, reactive measures and rework. One hadn’t an option but to become complacent in the current situation of mediocrity. Majority of Uday’s energy was directed towards client conflicts and retaining business. Still exuded charm, our man, but perfection still eluded him. 15 years into the job and following a linear trend, Uday was now the Vice President of the sales department. Towering now over a fleet of GMs and reporting only to the CEO, he collaborated with the New Product Development Team and the Hiring/Training Team. Banking still on his insight into the customer psyche and high emotional intelligence and his reputation as the best Sales Workshop Facilitator, Uday now became the direct contact for strategic high value clients. But what sounds like a success story had a bitter glitch. With all he had accomplished in his 18 years long stint, Uday still couldn’t bask in the glory of his success without disturbance. He convinced himself that he had stuck to the same organization too long. It was now time for him to shift his allegiance. He flowed with the trend of his time and joined a multinational organization. This is where Uday had the greatest revelation of his life! The skill set he had acquired over the past prolific 18 years of his life seemed redundant now. The processes here were highly streamlined; devoid of quotation disputes, erroneous and delayed invoices, shipment delays and other organizational inefficiencies. It was there and then that the great truth had dawned on him; his coveted moment of corporate enlightenment; the great organizational consciousness that he had come in terms with: his new organization swore by and soared with Six Sigma- the ultimate organizational truth and saviour. Six Sigma had his creative juices flowing. He no longer felt contained or restricted. His approach was futuristic; prevention was the thumb-rule not mitigation. He soon collaborated with the Leadership Team and formulated a new sales model which heralded in astronomical revenues. Uday realized that he could never enjoy such potency of thought in his previous organization where he wasted much of his energy tackling trivialities. Much like Buddha, he attained the great consciousness the hard way. But it needn’t be so tough, does it? One can only imagine the greatness he and his organization could’ve scaled had he stumbled upon Six Sigma earlier.3 points3 pointsQuestion - A forensic expert walks into a room with a bunch of dead Six Sigma Black Belts who show no visible signs of injury. What's the first thing he should check for? Answer: Poisson distribution.3 points3 pointsGemba Study Gemba is a Process Walk, as an informational tour of the area where the work is taking place. Gemba Walk is a series of structured, on-site interviews with representative process participants and SPOCs’ with the goal of gaining a comprehensive understanding of the process. In a service based industry, interviews focus on detail such as process time, wait time, defect rates, root causes and other information that can lead to targeted improvements. It also helps in knowing the process environment and the work culture of the process. Gemba walks should not be confused with (MBWA), a different approach in which leaders simply wander about and get involved in what employees are doing. A Gemba walk should have a defined purpose, often associated with a specific concern related to a KPI or in other words, GEMBA walks are more of process driven. During a Gemba Walk, the concerned person asks very depth about the process being observed. Who is involved? What materials are used? What do you do? How do you know what to do? When does the task take place? What depends on the outcome? MBWA does not involve that degree of depth, nor does it usually have the same focus on asking open ended questions. Considering Service Industries as an example: The various steps involved in a basic Gemba Walk can be: 1) Prepare the Team It is important that the team members get prepared beforehand. Talking about the walk before the walk happens will help everyone feel more comfortable and open to interactions. 2) Have a plan or a strategy It is important that the supervisor has planned his questions before he approaches the people in the team. 3) Trying to follow the Value Stream Flow It is a good idea to ask employees about shift timings, work nature, hand offs between processes, targets, SLA, client meetings and calls. By having a fresh perspective on the old processes, it gives a perspective that it is helpful for them and not to criticize them negatively. 4) Don’t suggest much changes during the Walk or in any meeting It is not much a good idea to suggest changes and advice during the walk is happening. It is always better to go for suggestions later in terms of documented work or visualization tools (photos and video) 5) Document the observations It is always a good idea to jot down the observations about the process, current interventions and then proposed solutions with the study. It will keep everyone on the same page before and after the study has been made. 6) Follow Ups with the Employees It is important that once the proposed solutions are suggested, managers and senior management should involve in the changes and should be supportive to the employees as well. This helps in establishing the workplace connectivity and knowledge enhancement to themselves. Potential Areas of improvement that can be identified as: Work Force Management & Staff Utilization · Resource Utilization – Improving the Efficiency of the process overall · Login Leakage – Not an issue –if there is gap then agent to recover within the same month · Cross-Training – To mitigate the staff short fall and also in case of BCP situation Resourcing (Support & Management Staff) · Cross skill of Resources · Strengthen the QA calibration process · Quality tools and analysis/documentation exposures · Improvement exposures in terms of technology /Human improvements Floor Management · Daily updates and dialogue with the agents · Visual management on floor · Floor support by Team Lead · Noise on the floor needs to be in controlled. Quality · Improvement is main focus area – Not meeting consistently the target (monthly , quarterly) · Attrition rate in the process · Customer satisfaction scores and TAT3 points3 pointsKaizen(change + better) Kaikaku (change + revolution) Kakushin (new or innovation + revolution) Definition Kaizen => Kai (change) + Zen (better) => Change for better. It is Small incremental changes for continuous improvement / evolutionary improvement. Kaikaku => Kai (change) + kaku (revolution) => Change for revolution. More radical, step changes needed to improve the process/business on existing system Kakushin => Kaku (revolution) + Shin (new or innovation) When we need about innovation, reform, transformation and renewal from present situation. Some change will form a complete departure from the current situation. Description Those activities which helps organisation to improve a process or business constantly. Improvement / continuous improvement Implement 5S and removes 7+1 types of Muda/waste In a process or business where transformations needs a big/global redefinition of the system. Transformation / reform / big improvement Allows organisation to reform and transform their culture and work habit Those discoveries that allow changing the status quo of a business. innovation / reform / renewal Allows organization to adapt with new changes/ new things Process to Follow/ Steps 1. Identify an opportunity. 2. Analyze the process. 3. Develop an optimal solution. 4. Implement the solution. 5. Study the results. 6. Standardize the solution. 7. Plan for the future. 1. Set based 2. 3P Kaizen 3. Plan Execution 4. Lean Transformation Support DMAIC Example Update in current software Change both the technical basis and functionality in current software Create new software on the basis of new technology and new business process Comparison 1. Took less time 2. Less costly 3. Continuous process 1. Takes more time than Kaizen 2. More costly than Kaizen 3. Non-Continuous 1. Takes more time than Kaikaku 2. More costly than Kaikaku 3. Non-Continuous How do they complement each other? In any organization Kaizen is the integral part by which we keep the continuous improvement. When we need any big changes to adapt say like in car industry we are moving from LIQUID fuel to GAS/CNG to ELECTRIC car, then we are choosing Kaikaku. But when a car company going to open a new segment say SUV or more luxurious car segment they will choose Kakushin. So if a company want to survive and want compete in each section these three are clearly complement to each other. What would a company lose if one of these as a concept was not utilised? Well change is the only constant in life, if we believe it then we have improve ourselves to everyday, everywhere to survive or to stay up to date. If a company don’t change themselves with Kaizen they will become static/monotonous and loose its charm will lead to death eventually. If we don’t adopt with new things/changes, i.e Kaikaku then we will become like Kodak a certain death. If we don’t adopt with new innovative changes i.e Kakushin, like ”man power to computer/automation” will not be able to survive eventually, until a better competitor comes to market, like JIO comes with “internet data” with 4g technology in India.
 3 points3 pointsBy not being Mutual Exclusive By not being Collectively Exhaustive By not implementing the findings3 points3 pointsThe difference lies in the definition iteself. DPMO (Defects per Million Opportunities) talk about the defects while DPPM (Defectives parts per Million) talks about the defectives. Take an example: A car manufacturer produces 1000 cars with each car having 50 checkpoints. Hence Units - 1000 Opportunities - 1000*50 = 50000 Assume, 10 cars are defective while the total number of defects are 250 (i.e. these 10 cars cumulatively failed on 250 checkppoints). Hence Defectives - 10 Defects - 250 DPMO = 250/50000*1000000 = 5000 DPPM = 10/1000*1000000 = 10000 Typically in a service industry, Customer is more concerned with DPPM. For a service provider it makes more sense to look at DPMO. Even if they start working with DPPM, they will eventually have to drill down to the defects that are rendering the service as defective. Not sure if the same logic applies to manufacturing, but even though DPPM is an excellent metric to track the performance of the manufacturing unit, for any improvements you still need to look at DPMO.3 pointsThis leaderboard is set to Kolkata/GMT+05:30


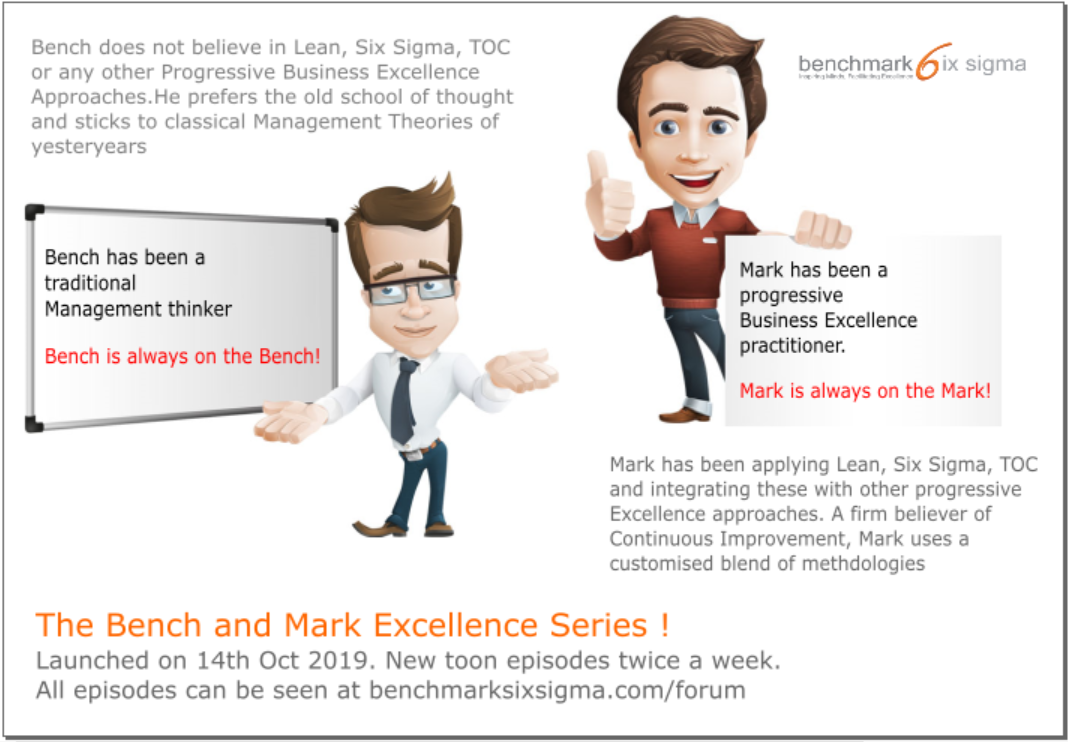


.thumb.png.3dc86d42a4fc134fca3d71d67dbbcae0.png)


