

Venugopal R
Members
-
Joined
-
Last visited
-
Benchmark Six Sigma Expert View by Venugopal R As mentioned as per the scope of ISO 31000, it is a generic standard on risk guidelines meant to be applied to cater a wide range of activities including strategies and decisions, operations, processes, product, processes, services and assets. The standard is not prescribing any specific risk management methodology. However, it refers to 'risk' as 'an effect on uncertainty of objectives'. It also indicates that risk is a 'combination of the consequences of an event and associated with a 'likelihood'. FMEA is a more of a specific tool or methodology whose origins can be traced to the US Aerospace industry. This method focuses on harnessing the tacit knowledge of team members within an organization in a structured manner. There are different types of FMEA, though the most popular ones are the 'Design FMEA and 'Process FMEA'. Anticipating and preventing the potential failures associated with Design and Process activities pertaining to a Product design and Process of producing and delivering were the key purpose for which this tool got evolved. However, it has become a versatile tool to address the potential failure modes for any process, be it manufacturing, transactional, services etc. While ISO 31000 does not prescribe any specific tool or method for Risk Management, many of the generic guidelines provided by the standard could be fulfilled by FMEA method for selected activities. Below are few examples, though not exhaustive. 1. In clause 2.13, it mentions the stakeholder as one who may be impacted by a decison or activity. This will relate to the "Effect" as in FMEA. 2. It mentions 'Risk identification involves Risk Sources, Events, their caues and potential consequences. In process FMEA, we move from the Potential failure mode, Effects and Causes, for each and every process step. 3. Event with / without consequences are considered as 'near miss'. It relates to FMEA, where we are considering 'Potential failure modes'. Sometimes adverse consequences may be avoided by timely controls, yet they could be 'near miss'. 4. Consequences are expressed quantitatively. This is done in FMEA by using the severity ratings. 5. The 'Level of Risk' as mentioned in the standard relates to the quantification using RPN values. 6. The standard mentions about the combination the risk levels using consequences and likely hood. The RPN in FMEA is a composite risk level that considers the Severity of the Effect, the Probability of occurrence and the likely hood of detection and control 7. Section 2.26 makes a broad mention about 'Control', whereas in FMEA, the expectation for current controls and detection methods are clearly defined and also quantified using the Detection rating. 8. The standard expects 'monitoring'. One of the main outcomes of the FMEA evolves action plans aiming to reduce the RPN numbers. FMEA should be a live document and is continuously worked upon to keep reducing the RPN numbers as well as to address new failure modes that may be identified. It gives adequate scope for monitoring. 9. The standard expects accountability. The same is the expectation in FMEA process where there will be process owner, responsibilities for individual actions identified and targets for improvement. 10. The reference to people skills and training programs connects well with the intent of FMEA, which is always performed as a teamwork. This harnesses the scattered process knowledge and skills and connects them into the various aspects of the risk prioritization. As I mentioned, the above discussion is not exhaustive and has not dwelled into all the clauses of the ISO 31000 standard. However, these examples could be adequate to understand how the risk management tool 'FMEA' can become part of implementing this standard. It may also be noted that FMEA is considered as a 'Process Map' based method and gets generated for each process steps. While implementing ISO 31000, other risk management methods may also be considered as appropriate apart from FMEA.
-
We hear this term "Organizational transformation" being used by may organizations in recent times. In most cases that I have come across, it is heavily focused on 'Digital Transformation'. Companiies are trying to automate their processes by using RPA methods, Machine Learning and other advanced Data Analytical tools. However, recently I happend to attend a session, where I listened to the 'transformation journey' narrated by the chairman of a well known manufacuring company. Their approach to transformation was by winning the 'Deming Prize'. Most of the highlights explained by this industry leader was focussed on 'Cultural transformation'. The cultural transformation had to be brought out at all levels of the organization starting from the Chairman. Does the list of transformational approaches that we have identified so far, address this aspect directly or indirectly? We can discuss.
-
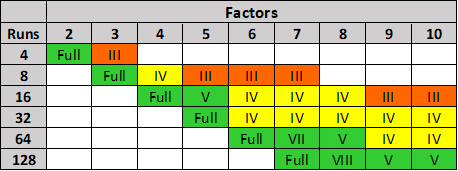
Benchmark Six Sigma Expert View by Venugopal R Fractional factorial designs help to significantly reduce the number of experimental runs without compromising on the decision making outcome. For 5 factors, each at 2 levels, we will have to conduct 32 trials as a Full Factorial design. It is a recommended practice to perform a replication – hence the total number of experiments with replication will become 64. However, if we look the above table, which gives the options for Factorial designs, for 5 factors we have an option of performing a ‘Resolution V’ design. Resolution V designs are considered to be as good as ‘Full factorial’, since we will not be missing out on any main effect or two-factor interactions. The number of experimental runs required for Resolution V is 16. We may also perform replication, and then the number of runs will be 32. Hence, we need to conduct only half the number of runs as compared to Full Factorial. By opting for the Fractional Factorial (Resolution V), we will have the following benefits. Reduced number of runs – Lower effort, cost, time and resources We can afford a replication for the same number of runs equal to a full factorial without replication We will not lose any information on the most important outputs viz. Main Effects or Two Factor Interaction Effects. For Full Factorial with 5 factors & 2 levels each, we will have: 5 main effects 10 two factor interactions 10 three factor interactions 5 four factor interactions 1 five factor interactions Total number of terms will be 31. For Resolution V design, we will have to deal with: 5 main effects 10 two factor interactions The higher order interactions will be aliased with the above terms and we will not be considering them. Hence the total number of terms will be 15 Note: For a Resolution V design, the 2 Factor Interactions will be confounded with 3 Factor Interactions. Main effects will be confounded with 4-factor interactions. However, since interactions involvring 3 or more factors are very rare, we can safely consider these effects as due 2 Factor Interactions / main effects. Thus, with lesser of terms in the ANOVA, the complexity of the analysis will also be less.

-
Benchmark Six Sigma Expert View by Venugopal R ATTRIBUTE AGREEMENT ANALYSIS (AAA) is a method of performing MSA (Measurement Systems Analysis). MSA is done to assess reliability of Measurement Systems. When we have an attribute type of measurement; for example – visual inspection, manual validation of insurance claims, document classification etc., where the decisions are based on human (Appraiser) judgement, and no measuring instrument is involved – the outcome will be categorical (Example – Pass/Fail, Accept/Reject, Good/Bad etc.). For such measurement systems, we can use the Attribute Agreement Analysis to evaluate the acceptability of the system. The AAA helps to evaluate the extent of agreement 'within appraisers', 'between appraisers', 'the accuracy of appraisers' and the 'overall measurement system’s accuracy'. The Attribute Agreement Analysis is capable of giving 4 outputs, viz. 1. Within Appraiser variation (Repeatability) 2. Between Appraiser variation (Reproducibility) 3. Appraiser vs Standard variation (Appraiser Accuracy) 4. Overall accuracy (Team Accuracy) Point nos. 3 and 4 as above will be possible if we use a ‘Master Standard’ for comparing the decisions made by the Appraisers. For example, if Medical Insurance Claims are processed and the acceptability of each claim is judged by few auditors, the AAA would be good method to assess the reliability of the Audit Quality ATTRIBUTE GAGE STUDY is also an MSA methodology, and used to evaluate an attribute measurement system that uses an attribute gauge, which only screens the acceptable and non-acceptable parts, though the parts will have a value for the measured parameter. Attribute Gage Study examines the bias and repeatability of the system. For example, if an air plug gauge is used as a ‘go – no go’ measurement for diameter, the Attribute GageSstudy can be performed to assess the bias and repeatability of the system. For performing the Attribute Gage Study, a few parts are selected such that the range of their dimensions represent the normal operating range. Each part should have a reference value, which is the known and correct value for that part. Each part must be measured repeatedly for multiple times (recommended 20 times) and the number of ‘Accepts’ and ‘Rejects’ need to be recorded. Detailed requirements for the parts are given by AIAG’s MSA reference manual. The Attribute Gage Study report will contain: 1. Fitted line for ‘% acceptance vs Ref value of measured part.’ 2. Bias (acceptability of bias is based on p-value) 3. Repeatability 4. Graph for Probability of acceptance vs Ref value of measured part’.
-
Benchmark Six Sigma Expert View by Venugopal R Readers are expected to have some exposure to 'Design of Experiments' to be able to relate some terminologies in this answer for 'Latin Square Design'. Experiments are designed to study whether a response (output) is dependent on certain factors (inputs) and also to establish the extent of relationship. It is possible that when we design and perform an experiment with planned settings of an input factor, there could be some known 'noise factors' which are likely to influence the behavior of the output. Such 'noise factors are also referred to as nuisance factors'. They are factors that we are not interested to study, but we may be concerned that they might interfere and bias our results. If we suspect the presence of one 'noise factor', it is a common practice to use a 'Randomized Block Design'. The below example will illustrate such a situation. It is believed the concepts of ‘Design of Experiments’ originated from field of agriculture. We will understand the Randomized Block Design, followed by Latin Square Design using an example relating to ‘yield of a crop’. However, the concept can be applied to other situations dealing with ‘nuisance factors’. We are limiting our discussion to the Experimental Design portion and not discussing the Analysis portion here. RANDOMIZED BLOCK DESIGN Imagine that we are interested to study the impact of 'fertilizer dozes' on the yield for a crop. We have divided the land into 24 plots (8 x 3) available as shown below. Eight different dozes of fertilizer (A, B, C, D, E, F, G, H) are to be tried out. However, it so happens that there is a river flowing on the left side of the land. Now we suspect whether the presence of the river will result in higher moisture content for the plots closer to the river. To study any possible impact due to the possible moisture variation we divide the plots into 3 vertical blocks, each block representing the different moisture content (High, Medium and Low). Within each block we perform all the treatments based on the 8 fertilizer dozes, but with random distribution. Such a design is referred to as 'Randomized Block Design (RBD). The RBD will help to address one noise factor. LATIN SQUARE DESIGN Instead of one Noise factor, if we have two Noise Factors; for example, we have river that runs along the West side and a road that runs along the North side. We suspect that the river contributes to varied levels of moisture content as we move from west to east along the land. Whereas, we also suspect that the road is contributing to varied levels of pollution while moving from North to South across the land. We suspect two nuisance factors. viz. Moisture levels and Pollution levels. Will the plots closer to the river be influenced by higher moisture content and the plots closer to the road be influenced by higher pollution content? To consider the possible impacts due to these two suspected noise factors, we use an experimental design as shown below. As seen, the design is in the form of a square, with equal number of rows and columns. The treatment for each plot is represented by an alphabet. In this case we can try out 4 different dozes of fertilizers viz. A, B, C and D. Such a design is known as 'Latin Square Design'. Each cell in the Latin Square design can accommodate only one treatment. It may be noticed that all the treatments (A,B,C and D) are covered in each row, as well as each column. The number of blocks has to be the same, horizontally and vertically, for both the noise factors. The Latin Square design is used when we suspect two noise factors and want to study whether those noise factors cause (an undesired) influence on the response. Another example for Latin Square application is shown below: The output of interest is the rate of sales for 3 variants (A, B, and C) of a product. The noise factors suspected are the type of cities and the type of dealer promotion schemes. We have considered 3 blocking with respect to the city types and 3 blocking with respect to the dealer promotion scheme. The Latin Square design may be applied as below:


-
Benchmark Six Sigma Expert View by Venugopal R 'Customers do not feel averages'.... In the case of B2B, customers would be organizations. Examples of expectations from such customers would be Product availability, Timely delivery, Zero DOA, Low response time, Higher customer preference etc. In the case of B2C, where customers would be and end-consumers, and the expectations could be different. Many end consumers may purchase a product or avail a service only once in a while. For them, a failure of the product or service is perceived as a 100% failure. 'Time to First Repair' denotes the period for which the consumer expects a failure free performance. Other expectations would include Quicker response time, User friendliness, After sales support and so on. If we look at the various customer expectations narrated above, and we convert them as metric, most of them would need a one-sided specification. (For example, Delivery time 2 days Maximum). Averages may not be considered. We may define the 'defect' for each expectation as an instance when the expectation is not met. Thus most expectations can be measured as DPMO (Defects per million opportunities), Defective %. Quite often, the degree of consumer expectations being met is assessed as part of the Pre-delivery audits by organizations. This would address the Product Quality and performance expectations. For example, a consumer durable manufacturer will do a Finished Product Audit on a random sampling basis and report a score based on the findings. The score will be weighted based on the criticality and frequency of findings during the audit. A service organization would measure a CSAT score based on customer feedback. Net Promoter Score (NPS) is one of the popular methods by which we obtain an estimate about the likelihood of customers recommending the company to others based on their experience. If averages are not felt by customers, why do we have averages measured as part of various metrics in an organization? In production processes, where we would like to monitor performance metrics based on samples, tracking sample averages would help to apply SPC tools such as 'control charts'. To express statistically, the principles of Normal distribution work better on sample averages. Averages do not mean much unless we examine the associated variability as well. Variability is derived from sample results and expressed as the 'control limits'. Such tools help us to monitor the stability (consistency of performance) of a process. Assuring stability is a pre-requisite to assess the capability of a process. Averages would not be the final way of expressing performance. Capabilities are expressed as Sigma levels, Capability stats or in terms of Parts Per Million.
-
Hanedashi is a Japanese term referring to automatic ejection of a part from a machine, once the processing is completed. Let me discuss this concept with reference to a compression molding operation. In this example, the processing is done using a molding press and a pre-formed job needs to be loaded into the heated mold in the press. In a traditional set up (without Hanedashi), the following would be the typical set of activities: 1. Carries the preformed job from the previous process 2. Places it near the compression molding press 3. Inserts his hand inside the mold and pulls out the completed job 4. Places it on the table 5. Picks up the preformed job 6. Loads it into the mold 7. Picks the completed job and moves to the next machine If Hanedashi is implemented, then the press will be equipped with an automatic ejection mechanism for the finished job and the machine will also make itself ready to receive the new input. Then, the set of activities with the same scope as we saw earlier would be: 1. Bring the preformed job 2. Place in on the mold 3. Pick the finished job and load it for the next process, as applicable Hanedashi is an important methodology in Lean Management, and the type of wastes that are addressed will be: Motion - Human movement is reduced as seen in the reduction of the manual steps Waiting - The job need not wait inside the machine until an operator attends to it. Similarly, the new job need not wait for the earlier job to be removed. Hence the throughput increases Over processing - Excess time inside the machine may sometimes make the job over processed. Results in wastage of energy as well as prone for defects Defects - Defects can happen as a result of overprocessing as well as due to handling while removing manually Unutilized talent - The operator will be able to handle multiple machines and hence more resources need not be deployed for the same operation, thus resulting in better utilization of talents Apart from the above, Hanedashi also addresses operator safety. For the example discussed, many instances have occurred, where the operator might get injured (some times loss of fingers) if the machine gets activated while moving the job manually. Hot molds could cause burns. It may be interesting to note that if there is a sequence of machines with the application of Hanedashi across, then it is often referred to as a ‘Chaku-Chaku’ (Japanese term) line. (meaning ‘Load-Load’!)
-
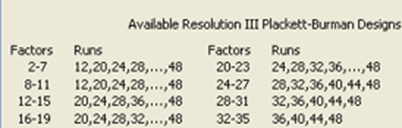
For the answer provided below, it is assumed that the readers have understanding about the basics of DOE viz. Levels, Interactions, Main effects etc. DOE overview: Design of Experiments (DOE) is an advanced application of statistical methods to identify the independent factors that significantly impact a response that we are interested. For instance, if we are concerned about the ‘time to cook’ (Response) for an instant food product, and let us say that we want to study the influence of few factors viz. (1) Quality of ingredients, (2) cooking temperature, (3) moisture content, (4) Quantity of certain ingredients (5) sequence of cooking process and (6) type of preservative. If we want to study the effect of these factors on the response, then we have to vary these factors, try various combinations and observe the results. In this case, we have 6 factors. For varying these factors, the minimum variability that we can subject each factor is ‘2 levels’ and we need to define these ‘levels’ for each factor. If we run a set of experiments to cover all the combinations of variations (2 levels) for each factor, we will have to run 64 experiments (26). Running all combinations of factors and levels is known as ‘Full Factorial Design’. With replication, (running the entire design two times), the number of runs would be 128. Need for screening experimentation: Imagine if we need to conduct a full factorial experiment with 10 factors, each at two levels. The number of experiments will be 1024. And if we need to do a replication, we will have to perform 2048 trials. The experimental efforts, time and expenses could be extremely high and would prove as a deterrent to try such a full factorial experiment. In such situations, we can conduct an initial ‘screening’ to eliminate some factors that may not be significant and perform a full factorial with the remaining few factors. This is how the ‘screening experiments’ will be of help. Fractional Factorial designs: One of the methods used as screening experimentation is ‘Fractional Factorial design’. As per fractional factorial design, we need to run only fewer number of trials. The table below provides that the number of trials for a fractional factorial with 6 factors with “Resolution IV”, is 16. By conducting trials as per Resolution IV design, we can assess the significance of the ‘Main effects’, but not interactions. Thus, out of the six factors, we will be able to screen out the significant factors. Let us imagine that we found 3 factors as significant out of the 6 factors, after performing the screening experiment. Then, we can study these 3 factors by performing a full factorial and analyze all the main effects and interaction effects. Then, we will be performing only 8 experiments. Even if do a replication it would be 16 trials. Hence, the total number of experiments, including the screening experiments will be 32 (i.e., 16+16), as against the 128 experiments for a full factorial, without screening (6 factors with replication). Similarly, we can workout for 10 factors, the total number of experiments (screening + full factorial for reduced number of factors) can be brought down from 2048 to as low as 64, assuming that we find only 5 factors significant during the screening experiment. It is to be noted that during such a reduction, we are not compromising any critical inferences. Plackett Burman designs: Another method used for performing screening experiments is ‘Plackett Burman’ design. These are designs of Resolution III, which means that you will be able to identify only ‘main effects’ and interactions are not considered while the screening experiment is conducted. The table below provides options as per the ‘Plackett Burman’ design for various numbers of factors. As an example, for 6 factors, you can identify a screening experimental design with 12 runs. Conclusion: To sum up, screening designs are methods used during DOE that help to significantly reduce the overall number of experiments to be conducted, when we have a large number of factors. This is achieved by ‘screening out' the most significant factors using the screening experiments. Screening experiments will not help to analyze interaction effects. Once we screen out the most significant factors, a full factorial experiment (or equivalent by choosing resolution V or above) can be conducted with the reduced number of factors and subjected to detailed analysis and conclusions.
-
The dictionary meaning of ‘Reliability’ says ‘The Quality of being Trustworthy or Performing consistently well'. It is also defined as the degree to which the result of a measurement, calculation or specification can be depended on to be accurate. Reliability as ‘Trust’ As a layman, the term ‘Reliability’ is often used with a connotation of ‘Trust’. We may say that this brand is reliable, or this person is reliable, this bank is reliable, this doctor is reliable etc. It means the we can trust and proceed on any association with these entities. Reliability as 'Accuracy' If the term reliability is used with respect to an information, measurement or calculation, it implies accuracy. Reliability as a product performance In case of manufactured products, ‘Reliability’ is the ability of a product to perform a required function under stated conditions for a stated period of time. In simpler terms, the reliability is the probability that a product will be ‘failure-free’ for a stated period of time or beyond. The probability of failure is usually based on the percentage of ‘survivors’ out of a large number of products. Reliability metrices The reliability of an equipment is also expressed in terms of ‘Mean Time Between Failures’ (MTBF) for repairable items. If the item is not repairable, ‘Meant Time To Fail’ (MTTF) is applicable. Mathematically, Reliability is expressed as the Probability of Survival R = P(S) = e -t/µ Where t = specified period of failure free performance; µ = MTBF. Reliability of Service In the context of a service industry, ‘Reliability’ is the probability of the agreed level of service within a specified time (for example, a courier service). However for certain types of services, safety also matters. (for example, a cab service). Reliability as a Commitment The term ‘Reliability is also used to express the level of fulfilment of a commitment. For example, we book a hotel room based on the features and pictures depicted in an online advertisement. After checking in, if we feel that the extent and quality of facilities provided are not up to the projected levels, we may feel deceived and say that this hotel is ‘not reliable’. Though we discussed multiple contexts, one of the common components about reliability is the factor or Trust, (or not being let down against expectations), be it a Product, a Service or a Commitment.
-
A hypothesis test is done to ascertain whether two variables (say Y and X) are related. i.e. whether the Y (also referred as 'output') is impacted by a change in X (also referred as input). We do a trial by taking few varying samples and see if the metric of interest is showing a difference on the Y for different values of X. For example, if we want to study whether the average productivity of a process is same or different for 'Day shift' and 'Night Shift', we would take samples of productivity numbers during Day and Night and compare the average productivities for Day with that of Night. In this example, the Y is the Productivity and X is the Shift (Day or Night). If we observe a difference in the average productivity between the Day and Night shifts based on the sample, the question that arises is "Is this difference due to a sampling (chance cause) variation or really due to the change of shifts"?. The 'p' value which is an output that is obtained after performing the test of hypothesis, gives the probability that the difference could be due to 'chance causes'. Obviously if the p value is very high then, it makes sense to believe that the difference is more likely to be due to chance causes and not due to the change of the shifts. In the language of hypothesis testing, we say that we accept the Null Hypothesis, Ho. On the other hand, if the p value is very low, it indicates that the probability that the difference is due to chance causes is very low and hence it is highly likely that the change of shifts has caused the difference in productivity levels. As per the hypothesis testing language, we say that we reject the Ho (or accept the alternate Hypothesis, Ha) The practice is to fix a threshold for the p value, beyond which we consider that the difference on the Y is not due to X, but only sampling variation. This threshold is known as the 'alpha' value and the default alpha value is 0.05 (equivalent to 5% probability). This also means that the confidence level (1-alpha) is 95%. Now, a p value of 0.049 indicates that there is a 4.9% chance that the difference is due to chance causes and hence 95.1% confidence that the difference is due to the change in the input (X) variable. Similarly, a p value of 0.02 indicates that there is a 2% chance that the difference is due to chance causes and hence 98% confidence that the difference is due to the input variable. By fixing a confidence level of 95%, we are setting our threshold of 5% for the p value for recognizing the difference as significant, if the actual p value falls below this threshold. In both the above cases, the basic inference based on a test of hypothesis would be the same i.e. the p value is lower than the alpha value (5%) and we would infer that the difference due to the X variable is significant and hence there is a relationship between the two variables. If we need to prioritize the strength of significance levels, as is done, when hypothesis tests are used as part of an experimental analysis, the lower p value may be taken as more significant.
-
Benchmark Six Sigma Expert View by Venugopal R John Paul Kotter, thought leader in business leadership and change management is known for his '8 steps of change management', as listed below: 1. Increase urgency 2. Build a guiding team 3. Get the vision right 4. Communicate for buy-in 5. Empower action 6. Create short term wins 7. Don't let up 8. Make change stick Any continuous improvement program in an organization is a 'Change Management Process'. However let's map each one of Kotter's eight steps with the methods and terms popularized by Lean Six Sigma methodologies and terminologies. 1. Increase Urgency One of the key concerns expressed by some Lean Six Sigma practitioners is that although they initiate a project, they fail to obtain sustained support and patronage from their leadership team. The LSS tool that helps to project the urgency is the 'Business Case' is the 'Project Charter'. One of the questions that we need to ask while formulating the business case is "Why is this project required now? What will happen if this project is NOT done NOW?". Defining a good business case and getting the project charter signed off with the sponsor is much emphasized for the very purpose of 'Increasing urgency'. It shouldn't be a ritualistic 'sign-off' but a genuine commitment to reflect the priority, importance and urgency. 2. Building a Guiding Team The spirit of Lean Six Sigma included 'team work'. LSS offers a very structured hierarchy for building a team. Promoting Cross Functional Teams and building 'Process orientation' across the organization are essential expectations of a good LSS movement. The various portfolios defined in the LSS team, viz. Sponsor, Champion, Master Black Belt, Black Belt, Green Belt, SME help to evolve a network of guided teams with multiple levels of authority, knowledge, responsibilities and guidance. 3. Getting the Vision Right The LSS approach for Project identification begins from the Strategic Goals of the organization. A structured policy deployment using proven tools such as 'Balanced Score Card' is done to derive the projects and the CTQs. The projects thus derived will have to be inter connected and ultimately lead towards to the overall strategic goal of the organization. This implies setting the vision right at the strategic level and for each and every project. There are well defined methods for drilling down objectives to specific project goals. Every project is supported by well structured objective, goal and scope statements. All these enable getting the vision right for the organization and for each and every project as well. 4. Communicate for Buy-In Every stage of a LSS project has defined documentation and communication requirements. Though the stakeholder 'buy-in' is an important aspect at each stage of the project, the two key stages during a project execution are the buy-in required while launching a project and while implementing the solution. Methods to perform 'stakeholder analysis', overcoming stakeholder resistances are key considerations during the Pre-Define phase of a project as well as during the solution implementation. There are detailed orientation for leaders using programs such as 'Change Acceleration Process' and 'Champions Programs' that help in preparing mindsets of decision makers to be adaptable and open for considering varied change propositions. The 'Pilot testing' which is an integral part of the 'Improve phase' provides another opportunity for practical communication of the proposed solution (change) and to facilitate 'buy-in'. 5. Empower Action Well defined, structured and objective methodologies for Project selection, Fact based management, Causal analysis, Solution identification, Implementation and Handing Over foster participative leadership. For each portfolio of the LSS team, the responsibilities and authorities are defined and they may be further customized by respective organizations. Empowerments in terms of authority to lead projects, to perform trials and experimentations are built-in features of an LSS program. The various certifications reflect stages of authorities and empowerment to be entrusted with the individuals. A full fledged LSS program will have levels of empowerment viz. Enterprise wide projects, Functional projects and Kaizens at process levels. 6. Create short term wins As part of the Define phase, LSS projects look for 'Quick wins'. Even when alternate solutions are identified in the 'Improve phase' using an "Effort vs Pay-off" matrix. Actions that can be done with low efforts though not resulting in high 'pay off' are classified as "Low Hanging Fruits". We can see the application of 'Short term wins' in yet another approach. It is quite common to have a Black-belt project, that could have sub-objectives deployed as smaller projects, viz. Green Belts and Yellow Belts. The success of such smaller projects are recognized as 'Short term wins' while the overall Blackbelt project may take longer time to be fully executed. 7. Don't let up During the 'Analyze' phase, the set of 'potential causes' are identified and tools like the Fishbone diagrams, Affinity diagrams are used to capture and stratify such causes. Then we narrow down to critical causes by applying appropriate evaluations, which may include statistical tests. However, if we still do not identify the critical or root causes, we are not giving up, but we would move back to the list of potential causes and pick up other causes. If necessary we would add further to the list of potential causes. Another approach would be that if we do not find a strong relationship between a factor (X) and the objective (Y), we would look for a multiple regression type of relationship. The set of tools for identifying and focusing on ultimate root causes provide adequate opportunities to explore in breadth. 8. Make changes stick It is a very conscious decision to include the 'Control Phase' as part of the 'DMAIC' approach in LSS. One of the pre-requisites of implementing an improvement action is to ensure that the necessary control measures are in place to ensure that we sustain the gains. As part of the LSS way of thinking, we often refer to the equation Y = F(X). The entire pursuit of the project is to identify and quantify the Y and the X. While we set an improvement target for the "Y", identifying the appropriate X and establishing the relationship between Y and X is a key part of the project success. In order to make the changes stick or in other words the improvement to sustain, we need to monitor the Y and control the X factors. The concept of Poka-yoke is encouraged to try for mistake proven solutions. However the 'Control Plan' as part of the Control phase is a tool to ensure that the requisite controls are ensured for the objective to retain its improved status. The above narrations are an effort to illustrate how the Lean Six Sigma program has inbuilt features that support all the 'Change Management' steps defined by John Kotter, just as expected for any successful CI program.
-
If you traverse through the different phases of DMAIC, your are likely to find several tools and methods for Define, Measure and Analyze phases. When we reach the improve phase and look for tools for identifying solutions, one method that comes up in most people's mind is "Brainstorming". The "Brainstorming" though a very popular and widely applied method, is also known for certain drawbacks. Several improvements have been considered and evolved as methods for creative identification of solutions. The Nominal Group Technique (NGT) and Delphi technique are amongst such methods. NGT is a method by which we can generate solutions as well as evaluate them, whereas the Delphi technique is mostly considered as a method for evaluating alternate solutions. The NGT requires the participants to provide their ideas on a slip of paper, often referred to as 'Silent idea generation'. The advantage in NGT is that it promotes participation of all members and overcomes the domination and influencing that usually occur in traditional brainstorming. Once the ideas are collected from all the participants, they are discussed for clarifications among the group. All participants are also involved in scoring the ideas for arriving at the prioritized ones. The main focus of Delphi technique is to engage subject matter experts (often referred as "Panel of Experts") for the specific topics under consideration to evaluate multiple ideas and to finally decide upon the best solution to a problem. The relevant multiple experts are identified, maybe at different geographical locations, but each one is provided the inputs anonymously. For this reason, it is sometimes referred to as "Secret Ballot". After the inputs are received from each of the expert, the questions relating to the problem solution may be refined and subjected to subsequent rounds before arriving at a final decision. Delphi technique as compared to NGT: May be used for problems that need specific expert opinions and especially if there is a likely hood for difference of opinions between the experts. The idea of maintaining anonymity between the experts is to avoid possible bias and conflicts. In this way, it differs from NGT, where all the ideas once received are discussed amongst the participants and no anonymity is maintained. May not be friendly for solutions that are required quickly, since it usually takes time to contact experts and obtain their inputs with multiple rounds, in comparison to NGT, where we could reach a decision faster. Helps in evaluation of ideas and is not an ideal tool to generate the ideas, whereas by using NGT, we can generate ideas as well as evaluate them. Does not need face to face meetings and interactions which are important aspects for NGT. Delphi technique encourages diverse thinking and even conflicting opinions. May be used to estimate likely hood and outcome of future events, with high levels of uncertainty
-
Benchmark Six Sigma Expert View by Venugopal R Six Sigma being a very structured methodology to bring improvements in an organization has defined specific roles, which are integral to the 'Six Sigma organization' within a company. The purpose of defining these roles is to ensure a 'successful change management' and we would agree that implementation of effective six sigma projects will involve change management. This is in line with one of the guiding steps explained by John Kotter, who is a renowned thought leader in change management. The step I am referring to is "Building a Guiding Team". Sponsor and Champion are roles that are essential as part of a project life cycle. The sponsor is a relatively senior person who has the vision and authority to select and approve projects. The sponsor validates the Business Case and ensures high level support for an approved projects. In other words, the sponsor is a leadership representative who seeks the business benefits from the project. The sponsor helps in supporting the project with necessary resources, approvals and high level decisions during the course of the project. His / Her approval is required at each of the DMAIC toll gates. The Champion is relatively more 'hands-on' in the business and is responsible for the overall Six Sigma program across the organization. In large organizations, we will have multiple champions, each of whom will be responsible for a specified spread of the business. The champion's role is to promote continuous improvement and change acceleration. The champion will decide on the companywide Six Sigma training requirements and will act as a direct mentor for the Blackbelt project leaders. Champions need to undergo specific training to be fully aware of various Six Sigma tools and methodologies. Sometimes, senior members who are already certified as Blackbelts / Master Blackbelts would play the Champion role after undergoing the requisite training. Champions provide support to Blackbelts in overcoming stakeholder resistance and in obtaining their buy-in during project launch and solution implementations. Coming to the question being discussed "Whether the roles of Sponsor and Champion be performed by the same individual?" It may work in smaller organizations, where the resources may be limited. However, if the Sponsor has plays champion's role as well, he / she must have undergone the requisite training. It could also induce more responsibility on the Blackbelts, since they may not have an 'exclusive' mentor, since the availability of "Sponsor cum champion" would be lesser, compared to a situation where the two roles are performed by different individuals. It should be remembered that the Sponsor's role is more strategic, whereas the Champions role involves substantial tactical dealings as well. In larger organizations, it will be important to have these roles performed by separate individuals, otherwise the Blackbelt will be forced to look up at the Sponsor for various project related assistance and mentorship, for which the Sponsor would be too pre-occupied / may not be practically possible to concentrate on various project specific challenges. Eventually, this would leave the Blackbelts with a wide gap and seriously impact the effectiveness of the projects. To sum up, Sponsor and Champion roles are essential - if they have to be integrated, we need to have good clarity of the roles and will also involve an upgraded responsibility for the Blackbelt.
-
Benchmark Six Sigma Expert View by Venugopal R The Fishbone diagram, which is also known as ‘Cause & Effect Diagram’ or Ishikawa diagram is a very popular tool used for identifying potential root causes. Most Busines Excellence professionals will need no introduction to this tool which is very widely used. The fishbone diagram leaves us with a list of potential root causes (also referred to as X factors) stratified under few headings. Dr. Ryuji Fukuda developed the method known as CEDAC, which is an acronym for ‘Cause and Effect Diagram with the Addition of Cards’. In this method, each participant is asked to identify the causes for a problem independently and write it on a post-it sticker. The recommended approach is to ask as question ‘Why not?’ (i.e. why do we consider as the constraints to achieve our target?) and identify the possible reasons. All the stickers are collected and grouped as done in an Affinity diagram and then transferred to the fishbone diagram in the CEDAC board, under the appropriate category. These stickers are stuck on the left side of the ‘bones’ of the fishbone diagram. It may be observed that the method adopted may be considered as a ‘modified Affinity Diagram’. Once all the stickers with the causes are stuck on the CEDAC board, the each team member is asked to view all the causes and identify solution(s) for each cause. They will write the solutions in another ‘post-it sticker’, of a different colour. This time, these stickers are stuck on the right side of the bones containing the corresponding causes on its left side. The solutions are evaluated by the team and the ones that get shortlisted are shown on the upper right corner of the CEDAC board, as ‘New Standards’. The CEDAC board also houses the Problem statement (Problem Effect) and the Goal Statement (Target Effect). An appropriate chart, such as a trend chart is also included to help monitor the progress based on the implementation of the finalized solutions. Thus, unlike the traditional Fishbone diagram, which is useful for the Causal analysis, he CEDAC becomes a tool for solution implementation as well as tracking the progress of the target effect.

-
Benchmark Six Sigma Expert View by Venugopal R FMEA is a very popular tool used for Risk Analysis, whereas PDPC (Process Decision Program Chart) has been released by JUSE (Union of Japanese Scientists and Engineers) as early as 1976. While the Process FMEA is useful to analyze the potential risks (failure modes) associated with a process, the PDPC is a tool that helps to assess the risks associated with a Project. The Process FMEA begins by listing the process steps and identifying the potential failure modes during each process step. Process FMEA has its inbuilt quantification methods by considering the ratings for Severity, Occurrence and Detection associated with each failure mode and gives a composite Risk Priority Rating (RPN). PDPC is much simpler tool than Process FMEA, and it not only identifies the potential failures, but also the possible counter measures and ends with selection of the feasible counter measures. While we manage complex projects in which the impact of even small failures could be very high, it is very important to foresee potential risks and do an advance mitigation planning. The first step to prepare a PDPC is to develop a tree diagram of the project. The tree diagram begins with the overall objective on the top box. This is the first horizontal level of the PDPC. In the second level, we need to branch out from the overall objective, the major activities that are necessary to accomplish the objective. The third horizontal layer will be the tasks that branch out from each of the activities represented in the second layer. Having created the above 3-layered tree diagram up to ‘task level’, we need to do a ‘what-if’ analysis and identify what could potentially go wrong with each of the tasks. This has to be done by brain-storming using the experience and knowledge of the people and other experts connected to the project. Some of the questions that may be asked to identify the potential failures are: If this task were to fail, how could it go wrong? What is the primary intent of this task? Can it result in doing something else, instead or in addition to its primary intent? Have we allowed for any margin for error? Are there any assumptions made? Do we have experience from similar situations? The identified risks are included in the tree diagram at the fourth level. The team may review these risks and remove the ones that may be very improbable. The counter measure for each risk is identified as the fifth level in the tree diagram. The figure shows the structure of the PDPC tree diagram with the five levels. For each counter measure weight the feasibility considering, cost, time, effectiveness and ease of implementation. Mark the countermeasures that are finally selected as ‘O’ and the ones eliminated as ‘X’

