

Nagraj Bhat
Members
-
Joined
-
Last visited
-
Assuming the 7 wastes that creep into production of goods/service are controlled within customer and business specifications, here are the three examples. Appointments at various set ups (colleges, offices and businesses)where in restricting the exchange to an agreed upon time frame. This helps in effective time management and avoided queuing typically found in the open to all/first in and first out format. Separate allocation in the IVRs/webspace for various categories of businesses and channels of communications. Hence avoiding wait time and improved handle time based on criticality of the cases. Emphasis on one on one meetings rather than skip level meetings is another area where each individual is “listened and not heard”. This drive of ‘one at a time’ helps the sum of the parts to build up the synergy of the whole. Also taking care of the eight waste of poor employee skill management.
-
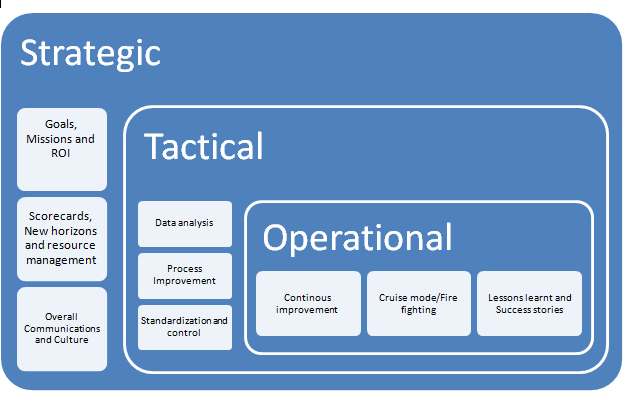
An organization ideally can be split into three major groups with respective responsibilities A STRATEGIC (senior Leadership) head for driving the goals, mission and culture. A TACTICAL (excellence) team for analysis, change and sustenance An OPERATIONAL (Production, Technical and Quality) team for meeting the volume of work, handle deviations and learning. Misplaced Values and corresponding propositions are the reasons for neglected VOB and VOC. So, when the Strategists are content with the ROI, status quo and have pride being risk averse, along with the Operations with no time for change management, adaptations and controlling penalties – Tacticians turn out be a cost. As a Tactician; in order to create a value in the process, through the service, to the product, for the customer and on self – he/she has to Make the organization realize who the customer is and why is he important Develop systems thinking Map Value stream processes Drive triple loop learning Promote stronger communications Encourage transparency Awareness of the industry best practices
-
Two stages are to be attained for a process to be in a statistically controlled state of certainty and quality. Being stable and capable are the requirements for a setup to maintain consistency and conformance to the customers’ requirement. STABILITY – is an ability of a process to perform in a predictable manner over a period of time. The process in this state will be aware of the common cause inherent in the dynamics. Random causes noticed during Stability drive will be analyzed for the root cause and mistake proofed. The goal during stability period is to contain the output within control limits (set by the manufacturer/provider). Control charts provide an insight to the voice of the process. CAPABILITY – is an ability of a process to realize the characteristic that will fulfill the customer requirement. The process in this state will have to be contained within the specification limits (decreed by consumer) agreed with the customer. Assignable causes are made remote if not banished in the process. Capability indices are calculated using the specification width divided by process spread. Indices which determine the spread, the location and long term capabilities are helpful to assess the performance of the process. Ideally a process spread with the output has to be close to the mean of the controls and centered to the specifics. Capability is effectively conceived only if the process is religiously stable. Below are the situation an organization/process can be in. Is Stability achieved Is Capability achieved Status Risk Solution Examples NO NO Both control limits and specification limits are breached. Type I error of considering common cause as special cause is possible as the reviewer would try to tweak the system for reduction in variability. Taming special causes, acknowledging common causes and deriving control limits New employee’s yield/QC score to the company. Stage of assignable causes fed back as a learning. The production from the employee has to be at par with the department’s variation with the output. YES NO Control limits are honored yet overshooting by the specification limits The customer not happy with the output Specification limits are checked for business compatibility. Consistently adhering within the control limits is another option. New application launched for an android. Bugs autocorrected yet not meeting customer expectations with frequent crashes of the system. NO YES All of the output is within the specification limits but out of control. Type II error of special causes treated as common cause. Mean shift has to be addressed. The process needs to be controlled. Special causes out of the control limits should be analyzed. Process to be reviewed. Wait time due to the poor categorization of the IVR. Customers waiting for equal time for resolution irrespective of the severity of the issue. Missed callers are reached out by email. CSAT varies as stability is missing. YES YES The outputs are within the control and specifics Complacency and latency with the processes. Stability to be under check. Continuous improvement. Process reengineering Aircrafts landing and takeoff instances at an airport. Timelines, communications and SOPs are deployed for error free service.
-
Correlation projects the statistical relationship between two variables whereas Causality prompts towards the cause of an event. Correlation does not imply causation and it only provides a possible lead for an analysis. If a plot of two variables in a manufacturing setup is looked at, defects produced against month of the year. They could be a positive correlation (directly proportional), negative correlation (indirectly proportional) or no relationship between the two variables. However if one has to arrive at a causation of one variable on the other, here are the possible investigation patterns Defects have cause and effect exchange with the month of the year Months of the year should have an exchange with the defects caused (reverse causation) Defects in a particular month might influence other months delivery( reinforcing) Defects and month of an year might not be related directly but an unaccounted factor ( e.g leadership) could be causing both. For an investigation be it in problem solving(DMAIC) or problem avoiding(DFSS), Correlation could be the only data available to tell the story between two variables. The study mode is less reliable but indicate a pattern ( Employee satisfaction measured against companies offering cars when compared to companies offering incentives) Correlation among variables offers good start for basic trees and allows to break presumptions in an investigation ( Black cars plotted against road accidents) Sometimes it might not be practical to collect causal information such as data from the clinical trials of a drug. The correlation between the factors( blinded, groups, sites) and the environment ( phases, diseases, medication)should be validated with certain significance level and power( conforming regulatory bodies and pharma companies). Causal data is expensive and time consuming to compile. (Call audits of the entire lot in a center to determine customer satisfaction) In order to bark up at the right tree, a researcher has to recognize the assumptions, evaluate arguments and draw conclusions.
-
In any successful business which believes in building strong customer base, continued innovations and quality delivered the first time shall try to abide by the following equation. (PRICE+VALUE) __ (COST+RISK) = PROFIT Customer’s receivable Manufacturer’s deliverable Business gain(revenue and loyalty) The Price a consumer is willing to pay and the value expected out of it should be higher than the cost for creating a product/service and the risk involved in innovations/improvements. In order to attain good revenue and thereby make profits, an organization will ensure that the cost of quality, service and maintenance are lean in approach. In turn, the price for the product and the value received are seamless. So how does an organization reach the economies of scale of increased production and decreased operational cost. It should identify the need and want of the customer. These requirements are to be weighed against the organizations capability of meeting the stakeholder’s interests, benchmark report, voice of employees and revenue model of the setup. Voice of the Customer can be reactive( Sales report, Audits, Customer complaints) or proactive ( Surveys, Focus groups, Interviews). House of Quality, Affinity diagrams and Pugh matrix are the popular ones used to convert these “voices” to “scope”. Critical to Quality is then realized though metrics for control and improvement of the deliverable. VOC is significant when the organization identified its problems and wanted to check it against the customer’s response ( Sales drop and CSAT feedbacks) wanted to adopt DMAIC roadmap in improving the processes by identifying the problem area. Benchmark report on potential scope in a market for certain product /service. ( Faster laptops for gaming or better treatment of a condition) try using Kano's model and exceed expectation/improvise the need. VOC can be ineffective when the organisation Jumps in for the market share without analysis of the risk for both short and long term sustenance( two wheeler's manufacturer's risk venturing in four wheeler segment) emphasizes more on the revenue and ignores voice of employee, voice of business and voice of process ( seeking more business from offshore client without training of the staff, value streaming the process and ignored profit sharing ) takes up the pressure from the market for discoveries and innovation contributing compromised product/service ( Pharma companies pushing the drugs through the phases with incomplete and inconclusive clinical trials.) has poor leadership, structure and standardization with fundamental flaws in managing business and data collection ( poll results and elected representatives of a bad government).
-
The balance score card advises as to how the customers, the organisation's finances, the up skilling of the staff and internal process should align to create a value add to the service/product. Mapping is the tool which encourages the way a score card is maintained, worked upon and designed. Hierarchy of work in an organization is the layout which explains as to how a work moves from the time an order is placed till its delivery. Tasks -> Activity -> Process -> Value Chain is the flow realized. Basis on the level of work, level of understanding needed, level of involvement, value addition and timelines in an organisation, the below table sheds some light. TASK ACTIVITY PROCESS VALUE CHAIN WHAT A specific unit of work required to create an output A group of tasks required to conceptualize an output Activities aligning to create a flow intending to deliver an confirmed output A series of processes strategically looped in to create a value addition to the product /service DETAILING Required to carry out work FUNCTIONAL Required enough to Quality check the work COMMON Required enough to guide the output DETAILED Required enough to validate and verify the outcome HIGH LEVEL SUCCESS CRITERIA Efficiency, utilization Quality, Customer satisfaction Process improvement measures Revenue and Profits PEOPLE involved are Operational Functional Functional Leadership and Functional TOOLS Flow chart, RACI table, SOP-JD Matrix Process Map, Swimlane, Gantt chart VSM, Process Map, FMEA, Spaghetti diagrams SIPOC, Readiness review, Criteria quadrants, Risk assessment, Org chart
-
Data, the source and need of all investigations in an analysis has been classified based on the attributes and values it describes. Qualitative data are the ones which focus on description, observation and attribution. Its aesthetic and difficult to measure. NOMINAL( names, labels, not ordered) and ORDINAL(ordered, attitudes) are the data levels categorized in this type. Quantitative data are the ones which are measurable or countable. Discrete and Continuous are the classifications in it and supports all the four data levels of being NOMINAL(names, labels, not ordered), ORDINAL(ordered,attitudes), INTERVAL(ordered, no natural zero) and RATIO(ordered, with natural zero). After establishing the measurement to gauge the data and disclose a pattern, one opts for DISCRETE or CONTINOUS form of sampling. Discrete data has values that are distinct, countable, and separate. Bar Graphs are used in this case to represent the data. Number of employees in an organisation Number of defects identified Customer surveys scores Continuous data has values of a continuous range that can be measured, counted and ordered. Histogram and line graph are used to represent the data. Log in times of an employee Length of road laid up per day Amount of milk filled in the packets during packing For instance when a manufacturing set up is to determine the efficiency of the process, the major factors to be measured are the Quality (conformance% or defect count), Productivity( utilization) and Availability (on/off time). Quality can be QC score (continuous) or DPMO(Discrete), Productivity measured through login times(continuous) and Availability gauged through login days (discrete). Continuous data has a distinctive edge over discrete data and if the measurement allows, one can wish for the continuum with the data. Continuous data provides better "see through" for comparatively smaller sizes of sample and is highly sensitive(probability of detection). The prediction from the data is relatively better than with discrete inputs.
-
In a stable process, Variation from the mean is treated based on the severity and the magnitude of the data point. Three major modes/activities used to contain/control the deviation within the process. Correction is deployed when the error has occurred and it has to be contained immediately. The “patch” that is used should fix the error. For instance, 1) A call center agent missing on asking the name of the customer over the call. He corrects himself immediately and the customer wouldn’t bother. 2) The confectionery manufacturer correcting the design of the product to enhance the experience of the customer. The error otherwise is unnoticed by the buyer. Corrective action is the elimination of the root cause to avoid recurrence of the event. The action will help to ensure that the error is not repeated within the process. Thorough RCA should identify the interactions of the system and make the corrective action more effective. For instance, 1) A project deviating from a task. Assuming the business impact being moderate, the corrective action should involve proper situation appraisal, IS/IS NOT analysis and identify the environment causing the fault. 2) On a typical busy day at a hotel reception, the delay in responding to the customer’s query needs a look into. Assuming the dissatisfaction was handled well, manager’s role is to ensure that the situation is not repeated. Hence, the day, the time, the type and other critical factors are to be investigated. Preventive action is the elimination or mitigation of the potential problem identified from a learning elsewhere or within. Replacement, Detection, Facilitation and Prevention are the other principles to be considered depending on the change intended. For instance, 1) Cars recalled for the fault identified during one of the correction. Based on the corrective action implemented for the batch which has this release, the preventive actions are thought over for future potential failures. 2) Medical negligence encountered at a hospital are usually quite critical. The failures are to be prevented with proper standards and controls. Regular monitoring of the records and understanding of the variations should prompt one to undertake mistake proofing. Corrections are made when the variation is within the control limits and the customer is un-fluttered as its inherent in the product. Common causes should be the reason for the error resulting as minor to nil business impact. Issue tracker and Change management should help most of the corrections. Corrective Action and Preventive Action (CAPA) on the other hand is considered to be initiated when the impact is of larger scale to customer satisfaction, the risk factor with business, suppliers and clients and to the process which needs continuous improvement and is deprived of it. Special causes which are a threat to the control and specification limits are to be avoided with changes in design and the processes.
-
Checksheet is a simple, primitive and an effective tool used to record and analyze the data. It primarily captures either distribution or locations of the factors under deliberation. Checksheet precedes the other QC tools used in continuous improvement such as Pareto analysis, Cost analysis, Histograms and Fishbone analysis. Before the advent of automation, checksheet were used in readiness reviews, time stamps, location plots, measurement and calibrations. Its usage has been incorporated into powerful tools deployed in enterprises and industries. These tools transform the data into appropriate information and prompt solutions for strategic decision making. Here is the contrast of the tool’s feasibility - A Store manager using basic hard checksheet on the flow of the products in the rack when compared to the chain of stores monitoring the trend of a product across the region, group and time substantiates the adaptation of the tool. Checksheets are here to stay and oblige the user’s need depending on the environment of information, skill set of the individual, resources available, accuracy/swiftness intended and effectiveness realized of the output.
-
In any business model, the primary aim of the seller is to ensure that the profits made are post the costs incurred in running the setup. For the buyer, the lookout will be the quality of the service/product against the price and time invested. In a push process, the traditional way of “make to stock” is carried out where the resources, materials and energies are aligned to create a flow and send it down stream. The push happens based on the demand forecast and believes in piling up the inventories. In a pull process, the lean way of “make to order” thrives with the customer demand initiating the flow. The pull triggers the stages in process to get the input/output at the stipulated time, delays are managed and no choking between the stages. From order till delivery of a product/service three major areas needs a control. Cost structure – With the onset of Lean thinking in business, organizations have focused more on savings and utilization. A pull strategy believes in reducing the cost with (7) waste management. Mergers and acquisitions are cases when companies push each other resources to deliver better options to the customers. Create a new market of hidden consumer base. The other aspect is of economies of scale - cost advantage due to increased output. A business can capitalize the benefit of the same by creating a demand in the market through value proposition. Work in process – In a pull process, WIP tries to align with the takt time demand. Cycle time is the key area to be dealt with for efficient throughput. Push mode will encourage teams working for R&D and in creative fields to pursuit their ideas/thoughts relentlessly with no rush. Assuming SMART is used to derive the goal. The workforce up skilled and ready for the anticipated work scheduled is another push concept. Load leveling can be used to address the variation in the demand. Value proposition- Quality is another by product of disciplined pulling of the flow. When the demand is understood and inspection is built in at stages of a process, customer gets what he is willing to buy. Pushing will help with many choices to the customer and can also bump customer off-guard when he/she is delighted with something not asked for. Well, it all depends on the FLOW. You can still opt for a hybrid version of the tug(push and pull) with dynamic interface of the system to quickly adapt to the changing demand and the cost to keep up. Having said that, value offered to the customer is more important than the price he/she pays for the service/product.
-
Cost of Quality assessment benefits the organizations translate efforts into profits. It draws the attention of the management towards the overall work accomplished while delivering quality the first time and to the hidden factory ignored which is notoriously run under the pretext of “business as usual”. COQ aligns quality with goals and promotes effective use of resources. Delivering Quality is relatively cheaper when compared to the expenses incurred lack of it. The costs of conformance will be relatively higher at the start however once the quality is built in the product/service, the profits are well managed. Below is the breakup of the components. CONFORMANCE – Cost of Quality NON CONFORMANCE - Cost of Poor Quality Prevention includes Quality planning and assurance, process definition, process capability assessment Internal Failures includes substandard service, rework, downtimes, unused resources, scrap and abandoned projects. Appraisal includes tests, inspections, Quality audits, surveys, reviews and skill assessment External Failures includes recalls, complaints, lawsuits, DSATs and servicing 50% +20% = PREVENTION + INSPECTION 20%+10% = REWORKS + DAMAGES In order to look into what is happening to the voices heard from the market and the criticality identified thereafter, the organization should Determine the processes and their interaction with the system. The functions and the roles of each process. For instance - Quality ( Analyst, Level II etc ), SME and the Operations( TL, Level III). The activities and tasks in the process which are identified as value add for the vision. Effective value stream mapping is the key. These activities are categorized and sorted into the four components. Their occurrences in a month and the time spent on each instance is captured. Later, the manhours invested into these activities in a given month are calculated. Activity based costing helps us to understand the hours put in and billable for the role. Finally one would have the COQ efforts of the organisation as the cost of carrying out the activity in a month will be segregated based on the table above. Modifications and redirecting the approach towards attaining 10-20% of non conformance costs will drive reduced variation and delivery within the specification limits. A snapshot of activities (corresponding hourly dollar value is missed) and proportions in regards to the COQ components. This is for a Quality Analyst.

-
Scope for variations is designed along with the process boundaries and system structure. So when a system adopts a stream, it blends the respective chance and assignable deviations across the functions and will be reporting the non conformance in isolation or in combination. When the process is statistically controlled, it will have common cause variations. These are random in nature and are inherent. These are accepted as are well within the control limits of the process. Process reengineering and continuous improvement are the popular practices deployed to ensure that the efficiency is better than the current state. On the other hand, if the process is out of control it will have special cause variations. These are systematic and are to be analyzed. A failure which was not detected at the error state and not contained when at fault makes us regret. Lean principles (mistake proofing, VSM etc) and 7 QC tools should assist the preventive stage as it’s a flaw in the design of the process that has to be fixed. Tools and practices like FMEA, TRIPLE LOOP LEARNING and QFD does give an insight of the potential risks, the impact of the process gaps, the VOC/CTQ needed for the VSM and thoughts over KAIZEN efforts. These are to be acknowledged and reconstructed for effective designing. Outliers in the control charts should insist us on investigating the root cause and point at process entropy which is otherwise unavoidable. Trains arriving/leaving with variations can be still controlled with standardization, however accidents are to be sorted and prevented.
-
A SIPOC diagram is a visual representation of the high level process map. It captures SUPPLIERs and INPUTs which get into the process and OUTPUTs and CUSTOMERs out from the process. It also determines or rather should be defining the information of the stakeholders involved and the scope boundaries of the stream. This is how we conceptualize it One begins with a high level process mapped. Specific to the stream under investigation. Outputs from this process are listed next. Possible ones are services, products, reports and data etc. Customers are identified and jotted down. Can be categorized as Internal, external, vendors, management and users. Then all the Inputs to the process are captured. Such as data, applications, raw materials etc Finally, Suppliers are put up on the table. Similar to Customers, they can be Internal and external, vendors and others. Post the draft one can look at a table which is well laid out providing a quick snapshot of the process and its extent. The SIPOC layout benefits All the stake holders to have their expectations match the result. Scope is clarified with acknowledged gap analysis. The SIPOC activity benefits during the DEFINE phase of a project. The outcome is of a high level AS IS process explained with the stakeholders and deliverables made explicit. The VOCs and the corresponding CTQs will also provide necessary outlook for the exercise.
-
WHAT Jidoka/Autonomation is one of the pillars of Toyota Production System. The other one being Just - in-time. So, Jidoka is about “Automation with Human touch”. While Automation (replacement of humans) focuses on improving utilization whereas, Autonomation(enhancing value addition of a human) addresses quality of the products/deliverable. HOW When a Jidoka is deployed or employed (if built in), it stops the process from abnormality, corrects the errors, prevents repetition, alerts the controls and restarts the process. It is accomplished by human intervention. An alert and its significance makes whole of Jidoka to be non invasive and efficient. WHY Jidoka is against traditional thinking of inspection towards the end of the process and rework thereafter to recover from damages. Autonomation ensures quality built in the process and only confirmed service/product is delivered. It provides us with tremendous benefit of identifying the hidden factory, reducing rework, external failures and controlled operational costs. Better standardization helps problem detection and quality the first time. WHERE Inspired by the functioning of human body of find, diagnosis and repair below are few applications of Jidoka. Needless to say that the manufacturing setups have discovered this approach of process efficiency and have displayed substantial merit over the years. Talking about smart phones with space cleaner and antivirus Applications. They help user identify the space usage and unwarranted intrusion of malware. User will decide on the alert and approve the automation. The application will repair, advise over RCA and prompt preventive measures. This entire exercise can be automated with status update shared to the user. Fitness watches tracking the movement of the bearer, identifying misses with the course, suggesting remedies, upon confirmation of correction, prompts preventive measures. Project management for minor or major undertakings where in the stages of defining, initiation, Planning, execution, monitoring, control and closure have standardized approach. Each phase will alert deviations, identify the problem, stop the proceedings to reduce the bleeding and get back on track post approvals and conformance to the measurements. Both automation and autonomation have scope to assist the cause. Health care industry implementing Jidoka through evaluation of each assessment to determine the treatment needed for a patient. Each stage is reviewed for the variations from the desired state and corresponding outcome is recommended. Can run entirely by machines or involve humans at critical points.
-
Pacemaker helps the process to set the pace to meet the customer’s demand. Takt Time helps greatly to determine the speed and control of the process. The goal is to match the cycle time to the Takt time. Two major stages - Upstream is the point of origin for the process where it gets the input. Downstream is the point where it is closer to the end/to the customer. The pace maker schedules the process and sends out the signal to upstream as to what the inventory has been and the subsequent demand therefore. When the pacemaker is set closer towards the end of the process, it causes continuous flow resulting cycle time matching lead time. The other pre requisites for pacemaker implementation are and not limited to PULL (released when needed) FLOW (movement with reduced waste) VALUE (Customer’s willing to get) MAP( Designing the process ) PERFECTION (Seeking continuous improvement) Load leveling (Spike in Customer demand) Let’s consider a simple stream of seeking a loan and the getting it approved. PROCESS Applying online Customer reached out Documents received Verification Approval Cycle time( Biz hrs) 0.25 0.25 0.25 0.25 0.10 Lead time(Biz hrs) 8 8 16 16 8 Lead time 7 biz days TAKT time 5 biz days Upstream XXXXXXXXXXXXXXXXXXXXXXXXXXXXXXXXXXXXXXXXX Down stream XXXXXXXXXXX Pacemaker XXXXXXXXXXXX