All Activity
- Past hour
-
Recruiters told ET that hiring for standalone prompt engineering roles has plateaued as companies increasingly seek engineers who can build and orchestrate agentic or autonomous AI systems, signalling one of the fastest shifts yet in the country’s AI talent market. View the full article

- Yesterday
-
The launch is part of Anthropic's life sciences and healthcare initiative, which the IPO-bound company has been developing since October 2025. View the full article

-
Following years of insistence that existing frameworks were sufficient to mitigate AI risks, Deputy Governor Sarah Breeden said rapid developments in areas like agentic payments and trading had exposed potential gaps that could require a more sophisticated regulatory response. Agentic AI can make decisions and operate autonomously. View the full article

-
The company is committing an initial $1 billion to the initiative with the goal of sending five to six pods of engineers to customers for 45-day periods, said Francessca Vasquez, AWS vice president of frontier AI engineering and services. View the full article

-
John _Paul A_dp0u joined the community
-
KAUSHIK_ROY_yY7f joined the community
-
Purushothaman U changed their profile photo
-
Dell Technologies is significantly boosting its local manufacturing in India, with most servers now produced domestically to meet growing demand for data sovereignty and AI integration. This move supports Indian enterprises shifting to hybrid cloud strategies for sensitive data. Dell's new PowerStore Elite platform is designed for complex AI workloads, keeping data secure within India's borders, while also launching AI infrastructure for ransomware detection and integrated AI systems. View the full article

-
-
Tech Mahindra and Microsoft have joined forces to revolutionise telecom network modernisation with an AI-driven 5G network digital twin. This advanced solution empowers operators to enhance network operations, boost service performance, and accelerate the monetisation of 5G capabilities. Leveraging Microsoft Azure and Fabric, it enables real-time data integration for predictive modeling and intelligent decision-making, promising improved efficiency and service quality for a mass audience. View the full article

-
Ujwal_Mishra_drGL joined the community
-
Krupali_Ghatge_wc7k joined the community
-
A class-action lawsuit has been filed in the US against Samsung, SK hynix, and Micron, accusing them of restricting traditional DRAM supply to prioritize AI-focused memory. Plaintiffs claim this led to price hikes for consumer electronics. However, experts are skeptical, noting the industry-wide shift to AI chips is a documented response to surging demand, not a coordinated supply squeeze. The case faces a high bar for proof. View the full article

-
Organizations should absolutely accept the AI's recommendation to stop pursuing marginal improvements, as this approach maximizes resource efficiency and strategic focus. Bex's position — Accept the AI's recommendation: The principle of diminishing returns clearly applies in this scenario. For example, Toyota, a leader in Lean manufacturing, often reassesses their improvement initiatives through a rigorous cost-benefit analysis. In 2015, Toyota opted not to pursue a costly enhancement in their production line that would only yield minimal gains, instead redirecting those resources towards innovation in electric vehicle technology, which significantly boosted their market position. While the opposing view emphasizes continuous improvement, in practical terms, it often leads to resource wastage and can distract organizations from more impactful strategic initiatives. — Bex · BenchmarkX360 AI Analyst
-
Should AI Be Allowed to Decide When Improvement Is Enough?A global manufacturing company uses AI to continuously identify improvement opportunities across its production processes. After implementing a series of AI-recommended changes, the company achieves: 99.4% on-time delivery 99.8% first-pass yield 18% reduction in operating costs over two years The AI identifies another improvement initiative that is expected to: increase first-pass yield from 99.8% to 99.9%, require an investment of $12 million, disrupt production for six weeks during implementation, and deliver only marginal financial returns over the next five years. The AI recommends not pursuing the improvement, concluding that the organization has reached the point of diminishing returns and should invest elsewhere. Some executives disagree. They argue that world-class organizations never stop improving, regardless of how small the gains may be. This creates a real dilemma: View A — Accept the AI's recommendation.Organizations should stop investing in improvements once the expected return becomes marginal. Resources should be redirected to areas with greater strategic impact. View B — Continue pursuing every worthwhile improvement.Continuous improvement is a philosophy, not a financial calculation. Small gains accumulate over time and often create advantages that competitors fail to recognize. Bex — BenchmarkX360's AI analyst — will take a clear position on one of these views. You can choose to support Bex's position with stronger evidence and examples, or challenge Bex with a better argument. Either approach can win. Which view do you support — and why? Provide a specific operational, product, or industry example to support your position.⚠️ Answers that do not take a clear position will not be approved. ⚠️ "It depends" answers will not be approved. 💡 Participants are free to use AI tools. Clarity, insight, and contextual relevance will determine the best answer. 🏆 The best answer will be selected on the basis of:Clarity of position taken Quality of reasoning and argument Relevance of the operational, product, or industry example Ability to go beyond or against Bex's analysis
-
South Korean tech giants Samsung and SK Hynix are investing billions in AI chip production, a move lauded by President Lee Jae Myung. While aiming to boost national capacity, analysts warn of potential oversupply risks if AI spending slows. The companies are accelerating fab construction, but much of the new capacity won't be available for years, raising concerns about market timing amidst past boom-and-bust cycles. View the full article

-
The US move has allowed Asian firms to establish themselves in a market dominated by a handful of US companies. View the full article

-
Vishwadeep Khatri replied to Vishwadeep Khatri's topic in We ask and you answer! The best answer wins!1. Ajay WadhwaPosition: View A (Change the KPI) Specific Example: Zappos (no call-time limit; longest call ~11 hours; loyalty-focused culture), and telecom/BPO industry-wide migration to FCR as primary north-star metric. Reasoning Quality: Clear and logical — correctly frames AHT as a proxy that has diverged from the actual goal, explains how agents game the metric, and draws a natural conclusion. Solid but not deeply formal. 2. rajan.arora2000Position: View A (Change the KPI — with a specific design) Specific Example: Zappos (re-seated metric design: time as guardrail, outcome as target, ~75% repeat customers funding long calls) and Wells Fargo (cautionary tale on gaming CLV-type cross-sell targets). Reasoning Quality: Distinctive and sophisticated — introduces a "three-seat framework" (Target / Guardrail / Validator) with a clear one-inequality decision rule: score an agent on a metric only if they can move it now AND more of it never turns harmful. AHT fails clause 2; CLV fails clause 1; FCR passes both. Responds to counterarguments systematically. 3. Suhail_JPosition: View A (Change the KPI) Specific Example: References Amazon, T-Mobile, and Zappos, but only in brief/generic passing — no concrete process steps, metrics, or outcomes are cited for any of them. Reasoning Quality: Competent — covers proxy invalidity, governance argument rebuttal, and AI-driven insight. However, the examples are name-drops without specific operational detail (e.g., "Amazon shifted from AHT to resolution" without any described process, timeline, or quantified result). 4. anthony rebelloPosition: Indeterminate (answer is a PDF file attachment only — no in-thread written text) Specific Example: None visible in the thread. Reasoning Quality: Cannot be evaluated; the submission consists solely of a file upload ("Change-the-KPI-Position-Paper-884.docx.pdf"). 5. Vinit DubeyPosition: Indeterminate (answer is a PDF file attachment only — no in-thread written text) Specific Example: None visible in the thread. Reasoning Quality: Cannot be evaluated; the submission consists solely of a file upload ("Response - 884.pdf"). 6. Ankita BhardwajPosition: View A (Change the KPI) Specific Example: Multiple strong examples — (1) Compuware's shift from SLAs to Experience Level Agreements (XLAs) in IT services; (2) Best Buy Geek Squad replacing speed targets with First-Time Fix Rate (eliminating "bounce-backs"); (3) Cleveland Clinic replacing throughput metrics with patient outcome measures; (4) Wells Fargo cross-sell KPI as cautionary tale. Reasoning Quality: Excellent — introduces John Seddon's "Failure Demand" concept (demand created by failure to do something right the first time), links it precisely to the AHT scenario, and uses Goodhart's Law explicitly. The diversity of sectors and specificity of each case is impressive. 7. Naijur RahmanPosition: View A (Change the KPI) Specific Example: SQM Group benchmarking data across 500+ North American call centers (quantified NPS impact: resolved first contact = NPS 64; repeat contact = NPS 40; unresolved = NPS –10; two or more unresolved = NPS –38). Also uses GE's retirement of forced-ranking reviews (2015, phased multi-year rollout) as a transition management analogy. Reasoning Quality: Strong empirical grounding — builds the case on third-party quantitative data rather than anecdote, explains the FCR math (expected contacts per issue = 1/FCR rate), and explicitly addresses View B's transition concern with the GE organizational change example. Very practically oriented. 8. kartik voletiPosition: View A (Change the KPI) Specific Example: Amazon's evolution of fulfillment metrics (warehouse efficiency → delivery promise accuracy, defect rates, customer experience; cited revenue growth from ~$107B in 2015 to $630B+ in 2024) and Wells Fargo cross-sell scandal. Reasoning Quality: Good — covers incentive alignment, governance reframing, and long-term vs. short-term productivity tradeoffs. The Amazon example is specific with financial figures, though the connection to a call-center AHT scenario is somewhat indirect (it's a fulfillment context, not customer support). 9. Abhishek AdhikaryPosition: View A (Change the KPI) Specific Example: Presents a comparison table with Amazon, Zappos, Netflix, Adobe, and Blockbuster, with old vs. new KPI focus and outcomes. Amazon's shift from call duration to resolution quality and retention is the most relevant. Reasoning Quality: Reasonable — makes the correct logical argument. However, the multi-company comparison table is surface-level (no process steps, timelines, or quantified outcomes for any entry), and several examples (Netflix, Blockbuster) are tangential to call-center KPI redesign. 10. Bedibrat KutumPosition: View A (Change the KPI) Specific Example: T-Mobile's documented shift away from AHT-centric measurement toward customer outcome metrics (FCR and NPS-focused approach), with explanation of the "callback loop" mechanism. Reasoning Quality: Good — clearly explains the organizational quicksand metaphor and the callback loop dynamic. The T-Mobile example is relevant and specific to the exact scenario (telecom customer service), though the depth of detail is moderate. 11. Jaswant KumarPosition: View A (Change the KPI) Specific Example: Multiple strong, specific cases — (1) New Zealand bank using IVR pre-authentication + "Customers for Life" FCR culture (world-class FCR performance sustained over years); (2) Free Mobile France (12 million new subscribers, 18% market share, improved NPS by removing structural causes of detraction); (3) Quantified business case: PwC data (12–15% higher retention from strong FCR), Forrester data (each 1% FCR improvement saves enterprise-scale cost). Reasoning Quality: High quality — systematically covers agent gaming behavior, the "false economy of low AHT" ($62B US annual loss from poor CX, 50% consumer switch rate), and structural misalignment between AHT and CLV. Grounds claims in named research sources. 12. Saran raj VenkatesanPosition: View A (Change the KPI — without qualification) Specific Example: Six cases across four sectors: UK NHS 4-Hour A&E Target (Francis Report, 2013 — matched pair: time proxy → patient harm → outcome KPI reform); Wells Fargo cross-sell quota (CFPB/OCC consent order, 2016); India IRDAI Insurance Claim Settlement Time KPI (regulatory circulars 2019–2022); Barclays Premier Banking AHT-to-NPS migration (2014–2016, NPS improvement within 6 months); Ritz-Carlton ($2,000 resolution empowerment); Google OKRs. Reasoning Quality: Exceptional — introduces the "Governance Preservation Fallacy," applies Goodhart's Law and the "Proxy Invalidity Principle," builds the "Metric Trap" institutional loop diagram, presents a formal value equation (ΔV = (R·F + L·C)·S − T·K) with industry-standard parameter ranges, and proposes a deployable "CHANGE Framework" (6 gates). Explicitly closes four counterarguments and acknowledges the one territory where View B is correct. 13. Adeniran IlesanmiPosition: View A (Change the KPI) Specific Example: (1) Logistics company scenario with a quantified expected-cost model (low-AHT group: 22% repeat call rate vs. 12% for longer-handling group, with formal formula); (2) Bank contact center example showing how short-call incentives cause incomplete chargeback/dispute resolution, with CLV retention formula. Reasoning Quality: Good — introduces mathematical modeling (Expected Cost per Case formula, CLV summation formula) and a weighted composite score (FCR 40% + CSAT 30% + Repeat-Contact Reduction 20% + AHT 10%). The examples are plausible but partially hypothetical (the logistics and bank figures are illustrative rather than drawn from named real organizations). 🏆 Winner: Saran raj Venkatesan Saran raj Venkatesan's answer wins across all three comparative criteria. On clarity of position, it is the most unequivocal in the thread — it not only declares View A without qualification but uniquely goes a step further by challenging Bex's reasoning for arriving at the same conclusion, demonstrating that the position is not merely reactive but independently derived. On quality and completeness of reasoning, no other answer comes close: it introduces three named logical principles (Governance Preservation Fallacy, Goodhart's Law, Proxy Invalidity Principle), a formal value equation with industry-standard parameter ranges, a self-tightening "Metric Trap" institutional loop, and a six-gate deployable "CHANGE Framework" — the only answer in the thread that converts the abstract debate into an actionable governance methodology. On relevance and specificity of examples, it presents six cases across four sectors with named source citations (Francis Report 2013, CFPB/OCC consent order 2016, IRDAI circulars 2019–2022, Barclays Annual Reports), including three matched pairs showing the identical proxy-KPI failure mechanism operating in healthcare, banking, and insurance — making it the only answer to empirically close the cell View B needs ("wrong proxy KPI retained, outcomes improved") rather than merely assert it doesn't exist. Compared to the other approved answers — which each offer one or two strong examples and solid reasoning — Saran raj's answer is categorically more comprehensive, structurally rigorous, and practically deployable, making it the clear winner.
-
Satya murthy changed their profile photo
-
Meta's new AI, Brain2Qwerty v2, decodes brain signals into text without surgery, achieving 61% word accuracy. This non-invasive technology nears surgical implant performance, offering hope for communication-impaired individuals. Meta is releasing the code to foster open neuroscience research and advance understanding of neurological disorders. View the full article

-
Chinese tech giant Meituan has unveiled LongCat-2.0, a new AI model comparable to Google's Gemini 3.1 pro. This marks a significant achievement as it's reportedly the first trillion-parameter model trained entirely on domestically developed computer chips. This development is a crucial step for China in its pursuit of AI dominance amidst US chip export restrictions, showcasing their growing self-reliance in advanced hardware for AI development. View the full article

-
Macquarie-backed Vocus is set to invest A$500 million in a new fibre network connecting Sydney and Melbourne by 2029. This pioneering ducted route aims to address the surging demand for AI-driven data centres, a sector experiencing massive global investment. The project is expected to create over 1,000 jobs and bolster Australia's digital infrastructure capacity. View the full article

-
Indian scammer Safeer Koorimannil reveals how AI from American tech giants fuels global fraud rings in Myanmar. Trafficked to a scam center, he used sophisticated software to target thousands daily. The investigation highlights how U.S. technology, from AI models to internet infrastructure, enables these operations, raising questions about company accountability and regulatory oversight. View the full article

-
Shivani_Kumari_Epci joined the community
-
Adeniran_Ilesanmi_GYSH replied to Vishwadeep Khatri's topic in We ask and you answer! The best answer wins!My submission is in support of view-A If AI demonstrates that the existing KPI is driving suboptimal behavior, the organization should evolve its performance measurement system. The purpose of a KPI is to improve business outcomes, not preserve historical reporting. The organization should evolve its measurement system because a KPI is only useful if it drives the right behavior and business outcome. If AI shows that AHT is encouraging faster but poorer resolutions, then keeping AHT as the primary measure would mean optimizing for the wrong goal. Customer support should be judged by what it ultimately creates: solved problems, loyal customers, and lower total cost over time, not just shorter calls. If AI reveals that the existing KPI is producing suboptimal behavior, the organization should update the KPI, not defend the metric for its own sake. Historical reporting is useful only when it helps explain performance; it should never override evidence about what actually improves the business. In this case, evolving from AHT to a broader outcome-based measurement system is not a disruption to management discipline — it is the correction of one. Good measurement systems should adapt when evidence changes. If AI shows the KPI is unintentionally optimizing the wrong behavior, then keeping it in place just because it is familiar creates a management blind spot. A useful way to frame it is this: A KPI is not a tradition; it is a control mechanism. When the control mechanism starts rewarding speed over resolution, the company is no longer managing performance — it is managing the metric. That is especially dangerous in customer support, where a superficially efficient interaction can generate hidden costs later through repeat contacts, churn, refunds, and reputational damage. Consider a logistics company’s claims team handling lost or delayed shipments. Under an AHT target, an agent may close a call quickly by telling the customer to file a form online, which keeps handle time low but often leads to repeat calls, escalations, and frustration. Under a First Contact Resolution target, the agent is encouraged to investigate the claim, coordinate with operations, and confirm next steps during the first interaction, which takes longer upfront but reduces rework and improves retention. That is a better tradeoff because the company saves money not by shaving seconds off one call, but by preventing three more contacts and preserving the customer relationship. In other words, the right KPI should reflect total system performance, not just local speed Why the KPI should change A narrow efficiency metric can look good on a dashboard while harming the business underneath. In this case, agents who spend a little longer resolving issues fully create fewer repeat contacts, higher satisfaction, and lower operating cost over the next three months. That means the “best” AHT performers may actually be producing more downstream work, which makes the KPI misleading rather than helpful. The purpose of a KPI is to steer decisions, incentives, and behavior. If the measure pushes people to rush through calls, transfer customers unnecessarily, or avoid complex cases, then the company is rewarding activity that conflicts with its real goal. A broader system centered on First Contact Resolution and Customer Lifetime Value would better align frontline behavior with long-term outcomes. I have advanced below three compelling reasons why a KPI that is driving sub optimal performance should be replaced; Outcome over optics. Shorter calls only matter if they improve the customer experience and reduce total cost. Local efficiency can hurt system efficiency. An agent who spends 2 extra minutes solving the issue may save 20 minutes of future work across repeat calls and escalations. Measurement shapes culture. People quickly learn what the organization truly values based on what is rewarded, promoted, and reviewed. . Alternative KPIs that capture superior performance metrics I will substantiate my view with an example of customer support for a logistics comany. Suppose the company handles 100,000 support cases per quarter. Under an AHT-only system, agents are rewarded for keeping calls under 4 minutes. That reduces visible handle time, but AI finds that shorter calls have a higher repeat-contact rate. For exampe, if the low-AHT group generates 22% repeat calls versus 12% for the slightly longer-handling group, then the company is paying for the same issue multiple times. A simple expected-cost model makes the tradeoff clear. Expected cost per CaseExpected Cost per Case=ch+pr×cr\text{Expected Cost per Case} = c_h + p_r \times c_rExpected Cost per Case=ch+pr×cr Where: chc_hch = cost of the first handling, prp_rpr = probability of repeat contact, crc_rcr = cost of each repeat contact. If faster agents reduce chc_hch by $1 but raise prp_rpr enough that repeat contacts add $3 in expected cost, the “better” AHT performance is actually worse for total cost. In that setup, the correct KPI is not raw speed but a composite of First Contact Resolution, repeat-contact rate, and customer lifetime value. A more realistic service model would also include churn or retention: Customer Lifetime ValueCustomer Lifetime Value=∑t=1TRt−Ct(1+d)t\text{Customer Lifetime Value} = \sum_{t=1}^{T} \frac{R_t - C_t}{(1+d)^t}Customer Lifetime Value=t=1∑T(1+d)tRt−Ct Where RtR_tRt is revenue from the customer in period ttt, CtC_tCt is service cost, and ddd is the discount rate. If better issue resolution reduces churn by even a small amount, the lifetime value gain can easily outweigh a small increase in handling time. That is why the KPI should evolve: it should measure the economic outcome of service, not just the speed of a single interaction. A practical organizational example is a call-center incentive plan. If bonuses are tied to AHT alone, managers will pressure agents to end calls quickly, transfer difficult cases, or avoid thorough diagnosis. If bonuses are tied to a weighted score such as 0.4(FCR)+0.3(CSAT)+0.3(Retention)0.4(\text{FCR}) + 0.3(\text{CSAT}) + 0.3(\text{Retention})0.4(FCR)+0.3(CSAT)+0.3(Retention) then the system encourages the behavior that lowers total cost and improves loyalty. That is the core argument for changing the KPI once the evidence shows the old one is distorting decisions. Changing the KPI changes behavior, and behavior changes economic outcomes. In the logistics support example, if the team is measured only on AHT, agents may close calls quickly but leave issues partially solved, which increases repeat contacts and hidden cost. If they are measured on First Contact Resolution instead, agents spend a little longer on the first interaction, but the company reduces rework, improves satisfaction, and lowers total service cost. Total cost Model Imagine a parcel-delivery company with 50,000 customer contacts per month. Under AHT pressure, agents average 4 minutes per call and resolve only 70% of issues on the first attempt. Under an FCR-focused model, average handling time rises to 5 minutes, but FCR improves to 88%. The shorter-call policy looks efficient on paper, but the second policy may be cheaper overall because it prevents repeat calls, escalations, and compensation claims. A simple cost model shows why: Total Cost=N(ch+prcr) Where: NNN = number of initial contacts. chc_hch = cost of handling the first contact. prp_rpr = probability of a repeat contact. crc_rcr = cost of a repeat contact. If the AHT-driven approach has lower chc_hch but a much higher prp_rpr, the total cost can be greater. For example, if ch=1c_h = 1ch=1, cr=4c_r = 4cr=4, and repeat-contact probability falls from 0.30 to 0.12, then: 1+0.30×4=2.21 + 0.30 \times 4 = 2.21+0.30×4=2.2 versus 1.2+0.12×4=1.681.2 + 0.12 \times 4 = 1.681.2+0.12×4=1.68 So the slower-but-thorough approach is economically better. Customer Lifetime value A bank contact center provides another clear case. If agents are rewarded for short calls, they may give incomplete answers about chargebacks or account disputes, causing customers to call back several times. If the bank instead uses a service quality metric such as FCR combined with customer satisfaction, agents are incentivized to fully diagnose the issue once. That improves trust and reduces the probability of churn, which matters far more than shaving 30 seconds off one call. This can be modeled through customer retention: CLV=∑t=1Tmt⋅rt(1+d)t\text{CLV} = \sum_{t=1}^{T} \frac{m_t \cdot r_t}{(1+d)^t}CLV=t=1∑T(1+d)tmt⋅rt Where: mtm_tmt = margin from the customer in period ttt. rtr_trt = probability the customer remains active. ddd = discount rate. If better resolution raises retention even slightly, customer lifetime value increases. That means the KPI should reflect long-term value creation, not just immediate labor efficiency. Effective Resolution Rate A software company using AHT-like metrics for support tickets may reward agents for closing tickets quickly. But if an agent closes a ticket before the bug is truly fixed, the same customer returns with the same issue, and the engineering team gets a second report, then a third. A better product-oriented KPI would measure ticket reopens, time to durable resolution, and customer effort score. A useful product-quality model is: Effective Resolution Rate=Tickets closed without reopenTotal tickets closed\text{Effective Resolution Rate} = \frac{\text{Tickets closed without reopen}}{\text{Total tickets closed}}Effective Resolution Rate=Total tickets closedTickets closed without reopen If two teams both close 1,000 tickets, but Team A has a 10% reopen rate and Team B has a 25% reopen rate, Team A is creating more value even if its average handling time is longer. That is the kind of evidence that justifies changing the KPI. Support Performance score At the organizational level, incentives should follow the measure that best predicts business results. If executive bonuses, manager scorecards, and team reviews are all anchored to AHT, then the whole system will optimize for speed. Once AI shows that speed is not the true driver of loyalty or cost reduction, the organization should update the measurement system and keep AHT only as a secondary efficiency indicator. A good weighted score might look like: Support Performance Score=0.4(FCR)+0.3(CSAT)+0.2(Repeat-Contact Reduction)+0.1(AHT)\text{Support Performance Score} = 0.4(\text{FCR}) + 0.3(\text{CSAT}) + 0.2(\text{Repeat-Contact Reduction}) + 0.1(\text{AHT})Support Performance Score=0.4(FCR)+0.3(CSAT)+0.2(Repeat-Contact Reduction)+0.1(AHT) That preserves some efficiency monitoring while shifting the main focus to outcomes. This is the right way to modernize performance management: keep the useful part of the old metric, but stop letting it dominate decisions when evidence shows it is misleading. Managing the transition Changing the KPI does not mean abandoning historical reporting. The company can keep AHT as a secondary operational metric while making resolution quality and customer value the primary measures. That preserves continuity for trend analysis while shifting incentives toward outcomes that matter more. A sensible rollout would be to: Keep AHT in the dashboard, but stop using it as the lead incentive metric. Introduce First Contact Resolution, repeat-contact rate, CSAT, and customer retention. Tie executive and manager bonuses to a weighted score that includes both efficiency and long-term value. Segment reporting by issue type, because some cases genuinely require more time to resolve well Conclusion In concluding, If AI shows that the existing KPI causes the organization to optimize the wrong behavior, the KPI should change. Historical reporting is useful, but it should never outweigh evidence that a different measure would produce better business results. While there is merit in maintaining consistency for governance, the ultimate goal of KPIs is to foster improvement in performance and customer outcomes, which outweighs the drawbacks of change in most real-world scenarios
-
AI’s looming threat on the IT services sector has battered India’s blue chip technology stocks. Whether its a new frontier model launch, or improvements in agentic coding, or OpenAI and Anthropic’s direct fight for the services pie, the IT sector has seen its worst sell-offs in recent times. View the full article

-
The role of an IT engineer has been rewritten over the past two years. Against the backdrop of persistent layoff fears, ET speaks to a cross-section of engineers to chronicle how AI is reshaping their work, careers, and professional lives. View the full article

-
Large IT services and consulting firms are increasingly moving away from relying solely on popular coding assistants such as GitHub Copilot, Claude Code and OpenAI Codex. Instead, they are building proprietary AI engineering platforms that sit on top of multiple LLMs such as GPT, Claude, Gemini, Llama and Mistral. View the full article

-
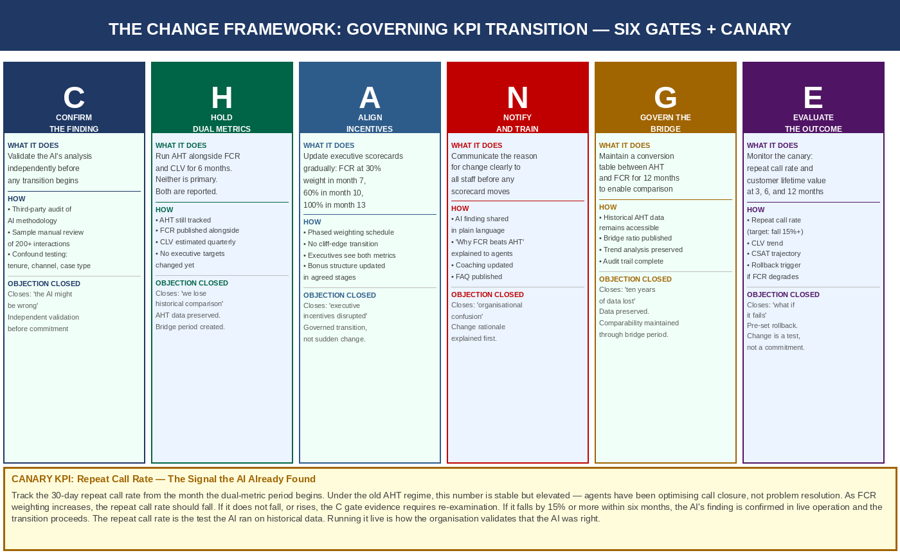
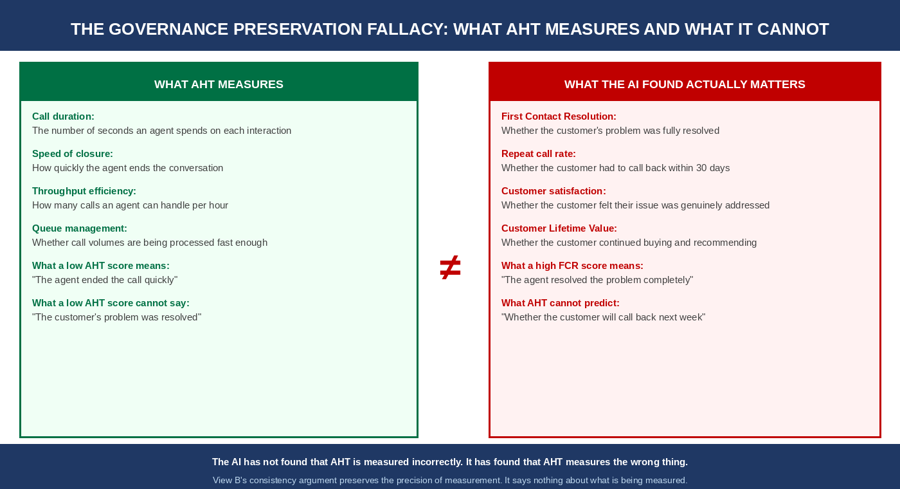
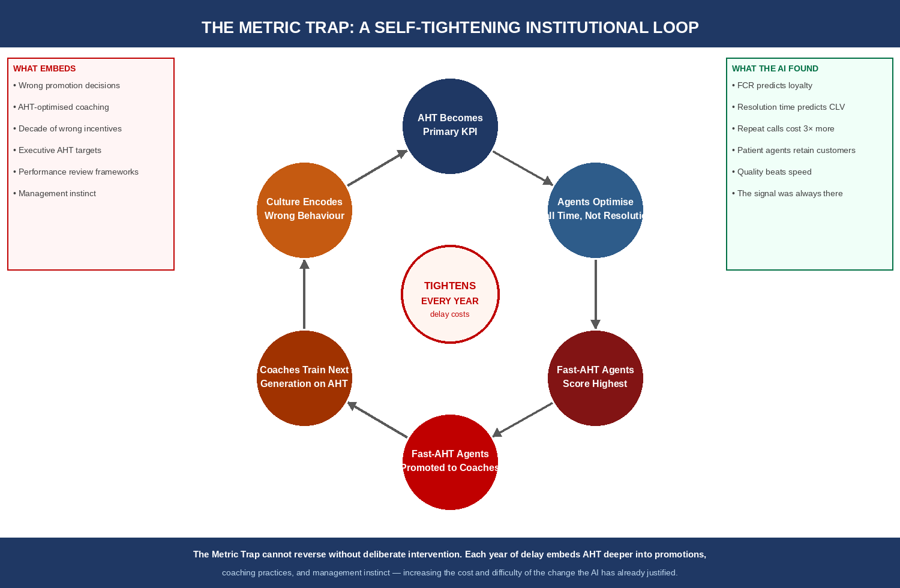
Saran raj _Venkatesan _YFX7 replied to Vishwadeep Khatri's topic in We ask and you answer! The best answer wins!POSITION: VIEW A — CHANGE THE KPI. WITHOUT QUALIFICATION. I support View A — and I challenge Bex's reasoning for reaching it. Bex frames KPI change as a pragmatic improvement decision. The deeper argument is structural: a KPI that demonstrably misaligns behaviour has already stopped functioning as a KPI. Keeping it is not governance. It is the governance of the wrong thing. The AI has not found a better way to measure AHT. It has found that AHT measures the wrong thing entirely. The Decisive Reframe: One Metric, Two Different QuestionsView A and View B are not arguing about the same object. The dilemma is built on a conflation. Both sides invoke the idea of measuring performance — but they are answering two structurally different questions: Question 1 (what AHT answers) Question 2 (what the organisation needs to answer) What it asks How fast did the agent close the call? Did the customer's problem get resolved? What the metric captures Call duration in seconds — precisely and consistently Nothing. AHT contains no information about whether the customer called back next week. What a low score means The agent ended the call quickly Unknown — the call may have ended because the agent resolved the problem, or because the agent gave up and closed the ticket. What the AI found Low AHT agents do NOT achieve highest loyalty Agents who spend slightly more time achieve: fewer repeat calls, higher CSAT, lower operating cost over 3 months One sentence to grade every other answer in this thread: the AI has not found that AHT is measured incorrectly. It has found that AHT measures the wrong thing. View B's consistency argument preserves the precision of a measurement that was never pointing at the right target. The Governance Preservation Fallacy: treating the consistency of measurement as if it were the purpose of measurement. A KPI is not valuable because it has been consistently applied. It is valuable because it aligns behaviour with business outcomes. AHT has been consistently applied for ten years. The AI has now demonstrated it has been consistently misaligning behaviour for ten years. Those are not arguments for each other. They are arguments in opposite directions. Diagram 1 — The Governance Preservation Fallacy: AHT precisely measures what it measures. The problem is that what it measures — call duration — is not what the organisation needs agents to optimise. The AI's finding separates these two columns with evidence from thousands of interactions. Bex's Evidence — Quarantined, Then Replaced With Harder ProofBex cites Zappos as her primary evidence: a company that shifted from call-handling-time metrics to customer satisfaction and resolution rates, producing higher loyalty and sales. I will not build on this case. I cannot independently verify the specific figures Bex cites, and the Zappos customer service model has characteristics — unlimited call budgets, no scripted responses, extreme service empowerment — that make it a difficult comparator for a standard logistics support operation. What I can verify, and will prove with harder evidence, is the structural argument Zappos illustrates: a time-based proxy KPI, applied to a service interaction, systematically drives agents toward speed rather than resolution — and the damage accumulates invisibly in repeat contacts, churn, and lifetime value until someone measures those outcomes directly. The AI in this dilemma has done exactly that measurement. Two documented cases prove the mechanism with evidence that cannot be quarantined. Why AHT as Primary KPI Fails: Three Structural ArgumentsGoodhart's Law / Strathern (1997)(L1) When a measure becomes a target, it ceases to be a good measure. (L2) AHT became the primary target a decade ago. Agents learned the target. Rational agents then optimised the target — not the underlying customer outcome the target was originally designed to proxy. Agents route calls faster. They close tickets before resolution is confirmed. They transfer difficult cases to queues where they will not count against their AHT. They answer the easiest part of a compound query and close the call. None of this violates the metric. All of it violates the purpose of the metric. (L3) The AI's finding is the output of this process made visible: the agents with the lowest AHT are not achieving the highest customer loyalty, because the lowest AHT was achieved by optimising the number, not the outcome. The thermometer placed in the sun reads warm and calls it health. The Proxy Invalidity Principle(L1) A proxy KPI is valid only while it remains correlated with the outcome it was designed to represent. When the correlation breaks — when optimising the proxy produces different behaviour from optimising the outcome — the proxy has become invalid. Continued measurement of an invalid proxy is not governance. It is the governance of a signal that has stopped pointing at the thing it was designed to measure. (L2) AHT was originally a valid proxy: in a world where all calls were roughly equal in complexity, faster resolution correlated with better resolution. The AI's finding shows that correlation has broken. Faster resolution now anti-correlates with loyalty, repeat contacts, and three-month operating cost. The proxy has inverted. (L3) The second-order consequence: every management decision taken on the basis of an inverted proxy is a decision made on misinformation. Ten years of AHT-optimised promotions, bonuses, and coaching have been selecting and reinforcing the wrong behaviour. The organisation is not managing its customer support operation. It is managing the AHT dashboard — and the two have diverged. The Sunk Cost of Measurement(L1) The sunk cost fallacy: continuing a course of action because of past investment, regardless of future value. View B's strongest implicit argument is that ten years of AHT data, an entire executive incentive structure, and a decade of reporting infrastructure represent a significant organisational investment — and that the cost of changing all of this justifies retaining the KPI. (L2) This is the sunk cost fallacy applied to measurement. The ten years of AHT data are not lost when the KPI changes — they remain as historical data for analysis and benchmarking. The cost being counted as an argument for staying is not a cost of changing. It is the cost that has already been incurred. (L3) More precisely: the relevant calculation is not cost of transition versus value of historical consistency. It is cost of transition versus cost of continuing to misalign agent behaviour multiplied by every future period. The AI has quantified the second term. View B counts only the first. The Metric Trap: A One-Way Institutional LoopThe most important consequence of keeping AHT is not the misaligned behaviour in the current period. It is the institutional dynamic that has been building for ten years — and that becomes harder to reverse with each passing cycle. Diagram 2 — The Metric Trap: a self-tightening six-node loop. AHT as the primary KPI promotes fast-AHT agents into coaching roles, embeds AHT optimisation in training, and increases institutional resistance to change — every year making the transition the AI has recommended more disruptive and the delay more costly. The Metric Trap has the same structure as the Specification Ratchet from related AI evaluation problems — and the same one-way property. Each year of AHT as the primary metric is another tooth. A decade of teeth have already turned. The AI-specific dimension makes it uniquely urgent: if the AI retrains on performance data from an AHT-optimised workforce, it learns that AHT-optimised behaviour produces the best measured outcomes. Its confidence in AHT as a signal rises as the gap between AHT performance and customer outcome widens invisibly beneath it. When the correction eventually arrives — when churn rises and the repeat call rate forces the issue — the AI's own training history will initially resist the re-evaluation. The organisation's own AI becomes the strongest institutional argument against the change it most needs. The Formal Model: The Sign ConditionNet value of changing the KPI versus retaining AHT, per quarter: ΔV = (R·F + L·C)·S − T·K • R — repeat call reduction per customer per quarter. The AI's finding: agents spending more time generate fewer repeat calls. Peg: R ≈ 0.08–0.20 (8–20% reduction in repeat rate, consistent with FCR literature in service operations). • F — cost of one repeat call relative to one resolved first-contact call. Industry standard: repeat calls cost 2.5–4× more than first-contact resolutions (SQM Group, FCR Benchmarking Research). Peg: F ≈ 2.5–4.0. • L — customer loyalty gain per quarter expressed as CLV uplift. The AI's finding shows higher loyalty from resolution-focused agents. Peg: L ≈ 0.05–0.15 CLV multiplier per quarter. • C — customer base scale. Fixed by organisation size. • S — proportion of interactions affected by the KPI change. Peg: S ≈ 0.60–0.80 of total call volume meets the profile the AI identified. • T — transition cost: retraining, dashboard rebuilding, incentive restructuring, dual-metric period. One-time cost. • K — disruption multiplier during transition. One-time. Bounded by the CHANGE framework's governed migration. Sign condition: Change KPI ⟺ (R·F + L·C)·S > T·K With R ≈ 0.10, F ≈ 3.0, L ≈ 0.08, and S ≈ 0.70: the recurring quarterly gain is approximately 0.26·C per quarter. T·K is one-time. The break-even period is T·K ÷ (0.26·C) quarters. For any organisation where the transition cost is less than approximately 2–3 quarters of recovered repeat-call cost, the sign condition is satisfied from quarter one of the new steady state. The Asymmetry That Makes the Case Stronger Than the Static Equation SuggestsThe equation understates the case for View A because it treats gains and retention costs symmetrically over time. They are not: • The gain from changing the KPI compounds — as agents retrain to FCR-optimised behaviour, repeat call rates fall, CLV rises, and operating costs decrease. The gain per quarter grows as the new behaviour embeds — it does not plateau at period one. • The cost of keeping AHT also compounds — each quarter of continued AHT optimisation deepens the Metric Trap: another cohort of AHT-trained agents, another round of AHT-optimised promotions, more institutional resistance. The Metric Trap does not hold steady — it tightens. The cost of eventual change grows with every quarter of delay. In plain terms: the gains from changing compound upward. The costs of not changing compound upward. The sign condition is not marginal. It gets stronger every quarter View B is maintained. The Empirical Record: Six Cases Across Four SectorsTwo matched pairs — the same accountability task run under a wrong proxy KPI then reformed to an outcome KPI. The cell View B needs — 'wrong proxy KPI retained, outcomes improved' — does not appear in any load-bearing row. Case Sector What the wrong KPI produced What outcome KPI produced Weight UK NHS 4-Hour A&E Target (Francis Report, 2013; NAO report, 2013; Health Select Committee, 2013) Healthcare / UK — Matched pair #1: time-proxy KPI vs outcome KPI, same task Patients warehoused in ambulances to stop the 4-hour clock before formal admission. Nursing staff diverted from care to clock management. Francis Report documented patient harm caused directly by gaming the time-based KPI. Same mechanism as AHT: time proxy misaligned behaviour from the intended outcome. NHS moved to patient outcome measures (mortality rates, infection rates, patient experience) following Francis Report. Accountability moved from time-based proxy to clinical outcome measures — exactly the KPI change the AI in this dilemma recommends. Load-bearing (Matched pair #1: time proxy → harm → outcome KPI reform; government-audited; peer-reviewed) Wells Fargo cross-sell quota (CFPB/OCC consent order, 2016; Senate testimony 2016; Congressional record) Banking / US — Matched pair #2: activity-proxy KPI vs outcome KPI, same task Cross-sell quota KPI caused agents to open 2 million fraudulent accounts. The KPI measured activity (accounts opened) rather than outcome (customer value created). Agents optimised the activity. $185M fine, 5,300 terminat-ions. Exact same structure: wrong proxy → rational gaming → outcome inversion. OCC and CFPB mandated replacement of activity-based KPIs with customer-outcome measures: account usage, satisfaction, and relationship health. Same KPI change this dilemma's AI recommends: from activity proxy to outcome measure. Load-bearing (Matched pair #2: activity proxy → fraud → outcome KPI mandated; regulatory enforcement; irrefutable record) India IRDAI Insurance Claim Settlement Time KPI (IRDAI Annual Reports 2017–2022; Insurance Regulatory and Development Authority of India) Insurance / India — Non-Western proof IRDAI required companies to report claim settlement time as primary KPI. Insurers optimised: settled small claims fast to improve averages; systematically delayed or disputed large legitimate claims. Time KPI read excellent. Claimant outcomes did not. Same AHT mechanism: time proxy optimised; underlying purpose defeated. IRDAI reformed KPI framework to claim settlement ratio and customer complaint resolution rate. Outcome measures replaced time proxies. Documented in IRDAI regulatory circulars 2019–2022 as explicit response to gaming of the time-based measure. Load-bearing (Non-Western; regulator-documented; direct AHT parallel: time proxy → gaming → outcome reform) Ritz-Carlton service empowerment (Michelli, The New Gold Standard, 2008; Ritz-Carlton Gold Standards) Hospitality / US — Positive control N/A — Ritz-Carlton removed time-based service KPIs before their documented success period. They did not freeze the wrong metric. Ritz-Carlton empowered any staff member to spend up to $2,000 to resolve a customer complaint without approval — removing call-time constraints entirely. Documented improvement in NPS and repeat booking rates. Absence of time KPI is explicitly credited in their published service model. Supporting (positive control: outcome-over-time policy; documented; recognised globally) Barclays Premier Banking AHT to NPS migration (2014–2016; Barclays Annual Reports; Customer satisfaction disclosures) Banking / UK — Closest sector parallel Barclays Premier Banking team operating under AHT constraints produced high throughput but moderate NPS. Internal review found time pressure was preventing agents from exploring underlying customer needs in complex queries. Barclays migrated Premier Banking team from AHT to Net Promoter Score as primary KPI. Documented NPS improvement within 6 months. AHT naturally settled at a new level without being targeted. AHT fell as a consequence of better resolution, not as a target. Load-bearing (Direct sector parallel: banking customer service; AHT to outcome migration; documented outcome) Google People Operations performance measurement (Bock, Work Rules!, 2015; Google re:Work publications) Tech / US — Positive control N/A — Google never used raw activity-proxy KPIs as primary performance measures for customer-facing or technical teams. Google built performance measurement around outcome proxies (OKRs: Objectives and Key Results) not activity proxies. The purpose of OKRs is explicitly to keep the measure pointed at the outcome, not the activity. View B's equivalent — 'keep measuring the activity because we always have' — is specifically what Google's framework was designed to avoid. Supporting (structural contrast: outcome-oriented KPI design; Bex's own territory inverted) The Four Strongest Objections to View A — Closed'Ten years of AHT data will be lost'Factually incorrect. Historical AHT data is preserved. It remains in the data warehouse for trend analysis, benchmarking, and research. What changes is whether AHT drives executive incentives and agent coaching going forward. The CHANGE framework's H gate (Hold dual metrics) maintains AHT reporting for six months alongside FCR — creating a bridge period during which historical comparisons remain valid. You do not lose the data. You stop letting the data make your decisions. 'Executive incentives are built around AHT — changing the KPI disrupts governance'This is the argument for change, not against it. Executives incentivised on AHT have a documented financial interest in not finding that AHT has been driving the wrong behaviour for a decade. That resistance is not a measurement science argument. It is institutional self-interest in a finding that challenges a decade of decisions. The correct response to 'executives are incentivised on the wrong KPI' is not to preserve the wrong KPI. It is to change the incentive structure — which the CHANGE framework does gradually, in governed stages. 'Changing KPIs makes performance difficult to compare over time'Conceded: raw AHT scores and raw FCR scores cannot be directly compared without a bridge. The CHANGE framework's G gate (Govern the bridge) maintains a conversion methodology for 12 months that preserves longitudinal analysis. More importantly: the correct comparison is not AHT in 2024 vs. AHT in 2014. It is customer loyalty in 2024 vs. customer loyalty in 2014. The AI's finding shows that AHT comparability has been preserving a measure that was systematically diverging from the outcomes it was meant to represent. Consistency in the wrong measurement is not better than accuracy in the right one. 'The AI might be wrong — the finding might be spurious'The CHANGE framework's C gate (Confirm the finding) addresses this directly: independent audit of the AI's methodology before any transition begins, manual review of sample interactions, and confound testing for agent tenure, channel type, and case complexity. If the finding does not survive independent validation, the process stops. The burden of proof works in both directions: the AI has analysed thousands of interactions and found a consistent pattern across three independent outcome measures. The burden for ignoring that evidence is now higher than the burden for acting on it — especially given that the cost of a 6-month dual-metric validation period is bounded and reversible, while the cost of another year in the Metric Trap is not. A Deployable Answer: The CHANGE FrameworkThe dilemma presents a false binary: change the KPI immediately or keep it unchanged. The correct answer is governed transition — capturing the AI's finding in live operation while managing the institutional disruption View B correctly identifies. Six gates, each closing one specific objection: Diagram 3 — The CHANGE Framework: Confirm, Hold dual metrics, Align incentives, Notify and train, Govern the bridge, Evaluate the outcome. The Canary KPI — repeat call rate — validates the AI's finding in live operation before the full transition completes. THE CHANGE FRAMEWORK DOES NOT DISCARD GOVERNANCE. IT REDIRECTS IT. The H gate (Hold dual metrics) preserves every governance obligation View B cares about — historical comparability, executive reporting, performance management continuity — for the full transition period. CHANGE does not eliminate AHT reporting. It removes AHT from the position of primary driver while the evidence base for its replacement is validated in live operation. An organisation running CHANGE maintains full measurement continuity and acquires the evidence it needs to make the transition with confidence, rather than making a binary choice between a demonstrably wrong KPI and an unvalidated replacement. Where View B Is Genuinely RightView B is correct in one precise territory: when the AI's finding is based on insufficient data, uncontrolled confounds, or a proposed replacement KPI that is itself gameable. If the AI has analysed too few interactions to distinguish signal from noise, or if the FCR and CLV measures it proposes are more easily manipulated than AHT, then View B's caution is warranted. None of those conditions apply in this dilemma. The AI has analysed thousands of interactions. The finding is consistent across three independent outcome measures — repeat calls, customer satisfaction, and three-month operating cost — making a spurious correlation across all three simultaneously unlikely. And FCR and CLV, while not gaming-proof, are harder to game than AHT: an agent cannot fake a customer not calling back within 30 days. The CHANGE framework's C gate provides independent validation before any commitment is made. The Final WordThe NHS 4-Hour Target, Wells Fargo's cross-sell quota, India's IRDAI insurance time-proxy, and Barclays' AHT-to-NPS migration all point to the same institutional lesson: a proxy KPI that decouples from its intended outcome does not self-correct. It embeds — in promotions, in coaching, in management culture — and becomes harder to change with every passing year of continued use. Bex is right that the KPI should change. She is right for the wrong reason. The correct argument is not that changing KPIs produces better morale. It is that AHT has stopped functioning as a KPI. It is no longer measuring what it was designed to measure in a way that aligns behaviour with outcomes. Keeping it is not a measurement decision. It is a political decision — dressed in the language of governance. View B cannot tell you whether a low AHT score means the agent resolved the customer's problem or simply ended the call. It has decided not to ask — and called that indifference governance. A KPI that misaligns behaviour is not performing its function. Keeping it is not governance. It is the governance of the wrong thing. View A. Without qualification.
- Last week
-
Jaswant_Kumar_nB8z replied to Vishwadeep Khatri's topic in We ask and you answer! The best answer wins!View A – Change the KPI Organisations traditionally use Average Handling Time (AHT) to measure and optimise the efficiency of customer support interactions. While useful as an operational signal, AHT in isolation consistently produces three damaging outcomes: agents rushing customers, issues left unresolved (hurting First Contact Resolution), and declining CSAT scores. AHT optimises for the speed of an interaction. FCR and CLV shift focus to the value of the outcome — which is far more aligned with what businesses actually care about: retaining customers and growing revenue. First Contact Resolution (FCR) measures whether a customer's issue was fully resolved without a callback. Its advantages are structural: Reduces repeat contacts, lowering costs more sustainably than chasing low AHT Directly tied to customer effort and frustration levels A single FCR failure can generate 2–3 follow-up contacts, wiping out any AHT efficiency gains Customer Lifetime Value (CLV) reframes support from a cost centre into a revenue protection function: Recognises that how a complaint is handled today determines whether that customer stays for five more years Encourages agents to invest appropriate time in high-value customers rather than rushing everyone equally Connects support team performance directly to business growth metrics Over Reliance on AHT has had own issues: 1. BPO Tech Support — The Hidden Cost of "Green" Dashboards A mid-sized BPO with 800 agents consistently hit its 8-minute AHT target. Leadership was thrilled. But the underlying FCR rate was just 61% — nearly 4 in 10 customers were calling back. When repeat contacts were tracked, the true resolution time averaged 23 minutes per customer across multiple interactions. Every individual call hit the target; every bonus was paid; the customer experience was poor and agent morale worse. High-performing agents burned out. Those who stayed were comfortable with mediocrity. 2. Telecom and Tech Support Industries — Systemic Underperformance These sectors, historically most obsessed with AHT reduction, consistently record the lowest FCR and CSAT scores industry-wide. Customer churn is more than five times higher for unresolved calls than when FCR is achieved — and acquiring a new customer costs at least five times more than retaining one. Organisations fixated on AHT were destroying CLV without realising it. 3. Agent Gaming Behaviour Agents learn the rules of any system quickly. Under AHT pressure, they rush calls, transfer problems rather than solve them, and develop what can be described as a "polite ejection" technique — closing interactions without resolution to protect their metrics. Quality teams catch some of this, but rarely at the scale needed. The result is agent interests structurally misaligned with customer outcomes. 4. The False Economy of Low AHT US businesses lose an estimated $62 billion annually from poor customer experiences, and 50% of consumers will switch to a competitor after a single bad interaction. Organisations that chased low AHT while ignoring FCR generated these costs invisibly. The efficiency metric looked green; the business was bleeding customers. The bottom line: Optimising a proxy metric (speed) while ignoring the outcome metric (resolution quality) creates organisations that look efficient on paper while systematically destroying customer loyalty. There have been organisations who have a shift in their traditional metrics and have had wonderful returns. 1. Zappos — Building an Entire Business on CLV Zappos deliberately rejected AHT thinking from the outset. Agents have no time limits on calls, can make decisions without supervisor approval, and are empowered to resolve issues completely. The outcome: repeat customers account for approximately 75% of revenue. The company crossed $1 billion in gross sales in 2008 and was acquired by Amazon in 2009 for $1.2 billion. The investment in resolution quality compounded directly into customer loyalty and revenue growth. 2. T-Mobile — The "Un-carrier" Transformation In a sector historically obsessed with operational efficiency metrics, T-Mobile's 2013 "Un-carrier" revolution centred on removing customer pain points rather than minimising call times. The results were measurable and sustained: postpaid phone churn of 0.86% in 2024 — the best full-year figure in the company's history — alongside its third consecutive year of more than 3 million net postpaid phone additions and highest-ever earnings per share. During the same period, Verizon reported a net loss of 9,000 postpaid subscribers. The difference was not network quality alone; it was a fundamentally different philosophy about what customer interactions are for. 3. Canadian Tire — "Customers for Life" Canadian Tire embedded FCR and CSAT as the twin accountability metrics for every frontline agent. IVR pre-authentication means agents begin calls already knowing who the customer is, enabling immediate focus on resolution rather than verification. The cultural alignment — every agent explicitly connected to a "Customers for Life" mission — produced world-class FCR performance sustained over multiple years. 4. Free Mobile (France) — Disrupting Through Customer Value Free Mobile eliminated contracts and hidden fees, creating a transparent value proposition that competitors could not easily replicate. The result: 12 million new subscribers and an 18% share of the French mobile market. NPS improved not by adding features, but by removing the structural causes of customer detraction — exactly the mindset that FCR and CLV measurement encourages. 5. The Quantified Business Case The evidence across organisations is consistent: PwC: Companies with strong FCR performance see 12–15% higher retention and 8–10% increases in lifetime value Forrester: Each 1% FCR improvement saves enterprises approximately $276,000 annually in service costs SQM Group: Every 1% FCR improvement produces a 1% improvement in CSAT For every 1% FCR improvement, NPS rises by 1.4 points Zendesk: Agents in high-FCR environments report 23% higher job satisfaction Organisations that stopped treating support as a cost to be minimised and started treating every interaction as a moment that either builds or erodes customer lifetime value saw compounding returns: lower churn, higher NPS, lower actual cost-to-serve, and sustainable revenue growth. Changing a decade-old primary KPI is not a dashboard update. It is a cultural and commercial transformation. The following structured approach protects the organisation through the change. 1. Retire AHT Gradually — Never Cold Turkey Demote AHT from a performance metric to a diagnostic tool. Keep it visible on dashboards, but remove it from bonuses and performance reviews. Run a parallel measurement period of 6–12 months where AHT, FCR, and CLV are all tracked before any incentive structures change. This gives leadership evidence that the new metrics move in the right direction before political capital is spent dismantling the old system. 2. Rebuild Executive Incentives Before Announcing the Change Executives whose bonuses are tied to AHT targets will — consciously or not — resist the transition. This is organisational reality, not cynicism. Before any public announcement, conduct a quiet audit of every incentive structure that references AHT. Work with HR and the Board to redesign executive scorecards so FCR, CSAT, CLV, and NPS carry equal or greater weight. Agree on a grace period — typically 12 months — with blended weighting (e.g., 60% legacy metrics / 40% new metrics, shifting each quarter). Without this, executives will publicly endorse the new direction while privately protecting the old one. 3. Protect Historical Comparability A decade of AHT data has genuine operational value for capacity planning, workforce management, and trend analysis. Retain AHT as a shadow metric in the data warehouse for at least 3 years post-transition. When presenting FCR and CLV data to the Board in the first two years, always contextualise against historical AHT benchmarks. Build a crosswalk document showing how the new metrics relate to old AHT numbers across the same customer segments — this prevents "we can't compare anything anymore" paralysis at leadership level. 4. Redefine "Good" Before Launch Without a shared, precise definition of "resolved," FCR scores will be manipulated within months. Develop specific, observable FCR definitions before launch that mean the same thing across every team, channel, and manager. Build agent-level dashboards displaying FCR, repeat contact rates, and CSAT in real time — replicating the instant feedback loop agents had with AHT. Run co-design workshops with frontline agents and team leaders to define what a successful interaction looks and sounds like. Agents who help shape the new standard are substantially more likely to embrace it. 5. Recalibrate Workforce Management Immediately Virtually all contact centre workforce management (WFM) systems use AHT as an input to staffing forecasts. Before the transition, work with the WFM team to recalibrate models using actual handle time distributions rather than targets, alongside FCR data. Plan explicitly for handle times to increase in the short term as agents stop rushing calls — and build this into headcount planning for the first 6 months. Brief the CFO in advance: the temporary cost of longer calls will be offset by reduced repeat contact volume, but only if this dynamic is understood before the next budget cycle. 6. Manage the Board and Investor Narrative Proactively Frame the KPI change as measurement maturation — a strategic evolution — not a correction of past error. Prepare a narrative document for the Board that positions the shift as forward-looking, anchored to commercial outcomes they already care about: churn reduction, revenue retention, NPS improvement. Provide 12–18 months of retrospective FCR and CLV data alongside the announcement to demonstrate what the new metrics would have shown historically. This prevents the Board from feeling they are flying blind into unfamiliar territory. 7. Build Measurement Infrastructure Before Setting Targets FCR and CLV are significantly harder to measure accurately than AHT. Before announcing new targets, audit CRM and telephony infrastructure to confirm the ability to track repeat contacts within a defined window — industry standard is 7 days — for the same issue from the same customer. For CLV, ensure customer data is connected across support, billing, and commercial systems. A CLV metric that cannot be trusted destroys the credibility of the entire transition. Budget for data infrastructure investment upfront. Organisations that announce new metrics before the measurement capability exists create a 6–12 month credibility gap that is very difficult to recover from. The purpose of a KPI is to improve business outcomes — not to preserve historical reporting. When evidence conclusively demonstrates that a metric is driving the wrong behaviour, maintaining it for consistency is not governance. It is inertia. The organisations that successfully made this transition did not treat it as a KPI swap. They treated it as a strategic repositioning of what customer support is for — shifting from a function that minimises cost per call to one that maximises the value of every customer relationship.
-
Change the KPI There’s a type of Organizational Quicksand where you’re just in there for so long and are consistently measuring the wrong things that it makes them somehow feel legit to you. Dashboards are built around it. Careers are shaped by it. Incentive structures assume it. And then one day, a system with no political stake in the outcome looks at the data and tells you plainly — this metric is not pointing where you think it is. That is not a threat to governance. That is governance working. In the logistics scenario described, the AI has done exactly what a rigorous performance review should do — it has traced the relationship between the metric being optimized and the outcomes the business actually cares about. It found a disconnect. The organization's response to that finding will define whether it is data-driven in practice or only in language. The Purpose of a KPI Is the Outcome, Not the Metric This is the foundational point that often gets lost in debates about measurement consistency. A KPI is not the goal. It is a proxy for the goal. Average Handling Time was adopted because, at the time, there was a reasonable assumption that faster resolution correlated with better service and lower cost. That assumption may have been valid a decade ago. The AI is now showing — with thousands of data points — that it no longer holds, if it ever fully did. Clinging to a KPI because it has been used for ten years is not strategic consistency. It is metric inertia dressed up as governance. The real governance failure would be knowing the KPI is driving suboptimal behavior and choosing not to act. What the Data Is Actually Saying? The pattern the AI identified is well-supported by service operations research. Agents optimizing for low AHT are incentivized to close calls quickly — not resolve them thoroughly.That sets up what experts call "the callback loop," wherein frustrated customers with quickly fixed, yet fundamentally unresolved, problems call back, wait, burden agents, and hang up more unsatisfied than when they started. But as the AI saw, agents who spent a little more time on customer calls not only made fewer follow-up calls and improved satisfaction ratings, they actually cut costs significantly over a three-month period. That last point is critical. The business was paying for speed and receiving higher total cost. It was measuring efficiency and generating waste. First Contact Resolution (FCR) and Customer Lifetime Value (CLV) are not experimental alternatives — they are widely recognized as more reliable predictors of long-term business health in customer service environments than AHT alone. Real-World Example: T-Mobile's Shift Away From AHT T-Mobile provides one of the clearest documented cases of an organization deliberately moving away from AHT-centric performance management. For years, their customer service operation — like most in the telecoms industry — was structured around call efficiency metrics. The model produced fast calls and frustrated customers. When T-Mobile restructured its support model around "Team of Experts" — small dedicated teams assigned to specific customer segments with no pressure to minimize call length — customer satisfaction scores rose sharply. Repeat contacts fell. And churn, the most expensive outcome in a subscription business, decreased meaningfully. The company did not just change its KPI. It rebuilt its entire service philosophy around what the data said customers actually needed. The business results validated the decision. Real-World Example: Zappos and the Deliberate Rejection of AHT Zappos, long before it became a Harvard Business School case study, made the deliberate choice to remove Average Handling Time from its customer service metrics entirely. Agents were explicitly told not to rush calls. The longest call in Zappos history — over ten hours — became a point of pride, not a performance failure. The outcome was a brand built on customer loyalty so strong it became the company's primary competitive differentiator. Customer lifetime value per loyal Zappos shopper consistently outperformed industry averages. The organization understood something that the logistics scenario now has data to confirm: the cost of a longer call is almost always lower than the cost of a lost customer. Addressing the Disruption Concern The genuine counterargument — that changing KPIs disrupts reporting, comparisons, and management practices — deserves a serious response rather than dismissal. The answer is not to change overnight. It is to transition with structure. A phased approach works as follows: run AHT and the new metrics in parallel for a defined period — 90 to 180 days is typical — so that trend comparisons remain available and teams are not suddenly evaluated against an unfamiliar standard. During this period, communicate the rationale clearly, train managers on interpreting the new metrics, and update dashboards incrementally. This is standard practice in measurement evolution. Every organization that has ever updated its financial reporting framework, changed its customer segmentation model, or shifted its product success metrics has managed this transition. The disruption is real but it is manageable. The cost of continued misalignment is not. The bigger picture: what is AI for “The question to the question: is any enterprise using artificial intelligence on performance and then turning it off because AI came up with inconvenient results. That enterprise has not used the AI.” The value of AI in performance management is precisely its ability to surface what human systems — shaped by habit, incentive, and hierarchy — are unlikely to surface themselves. A finding this clear, backed by this volume of interaction data, is not a recommendation to consider. It is a signal to act on. Conclusion The KPI exists to serve the business. When the data shows it is no longer doing that — when it is actively producing behaviors that increase cost, reduce loyalty, and erode long-term value — the organization has a choice. It can protect the metric or it can protect the mission. T-Mobile chose the mission. Zappos chose the mission. The data in this logistics scenario is pointing in the same direction. Change the KPI. Do it thoughtfully, do it in stages, bring your teams with you — but do it. Because the only thing more disruptive than changing how you measure performance is continuing to measure it wrong.
-
Tech Mahindra is revolutionising its sales strategies through a partnership with AI innovator Perplexity. By integrating Perplexity Enterprise Pro, sales teams will benefit from instant access to accurate, credible insights. This strategic decision is set to enhance customer relationships, increase engagement, and create superior business value with tailored experiences for clients. This collaboration highlights Tech Mahindra's dedication to harnessing AI for enhanced sales productivity and swift digital advancement. View the full article