

Mayank Gupta
Members
-
Joined
-
Last visited
Everything posted by Mayank Gupta
-
Q. 150 Using the Sample Size Calculator for 1 Sample T-Test at https://www.benchmarksixsigma.com/calculators/sample-size-calculator-for-1-sample-t-test, highlight the factors which affect the sample size determination by using some examples. Note for website visitors - Two questions are asked every week on this platform. One on Tuesday and the other on Friday. All questions so far can be seen here - https://www.benchmarksixsigma.com/forum/lean-six-sigma-business-excellence-questions/ Please visit the forum home page at https://www.benchmarksixsigma.com/forum/ to respond to the latest question open till the next Tuesday/ Friday evening as per Indian Standard Time. The best answer is always shown at the top among responses and the author finds honorable mention in our Business Excellence dictionary at https://www.benchmarksixsigma.com/forum/business-excellence-dictionary-glossary/ along with the related term.
-
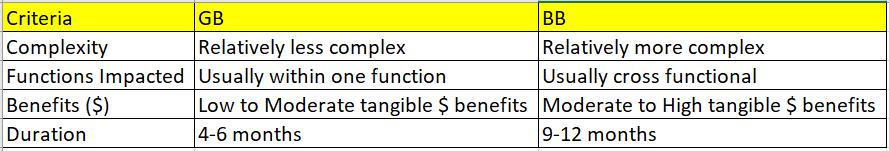
Hi Abhay A very interesting question. I will start off by stating that there is nothing specifically known as a MBB project. Usually the projects are classified into GB or BB (in some organizations you may find a YB project as well, which basically means a small improvement project which usually does not have any tangible benefits). The difference between GB and BB projects can best be understood by evaluating the project on following parameters The above differentiation is not something cast in stone. It is only indicative. Organizations with matured lean six sigma implementation have their own criteria for decisions Hope this helps.
-
Hi Dipali Lean Six Sigma training is one training that will help you in topics related to project management and quality improvements. Lean Six Sigma is independent of industry i.e. its tools and techniques can be applied in any industry (including plastics) for reducing defects. Hope this helps.
-
Hi Rowena Gage R&R is a tool used whenever the metric is continuous and this tool helps in determining the extent of measurement system variation in the overall observed variation. Typically the survey responses are not continuous. And, it will be difficult to check for repeatability and reproducibility in a survey response as we do not expect the same response from all customers. Generally, there are other methods to check for the correctness of the survey questions like the questions should not be leading, the questions should be relevant to the product / service being offered etc. Thank you
-
Hi Rahul Both HR and FCR could be CTQs. Project should be picked on the CTQ that is not meeting the target value. You could start the project on HR. And if FCR is an input to HR calculation, then you will have to improve FCR as well (as a part of the project) Hope this helps.
-
-
A thought provoking question which challenges conventinal wisdom. Best answer is provided by Prashanth Datta as he clearly highlights two situations where either the process or the inputs are below industry standard while the other helps achieve excellent results. Answers from Vastupal and Mathi are also good reads.
-
Hi Sarita A very important question which every Green Belt certified professional asks. The next course is Six Sigma Black Belt. you could also pursue Lean certifications.
-
Hi Shuriti Six Sigma Green Belt certification is a stepping stone for business excellence professional. Green belt certification will equip you with tools that will help you solve problems. Please refer to the below link to get more information https://www.benchmarksixsigma.com/public-programs/lean-six-sigma-green-belt/
-
Hi Pushpaj Basis the details that you have provided, you seem to be on the right track. You should get the project charter signed off (if not already done). Complete the Define phase deliverables and then move on to the Measure phase. Follow the steps in each phase and you should get your answer on what tools you need to use.
-
BHAG - as the name suggests, is an audacious goal for an organization whereas goals should be SMART. BHAG differs from SMART in terms of A and R i.e. Achievable and Relevant. BHAG will be Specific so that it is understood by all in the organization, Measurable so that the organization can validate whether it has met it or not and Timebound (say in another 10 years). However, it might not seem to be Achievable to some, even though the organization strongly believes otherwise. At times, it might also be irrelevant simply because it is audacious or if it something that changes the industry landscape. Answer provided by Venugopal Sudheendra highlights these aspects in the answer and hence has been selected as the best answer.
-
This question makes certain known things obvious. We all know about process and their requirements. However, only a very few realize that some processes and requirements are 'Special'. The best answer to this question is provided by Manjeet Sachdeva for explaining the terms and also providing relevant examples.
-
Blockchain is the new technology kid on the block To understand what Blockchain is, let us understand its components 1. Encryption using cryptography: It is like lock and key. You lock the code using a particular combination. Anyone who knows the combination will be able to open the lock. This is how encryption works. In technical terms, it is called a key. There are two forms of keys - private and public. Private key is private while public key is the one which is available to all. In blockchain the public and private keys combine to form a Digital Signature. This provides strong control to the owner of the key 2. Distributed Network: Imagine two people doing a financial transaction using encryption. Only these two people will have the details of the transaction. In case of fraud or a dispute, there is no independent authority to decide who is right and who is wrong. In blockchain the details of the transactions are made visible to validators who are witness to the transaction. They approve and record the transaction using mathematical validations. The distributed network itself is the approving authority. Key details recorded in a block are the amount transacted, timestamp and the digital signature 3. Linking of the blocks: It is like building a chain. All the blocks in a chain are interconnected to each other using a cryptographic key. The linking of the blocks is done for safety requirements so that no one person can change the contents of the block. Even if a hacker wants to change the contents (in one block), he will have to make changes to all the following blocks, else the chain will break. The linking process is called mining, where unique cryptographic keys are identified to link the blocks. The unique cryptographic keys ensure that one block is not used again for another transaction thereby giving it a unique status Using the above three components, blockchain offers the following advantages 1. High level of security 2. Open and distributed network 3. Decentralization 4. Low maintenance cost 5. Round the clock availability Owing to the above benefits, blockchain is touted as the next BIG thing in banking and financial industry. Some of the common challenges which blockchain will address for banks are 1. Banks spend a lot of money in securing our transactions (but we still get to hear that some bank's databases were hacked) 2. Money transfer from one region to another is time consuming and involves a lot of middlemen (who charge a fees for their services). It is for this reason that money transfer is not free 3. Centralized server space for transaction data storage 4. Banking services are not available round the clock 5. Reconciliations to validate the numerous transactions taking place on a daily basis All leading banks (Bank of America, Goldman Sachs, JP Morgan Chase to name a few) across the globe are aggressively looking at using blockchain technology for their services and are also investing in new tech startups working on blockchain technology
-
Hi Naresh - Good perspective on change management. One of the main reasons for Change Management being considered as an 'Unholy Nexus' is the fact that EVERYONE is not involved in the decision making which seems obvious. The downside is that everyone wants to be a part of the decision making process as it is considered as a matter of pride. Whoever is left out of the process feels he has been wronged and develops a revengeful state of mind. The second reason is - Few Take Decision but Many Get Impacted. E.g. Government decides to increase the tax (i know I'm taking a very sensitive subject :)). Very few people take this decision as compared to the larger audience that gets impacted by it. Most of the times, the audience does not know why taxes were increased. What they realize is ONLY the additional burden on them i.e. they don't see the big picture (I'm assuming there is one). This is the third reason Resistance to change is inherent in humans. For each task (even the smallest or the most mundane of tasks) our brain wires itself in a particular way. Any change, forces it to re-wire itself which is not always an easy task. And hence the stout resistance. Re-wiring would mean you need to put in extra effort to practice the change. We all want to avoid it. A good change manager pre-empts such challenges early and takes necessary steps to avoid them.
-
Both Gemba and MBWA allow leadership face time on the shop floor, however both are different in terms of the approach. Gemba has a very well structured approach that requires planning while MBWA can be done on the fly. Somrita Chatterjee has provided the best answer. She has provided details of the differences in the approach along with an example on how Gemba can help identify opportunities on the shop floor. R Rajesh has also cited an example from service industry highlighting the difference in the two. Khalandar's response is also a good read to understand the 'real issues' on the shop floor.
-
Hi Mohit One should typically be a Black Belt before they can become a trainer for Green Belt. Similarly, one should be an MBB before they can become a trainer for BB. A GB certified person could conduct trainings on Quality induction or 7 QC tools etc. A GB could also co-facilitate a Green Belt session along with a BB or MBB (say cover 1-2 topics) It is always good to have rich hands-on experience with projects before you start conducting trainings.
-
Dear Papi Reddy I understand the conundrum around this as I have been on both sides of the interview table. For me, remembering the formulae for statistical tests (or advanced stats) was and is never a priority. More important is to know the usage, application, limitations of the test and then to be able to make business decisions basis the outcome of the statistical results. Having said that, there are some basic formulae (say for descriptive stats - foundation of statistics) which one is expected to know.
-
This was definitely one of the tougher choices to make, however the response and the arguments provided by R Rajesh makes his answer as the best answer to the debate. There are numerous wonderful examples provided by all the respondents and it was enriching to read through so many view points. Answers provided by Vijay Sardana, Vishnukiran L S, Papi Reddy and Sitaram are a must read.
-
Mayank Gupta replied to Sameer Gulam Taher Shaikh's topic in Applicability in Manufacturing CompaniesDear Sameer Lean Six Sigma implementation has many benefits, cost saving being one of the major benefits. Lean Six Sigma helps us improve any process in following ways (I have also mentioned how each one can contribute to cost savings) 1. Improve efficiency of the process i.e. removal of 7 wastes from the process. Removal of these wastes means that we are incurring less costs in producing the same number of units (or reduction in per unit cost) 2. Improve effectiveness of the process i.e. there are less number of defective products being made which would save costs on rework, warranty and replacement claims and handling customer complaints etc.
-
Who does not like a pat on the back!! We also like it and hence we would like to hear from you. Your positive feedback helps us stay motivated and continue to deliver excellent workshops. Please click on 'Reply to this Topic' and share the comment that you want to be displayed on this forum as your positive feedback? We value your opinion!!!
-
-
Dear Ransingh A very good question and the link shared by VK will help you visualize how CLT works. I want to highlight a common misconception about Central Limit Theorem. It is probably one of the most misunderstood concepts in Lean Six Sigma. Most of the people assume that if they have a large sample size (read greater than 30), then the data set follows normal distribution. This is far from truth. Irrespective of the sample size, the sample will always follow the distribution of the original data set. So if the original data set is Not Normal, then the sample (be it size 1 or 2 or 10 or 30 or 100 or however big) will also be Not Normal. Then where does CLT apply? CLT applies on the distribution of the sample means or sample sums i.e. if i pick up multiple samples from the Not Normal data set, calculate either the sum or the mean of all the samples and plot them on a histogram, then it will follow a Normal distribution. For e.g. consider a roll of a single dice. Possible values are 1,2,3,4,5,6 each having the same probability. A common misconception would be if i roll the dice multiple times (say 6000) times, I will get a normal distribution. This is not true. Roll of a dice follows a Uniform distribution and hence if you roll it 6000 times, it is likely that 1 through 6 will occur 1000 times each. However, what happens if 2 dice are rolled and sum of each roll is noted. The possible values are 2,3,4,5,6,7,8,9,10,11 and 12. Here however the probability is not the same. Prob. of getting 2 = 1/36 (only 1 combination will give 2) Prob. of getting 3 = 2/36 (2 combinations will give us 3) Prob. of getting 4 = 3/36 (3 combinations will give us 4) and so on...... 7 has the maximum probability (6/36) of occurrence while 2 and 12 have the least (1/36). Now, if I roll the 2 dice for 6000 times and plot the sums of each roll on a histogram, the plot will start resembling a normal distribution because of the variation in the probabilities of each number. Here if you notice closely, 1. The original distribution is Not Normal 2. Taking 2 data points from the original data set will give me a sample (equivalent to rolling of 2 dice). Then for each sample, the sum is being calculated and plotted 3. CLT is being applied on the sum and not on the individual data points The same is evident in the animation link shared by VK. So let's be aware of the misuse of this theorem and apply it correctly. P.S. there are multiple online sources where you can also find the mathematical proof of the the Central Limit Theorem.
-
Hi Prakash Please review the formula for Cp and Cpk calculations (covered in GB session). From the data, you will calculate mean and standard deviation. In addition to the data, you will need the specification limits. Thank you!
-
Dear Prakash How are weekly quality scores calculated? Provide information on what goes into the Numerator and Denominator. In my understanding the quality metric (for a KPO industry) is usually Discrete in nature. That means we either calculate defectives or defects. Secondly how is your quality metric being reported out (Defective % or DPU or DPMO). Once you have the answer to these, you can use the Sigma Calculator (shared during the GB session) for Discrete Data and get the Z values. We don't use Median for Sigma calculation. Instead we use Mean. Mean, Standard Deviation and Specification Limits (LSL and/or USL) are used in case we have continuous data (something that is measured like time, length etc.). In some organizations, quality % is considered as continuous. If that is the case, then your approach can be used. Use the mean quality score for last week, standard deviation in quality scores for last week and LSL as 98% (in quality metric, we usually have a LSL or a minimum quality as USL is 100%). Glad that you are implementing the learning. Good luck with publishing the Z scores.
-
