

Mayank Gupta
Members
-
Joined
-
Last visited
Everything posted by Mayank Gupta
-
-
-
Instruction Creep is a phenomenon that plagues not just the SOPs but every situation where a set of instructions has to be followed. Most recent example could be the COVID-19 guidelines and instructions by the Central government that all states and district administrations must follow. The volume of these instructions is humongous and hence the administrators have a tough time understanding and following them. The best answer to this question has been provided by Ram Kumar Chaudhary. Ajay Sharma's answer is also worth a read as he has highlighted the KISS principle. Also review the answer provided by Mr Venugopal R, Benchmark Six Sigma's in-house expert.
-
All published answers are correct and great. There are 4 winners for this question - Shashikant Adlakha, Satyajit Das, Senthilkumar G and Mala Pulickel for clearly highlighting how reporting bias should be avoided. Also review the answer provided by Mr Venugopal R, Benchmark Six Sigma's in-house expert.
-
Best answer has been provided by Shashikant Adlakha as he has explained the Ansoff Matrix along with an application. Do read the answer by Dr. Arvind Khanijo as he has elaborated how Ansoff Matrix can be used for a hospital. Also review the answer provided by Mr Venugopal R, Benchmark Six Sigma's in-house expert.
-
-
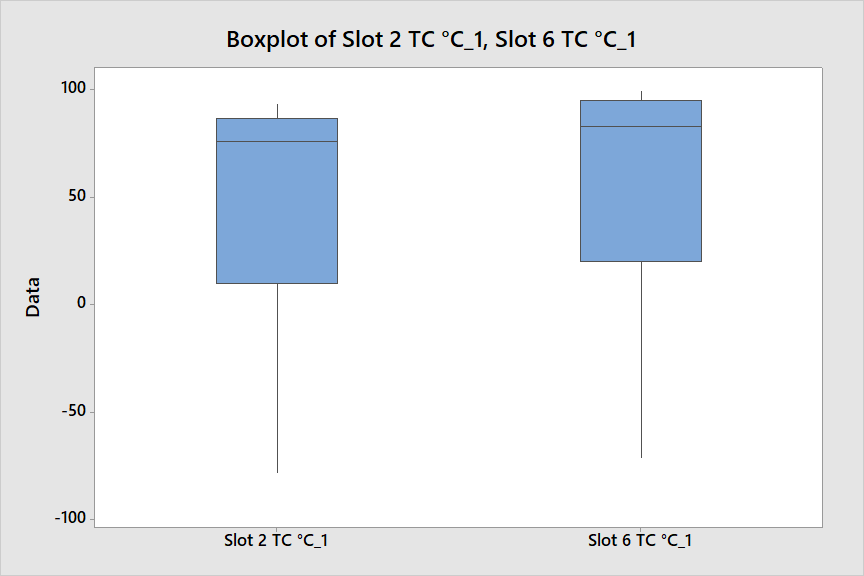
Hello Looking at the box plots, one will conclude that the temperature of both slots is similar. I will not be able to comment on whether these temperatures are acceptable or not as I do not know about the particular process.
-
Hello Looking at the data and the requirements, below is my recommendation 1. Your data shows temperature can go below -75C and also above 85C. This is evident from both the raw data file and also the specific data that you used for box plot 2. Your lean expert is right, box plot can help you check the performance and basis the analysis for Slot 2 and Slot 3 show a similar trend. Refer the diagram below
-
Hello Could you please share your data basis which the box plots were crunched? Also, what is the purpose of the study? Why are you using a box plot?
-
-
-
Shashikant's answer has been selected as the best answer for highlighting the responsibilities of employees and what their actions should be during a crisis situation
-
This zip file contains the Minitab installation files for both Windows and MacOS. You are requested to download and first read the text file "READ ME FIRST" for instructions. Then install Minitab in the laptop you will be using throughout the training. Note: It's important to install the correct version of Minitab before the training to avoid any delay during the sessions
-
This is the Pre-Course study material for Lean Six Sigma Black Belt Training. Note: It is important to read this material before the training, as there will be a Quiz based on the pre-course material on the 1st day of the training.
-
This zip file contains the Minitab installation files for both Windows and MacOS. You are requested to download and first read the text file "READ ME FIRST" for instructions. Then install Minitab in the laptop you will be using throughout the training. Note: It's important to install the correct version of Minitab before the training to avoid any delay during the sessions
-
This is the Pre-Course study material for Lean Six Sigma Green Belt Training. Note: It is important to read this material before the training, as there will be a Quiz based on the pre-course material on the 1st day of the training.
-
Mayank Gupta replied to Varad's topic in Discussions related to Green Belt, Black Belt, Lean Practitioner & Lean GuideHello Varad Could you elaborate more on the following 1. What is the nature of the interactions? 2. How are you calculating the DPMO - is it for each interaction? of for a sample of interactions? You may like to use our DPMO calculator for ease of usage. Link as below https://www.benchmarksixsigma.com/calculators/sigma-level-calculator-discrete-data-defects/
-
Hello Ransingh Both Type I (alpha) and Type II (Beta) errors may be critical. However, mostly we are interested in knowing whether the process has changed or not. Hence we look at the p-value and then compare it with alpha. Reason is because alpha error is the threshold for deciding whether the sample data is coming from the same population or from a different population. If the p-value (calculated) is more than alpha, we go conservative and conclude that the sample data is coming from the same population, whereas whenever p-value is less than alpha, we conclude that there is reasonable confidence that the sample is from a different population. Type II (Beta) error plays a significant role in deciding the sample size for hypothesis testing. And therefore, we first decide the minimum sample size and then carry out the hypothesis testing. The above is the traditional knowledge, however there are instances where we are interested in process not changing at all. In such cases, the Null and Alternate hypothesis are interchanged (a word of caution - not the usual practice except for in some industries). With the Null and Alternate hypothesis changed, alpha effectively becomes beta error and vice versa. E.g. Checking for bio-equivalence in pharma industry. Refer the below links for more clarity 1. https://www.benchmarksixsigma.com/forum/topic/34918-type-i-error-type-ii-error/ 2. https://www.benchmarksixsigma.com/forum/topic/35850-test-of-equivalence/
-
-
All correct answers have been published. Best answer has been provided by Dr. Shashikant Adlakha for first explaining the concept of OEE, detailing the 6 big losses and finally highlighting the ways to avoid these losses. Please go through the answer by Benchmark Expert- Mr. Venugopal as well.
-
Hello Palaniappan Measurement system can be classified into the following depending on how the data is being collected 1. Automated system for collecting data 2. Operator using a gauge to collect data (Continuous data) 3. Only Operator collecting data (Discrete data) Hope this helps.
-
All answers are correct. Mohamed Asif's answer has been selected as the best as he provided inputs on specific tools that are used for Fraud Prevention and Detection
-
Hello Marcel You may like to go through the below link to get some clarity on Discrete vs Continuous Data https://www.benchmarksixsigma.com/forum/topic/34894-continuous-data-attribute-data/#comment-44200 Hope this helps.
-
-
Dear Manoj Times of India might have removed the page. You may read more about the incident at the below link https://www.rediff.com/sports/report/f1-red-bull-change-pitstop-procedures-formula-one/20130714.htm
