
Topics
-
The latest setback has fueled worries that Google was losing momentum just as OpenAI and Anthropic and a host of Chinese rivals have accelerated the pace of model releases. On the call on Wednesday, Pichai struck an unusually defensive tone as analysts pressed him on the state of Google's frontier models and whether they could still compete at the cutting edge of AI development. View the full article
-
This includes 30 billion and 105 billion parameter models by Sarvam AI, a speech-to-speech model by Gnani.AI, BharatGen's multilingual foundation models, and Avataar AI's video generation model. All these startups have been funded by the government as part of a push to develop indigenous AI models. Of the 20 models, five have been released so far. View the full article


Leaderboard
-
Mayank Gupta
Members2Points679Posts -
VVK
Members1Points15Posts -
Meenakshi Balaji Iyer
Members1Points11Posts -
Vishwadeep Khatri
Administrators1Points6,717Posts


Popular Content
Showing content with the highest reputation on 09/21/2021 in all areas
-
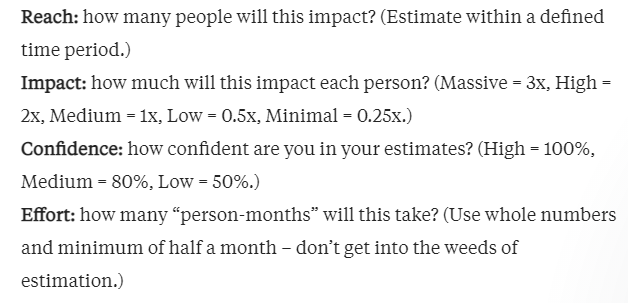
1 pointQ 403. What is an Escape Point? Elaborate on how it can be used effectively in a DMAIC project? Note for website visitors - Two questions are asked every week on this platform. One on Tuesday and the other on Friday. All questions so far can be seen here - https://www.benchmarksixsigma.com/forum/lean-six-sigma-business-excellence-questions/ Please visit the forum home page at https://www.benchmarksixsigma.com/forum/ to respond to the latest question open till the next Tuesday/ Friday evening 5 PM as per Indian Standard Time. Questions launched on Tuesdays are open till Friday and questions launched on Friday are open till Tuesday. When you respond to this question, your answer will not be visible till it is reviewed. Only non-plagiarised (plagiarism below 5-10%) responses will be approved. If you have doubts about plagiarism, please check your answer with a plagiarism checker tool like https://smallseotools.com/plagiarism-checker/ before submitting. The best answer is always shown at the top among responses and the author finds honorable mention in our Business Excellence dictionary at https://www.benchmarksixsigma.com/forum/business-excellence-dictionary-glossary/ along with the related term1 point
-
1 pointAll the published answers are correct. The best answer has been provided by Mokshesh for elaborating the RICE scoring method in a step by step manner. Answers from Johanan (for an alternative method to read RICE score) and Meenakshi (for names of other prioritization techniques) are a must read.1 point
-
1 pointProduct development involves many features / Creative solutions / recommendations as outcome of the development exercise. The project manager need to decide the best fit outcome to be used in the product. There are many prioritization framework used by the product manager like a) CoD(The cost of delay): used in Scaled agile framework(SAFe) delivering most value outcome first b) Kano Model: It indicates customer satisfaction (Delighter, Satisfactory, Neutral, Dis-satisfied) c) MoSCoW Method: (Most have, Should have, Could have, Will have0 requirement of the outcome d) Product tree: Branches are basic requirement product and Roots are to support the requirement, Leaves are new ideas e) RICE: Score basis Reach (# customer benefited), Impact(Quantifiable impact on customer),Confidence(Value to customer),Effort(Resource needed to complete the development) f) Benefit vs effort: Compares value of the outcome with the effort taken and select high value less effort and so on…in descending order g) Weighted shortest job first (WSJF) a SAFe technique How to prioritize? a) Identify common criteria, basic requirement b) Apply trial and error for selection c) Strategic decision with minimum biases to avoid paralysis of analysis What is RICE? The RICE indicates 4 factors used to evaluate the ideas in product development. They are REACH, IMPACT, CONFIDENCE, EFFORT Reach is measured as Count of people or initiative or event for a time E.g. Transaction per month, Client per quarter, calls per day, development per period Impact is measurement of the improvement and quantify the same E.g. High/Medium/Low as 5/3/2, 50% reduction, 10% increase Confidence is measured in %. The high the confidence % the more the control of the project E.g. 100% = High, 50% = Low Effort is measured as score for work done per person per month. If more effort, it is unhealthy, Less effort score the project is in better shape E.g. Reach(R) x Impact(I) x Confidence(C) = RICE SCORE Effort(E) RICE is benefited way of prioritization because: RICE is very effective and shows more comprehensive results RICE is based on actual data RICE also has a factor to measure the value to the customer RICE build scalability However, Rice is well disciplined , Data driven and time consuming1 point
-
1 pointRICE Scoring Framework Why Prioritization framework: For a product manager, at any given time, product backlogs are always highly populated with new product ideas, extensions, suggestions, requests, demands etc. But resources are always limited and product team can work only few initiatives simultaneously. Team cannot choose items on random basis or cannot prioritize the demands of the strongest voice of the team or most vocal customer. Product managers prioritize the projects that support the product vision and most strategically beneficial initiatives for the organization. RICE Scoring model for prioritization: RICE is a prioritization framework approaches quantitative measure and designed to help product development teams to determine which products, features, and other initiatives to put on their product roadmaps by scoring these features and initiatives according to four factors. These factors are Reach, Impact, Confidence, Effort (RICE). RICE scoring model can offer product team below benefits: i) Enables product managers to make better informed decision. ii) Eliminates or minimize personal bias in decision making, iii) Help them to defend their priorities to other stockholders for example the executive staffs. History of the RICE scoring model: Intercom, a renowned Software development company has developed and formulated the RICE roadmap prioritization model to improve their own decision process. The RICE score formula applied consistently across even the most disparate types of ideas, giving the team an objective way to determine which initiatives to prioritize on their product roadmap. Working model of RICE scoring: The completive product ideas such as New product, Product extensions, new right features etc. are evaluated by RICE model by scoring them according to RICE formula given below: Reach: Reach represents the number of users or paying customers that would be directly affected by this feature during a set of period of time over which want to measure month/quarter. Such as, customer per month, Transaction per month, actions per month, free trail signups or how many existing users try new features. For Example: if project estimates to deliver 1200 new prospects to download to trial download page within next month and that 30% of those prospects will sign up the Reach score is 360. Impact: Impact is defined by the overall contribution of a certain feature or initiative to product, reflected by the benefit users will get from the said feature or initiatives. This reflects how many new conversions of project will result in, when users encounter it or a more qualitative objective for example customer delight. Impact scale involves on estimation. So, Necessary questions to ask- Will this feature improve conversion rate? Will it help retain users? Does it improve the ease of use significantly? Impact is difficult to measure precisely. So, Intercom developed five tiered scoring system for estimating project impact. 3 for “MASSIVE” impact, 2 for “HIGH”, 1 for “MEDIUM”, 0.5 is for “LOW”, and 0.25 is for” MINIMUL” For Example: For each user who see this will have a huge impact. The impact score is 3. Confidence: The metric accounts for the confidence our product team have in the estimations they made. RICE helps control projects in which team has data to support one factor of score but relying more on intuition for other factor. The Reach score having data but impact score represents more anecdotal evidence. Questions to be asked: How extensively can data support our estimates? For Example, Confidence score is measured for a given project, Options are 100% for “HIGH”, 80% for “MEDIUM”, 50% for “LOW” confidence. Effort: Effort represents the amount of work that are required from product team to build a feature or finish a project. RICE as a cost benefit analysis, the other three components are benefits while effort that represent costs, Value types are, Person- Months, Project – Hours etc. Questions to ask: How much time will a feature require from all our team members? To finish onboarding example Planning this projects with several weeks with at least 6 persons one month of design time roughly 186 days. For Example: New On Boarding flow project, Reach = 2000, Impact =10, Confidence = 90%, effort: 186 days For this example, RICE Score = (Reach x Impact x Confidence) / Effort = (2000x10x90%)/ 186 = 96.77. The product team select the best score among all RICE scores. Conclusion: The RICE is a popular framework for product management team enabling confidence to prioritize strategically most impactful, beneficial features and initiatives. Also, RICE helps team quickly create a consistent prioritization framework to ship better products to stay competitive in the market.
 1 point
 -
1 pointRICE The Rice scoring system is a prioritization framework that uses four factors viz, Reach Impact, Confidence and Effort to arrive at a decision. Being a quantitative prioritization technique, it relies more on data and removes the subjective and feeling aspects of decision-making. Reach is the number of people the initiative will reach in a given time frame. It is a number that is estimated by the team. An example of reach is “our project is expected to bring in 250 customers in the next month” or “our initiative is expected to bring in 100 customers in the next quarter”. The Reach would be 250 in the first case and 100 in the second case. The Team decides the definition of Reach and the best time frame. For example, Reach could be a number of customer transactions, trial sign-ups, users. The reach should generally use real measurements for the products metrics rather than wild guesses. Impact is more difficult to measure since the project cannot be isolated, hence it would be difficult to ascertain the impact of the project among other reasons and determine the primary reason why a certain action was taken. Intercom had developed a five-tier system to measure impact with 3 being massive impact, 2 high impact, 1 medium impact, 0.5 low impact, and 0.25 minimum impact. Confidence is a balance between data and gut feeling. The team may have data on Reach and a gut feeling about Impact or vice-verse. It is the Confidence score that will draw a balance between the two. Intercom set up a tier set of percentages to mark confidence with 100 percent meaning high confidence, 80% medium, and 50 % low confidence. A confidence score of below 50% is considered bad. Effort in this framework is similar to scoring Reach. It looks at the qualifications and number of people required for the project and is measured by Intercom as Person Months. If a Project takes 5 Person Months, then the Effort score is 5. Intercom takes anything less than a month as 0.5. Say 1 Week of planning, 1-2 Weeks of design, and 2-4 weeks of engineering time will give an effort score of 2 person-months. Putting the four factors together, the RICE formula would be as follows: - RICE = (Reach x Impact x Confidence)/Effort The numerators of the RICE formula viz. Reach, Impact and Confidence are considered as the expected benefits and the denominator viz Effort as the potential Cost. It is hence very similar to a Cost Benefit Analysis. The RICE score is the total impact per time worked. The team needs to do it for each project and compare the numerical values, to prioritize the project. My Thoughts. In a setting similar to Intercom, it would be a consistent framework to help teams objectively evaluate the relative importance of their initiatives. While looking at the score as a whole, the Team would be advised to look at the Numerator (RIC) and the Denominator (E) as two different scores. This would prevent the team from overlooking a good project with high benefit (RIC) just because of the Effort being high. In doing so, the Team can take on projects with low Effort as Kaizen Projects and with low Effort as DMAIC Projects. https://www.productplan.com/glossary/rice-scoring-model/1 point
-
1 pointRICE (Reach, Impact, Confidence and Effort) is a prioritization model used to choose features and initiatives in product development. This models helps us in determining which features should get more weightage and should be worked upon first and which can be left for later. This is done by evaluating each idea by scoring them in the bracket of 4 facets of RICE. Reach: The first criterial of evaluation , as the name suggest itself, is for determining what will be the reach of the idea, feature, initiative. Will this feature get more customers onboard? Will this feature enable more transactions? Your Reach score will be based on the number estimated that a particular idea will bring. So for Example if an idea brings 250 more transactions every month, then reach score will be 250. Impact: Impact scoring depends on the estimation of influence of the idea. for example what impact will the idea have on customer satisfaction index? Generally it is scored as below: 3 = massive impact 2 = high impact 1 = medium impact .5 = low impact .25 = minimal impact Confidence: Confidence score is determined by the level of confidence in idea being successful. Be it implementation, Other scores i.e. Reach or Impact. Availability of data for other factors such as Reach and Impact helps us determining the confidence level as well. 100% = high confidence 80% = medium confidence 50% = low confidence If the idea is having less than 50% confidence then generally it is not worth prioritizing. Effort: Effort score depends on what kind of work is needed to implement the idea. Effort can be different things, it can be cost, can be manhours/Man days/Person - Months required. This is also an important part to prioritize. i.e. if we have an idea in which others scores are very good but efforts needed is very high whereas 1 idea in which very less efforts can bring immediate and moderate benefits. Score can be given accordingly i.e. if an idea is taking 6 persons to complete in 2 month then score can be given as 12. Final score will determine which ideas to prioritize and which to not.1 point
-
1 pointThe RICE scoring mode: Rice is a prioritization framework, Generally used in market research / project / product selection before launch. It's used by project managers to prioritize and make decisions about which product is important and reach quickly with less effort in the market. Prioritization is always a challenging process, hence there are many ways to do prioritization, Rice is one of the methodology to conduct it. It's a framework model to support product managers to conclude and to finalize the products and features. It shall enable product managers to conclude reliable decisions, minimize human biases in decision making, and help them prioritize and present to the leadership team. RICE stands for as below: R - Reach I - Impact C - Confidence E - Effort Reach: How many people we are estimating to REACH out by introducing this initiative / products / service in a given timeframe. We have to decide 2 things: one is how many people will reach out and another one is in what timeframe. The timeframe could be 1 month, 1 quarter or year based on our research scope.The same way the reach is measured for how many new users / number of transactions / free-signup etc. As an example if we assume that there are 600 new users / transactions then our REACH is 600. Impact: It talks about what could be the impact of this new initiative / features, It shall be a quantitative measure. Like how many new conversions will be there when users encounter it. We can also say that How many people who see this initiative / feature will buy the product. It is difficult to measure the impact however we can use some scoring method as below 3 = very high impact 2 = high impact 1 = medium impact .5 = low impact .25 =Very impact Assume that our Impact is high, It means Impact is 2 Confidence: This is one of the quantitative measures in percentage (%), This shall measure the level of confidence of reach and impact. We may use the data for reach from past history / some expert opinion (reliable data) whereas impact is purely gut feel data. Here the confidence component shall nullify the impact error (not reliable data) by providing the right confidence level. The Confidence levels as levelled below. 100% = high confidence 80% = medium confidence 50% = low confidence Assume that if our confidence level is 50% (for one initiative - A) then we have to look into different initiatives, because our confidence level is low. In other hands, If the confidence level is 100% for other initiatives then we are in the right initiatives. Effort: All of the factors we have discussed about Reach, Impact and Confidence represent the potential benefits whereas the Effort is the single score that represents the effort / cost / number of persons required to build it / number of hours required to construct the initiatives or features. It is always good to have less effort / cost to increase the RICE score. It's generally measured in the number of people / months or the work that one team member can do in a month. The quantification of effort is as simple as reach scoring data. We have to simply estimate the total number of persons / resources required to complete the initiative / features in a given period of time. As an example, if we estimate a project that will be completed by three person in a month, our effort score will be 3. Anything less than a month shall be considered as a 0.5. Example: Assume that we have 3 features with respective data for RICE. We can have the highest score among the 3, hence we can prioritize and make decisions on features 3. Limitation: Some stakeholders go through in detail and raise more questions and may not be happy about our assumptions hence better to have fact based data. Sometimes it's difficult to reproduce the same RICE score due to many assumptions and expertise opinion involves. Thanks for reading1 point
-
1 pointThis is a model which is used to prioritize the tasks which helps to prioritize the tasks based of four factors. They are Reach, Impact, Confidence and effort. In this model we give a score to all activities based on the factors which were mentioned above. Why RICE Scoring? 1. This method always works based on the data not emotion and opinions for prioritization. 2. This method can be always used to assess ideas, product and projects as well as enhancements 3. This method always tells you about the different factors which went into market product based on the score. 4. Production team can always re-evaluate the metrics which define their business success. The formula to calculate RICE score is: (REACH*IMPACT*CONFIDENCE)/EFFORT All the four factors (RICE) are explained below: R-Reach: How many people you estimated to reach in a particular time frame. Based on this you can decide that how many customer’s transactions can be reached and how many new or existing customers try your new product or features. Your reach score always depends on your estimation, it means the number you estimated that is your reach score. For example, if you are producing a new product and your expectation is 200 new customers along with 500 from your existing customer base are going to have the product in a quarter/month. Then your reach score will be 700. Impact: The impact of the product or features on individuals/customers. Impact is about how much an idea could impact a particular goal for a customer (once can rate the impact based on rating 3-Very high, 2- High, 1-Medium, 0.5- Low and .025- Minimal impact) Confidence: Confidence score always helps to get an unbiased score which brake offsets overly-optimistic impact score. How sure are you of those four factors you gave each project idea? Identifying and judging the accurate confidence level is really a difficult task so we can set levels. We can consider 100% as high confidence, 80% as medium confidence, 50% is low confidence and anything less than 50% is not sure, it means you have given the score as you have not done any market study or you do not have any historical data as well. Effort: To get the project or product launched and complete/reach the customer’s efforts is always required. Hence, we need to plan for the efforts as well. But, keeping in mind that the product/project move with an appropriate pace and have impact with the least amount of effort, we need to estimate the total amount of time the project require for planning, designing and engineering. Effort can be estimated as man hours, man days or man months To move the project faster and have a good impact with the least amount of effort, estimate the total amount of time a project will require from all members of your team: product, design, and engineering. In case one of your projects can take about one week time for planning and 1 to 2 weeks for designing and 2 to 4 weeks for engineering then your effort score will be of 2 persons – months. How to use the Rice scoring method effectively: During using of the RICE scoring method, we need to be more careful of below points to make that effective. 1. We need to focus on the goal so that we can achieve that, if we have a small team where we are not able to push forward the projects 3-5 goals in a quarter. In this case we can get the count down and consider the important goals, if that is also not possible, we can focus on a single goal. 2. Where the team size is larger, we can split the team up into sub-teams so that each team member can get into one goal. We always noticed that if the goal/objective is clear, people enjoy working to achieve the goal. We also keep in mind that all the team members are empowered so that they can get motivation and give their best.1 point
-
1 pointRICE stands for Reach, Impact, Confidence, and effort – four factors to assist you assess and grade ideas. after you trust your final goal, delighting your customers, it’s laborious to not get weak with of these new ideas. groups could be tempted to dive right into the cleverest ones first, while not taking under consideration the potential lift. once there’s most to consider, however does one confirm priorities? This framework permits your team to rigorously consider every potential project and assess its feasibility. groups use RICE to achieve perspective before beginning a replacement a part of the merchandise roadmap. When to use RICE – RICE may be an flexible marking model. The best part of this method is that it forces you to articulate and assume through however and why a project plan can or won't have impact. It removes a number of the feeling from the decision-making process, creating it easier for groups to come back to a consensus. Use the strategy whenever you wish to choose between many compelling ideas, or attempting to assign priorities in an exceedingly product roadmap. once your team is troubled to align or agree, the RICE method is a easy thanks to get everybody along for a productive discussion. several groups conjointly notice it helpful to use RICE at the start of every major project or once coming up with a replacement product launch. the way to produce our own RICE framework • Assess the Reach of a project. what number people can the project affect? can your client see a right away impact? Typically, teams measure Reach because the number of individuals wedged or the amount of events occurring in an exceedingly given time period. for a few teams, this implies customers per quarter. For others, page views per month. It’s vital to try and quantify this price with real data, adore product metrics. Remember, the end result of this exercise may be a numerical value which will assist you grade tasks. • Think the Impact of the project. If Reach is what {number} people are going to be full of this project, Impact measures the result itself. For example, let’s say you’re launching a replacement paid feature in your app. Reach is that the number of individuals affected by this launch, whereas Impact is however doubtless the launch is to convert them to paying customers. in contrast to Reach, though, Impact will be tough to quantify. several groups assess Impact employing a scale from one to 3, wherever 1 is low impact, two is medium, and three is high. • Outline your Confidence level. however assured are you that this project can have the specified impact? it would be the best plan you’ve ever had, however if you don’t have the information to corroborate its success, it might not add up to figure thereon right now. Confidence is evaluated as a percentage, where 100 percent is total confidence, 80% signifies optimism but not certainty, and 50% is low confidence. something beneath 50% is extremely low. • Think Effort. What’s the entire time it'll want complete this project? to gauge Effort, don’t simply think about the project itself, however conjointly think about the groups who will contribute. it would take four days to finish the project as a whole, that breaks down into 10 hours for engineering, twelve hours for marketing, and then on. Effort is measured in person-months, or the work that one team member will execute in an exceedingly month. • Calculate your score. to urge a RICE score for a selected task, perform the subsequent easy calculation: Multiply Reach, Impact, and Confidence. Divide that price by Effort. That’s your score. • Repeat the method for every task. Then compile an inventory of tasks and scores to assess priorities.
 1 point
 -
1 pointWhat is RICE Scoring Method? RICE scoring is a prioritization framework or a decision making tool that helps product managers to figure out what to build from the pool of available product ideas and what is the highest priority at the moment. This framework uses a simple formula of reach times impact times confidence, all over effort. The acronym RICE is derived using the initials of these factors used in the model. Mathematically it can be represented as below: Let’s understand how to use the RICE scoring method and understand the 4 components with and example: 1. Reach is the estimate of how many people you think your product will ‘reach’ in a given time period. The product manager has to decide both score and definition of ‘reach’ along with the time period in the context. For example: Let’s say a product manager with a credit card division of bank has 4 different discount offer ideas for increasing the spend of their credit card customers in the festive season of November month. Here, time period is 1 month and let’s keep definition of ‘reach’ as the number of credit card customers eligible for the discount offer. The score of ‘reach’ against each discount offer will be the count of customers that are eligible for an offer in 1 month as shown below. Discount Offer Type Reach Score Impact Score Effort Score Confidence Score RICE Score Offer A 45,000 Offer B 75,000 Offer C 30,000 Offer D 60,000 2. Impact is the qualitative goal defining the expected conversions when the product reaches your target customers. For the example of discount offer for credit card, it’s like asking the question “How many customers will spend using the credit card when the discount offer reaches the customers?” In RICE scoring method, the impact is a five-tiered scoring scale as below: · 3 = Massive impact · 2 = High impact · 1 = Medium impact · 0.5 = Low impact · 0.25 = Minimal impact Discount Offer Type Reach Score Impact Score Effort Score Confidence Score RICE Score Offer A 45,000 3 Offer B 75,000 0.25 Offer C 30,000 2 Offer D 60,000 0.5 3. Effort is the estimate of total number of resources required for completing the initiative in a given period. For the example of discount offer for credit card, it’s like asking the question “How many man-days (or man-months) of efforts will be required to roll out the discount offer?” The effort includes everything like design of discount, discount system configuration, campaign launch, marketing mailers design, agreement signing with discount partner, etc. If the estimated effort is 25 man-days then effort score will be 25. Discount Offer Type Reach Score Impact Score Effort Score Confidence Score RICE Score Offer A 45,000 3 45 Offer B 75,000 0.25 50 Offer C 30,000 2 30 Offer D 60,000 0.5 65 4. Confidence is expressed in percentages and is the estimate of how sure are you about your reach, impact and effort scores. This number varies from 1 to 100 percentage and usually defined as a three-tiered scoring scale as below: · 100% = High confidence · 80% = Medium confidence · 50% = Low confidence Any confidence score of less than 50% must be considered a “moon-shot” initiative and must be dropped to focus on other initiatives. Discount Offer Type Reach Score Impact Score Effort Score Confidence Score RICE Score Offer A 45,000 3 45 80% Offer B 75,000 0.25 50 100% Offer C 30,000 2 30 80% Offer D 60,000 0.5 65 50% RICE Score Calculation and Interpretation By filling up the above table, one can arrive at the RICE score using the formula as stated earlier. The initiative with highest RICE score becomes the priority for product manager to work upon from the list of available ideas or choices. In below table, we see that Offer A is the priority initiative for our example. Discount Offer Type Reach Score Impact Score Effort Score Confidence Score RICE Score Offer A 45,000 3 45 80% 2400 Offer B 75,000 0.25 50 100% 375 Offer C 30,000 2 30 80% 1600 Offer D 60,000 0.5 65 50% 231 Benefits of using RICE model: 1. It’s a scalable tool and can be helpful in prioritizing and decision making in any kind of business problem apart from product launch. This is because the RICE score is a form of cost-benefit score with ‘R x I x C’ as benefit and ‘E’ as cost. 2. It gives a method or a framework for prioritization and decision making using data rather than emotions. 3. It is a comprehensive methodology and helps prioritize ideas that may have been overlooked. 4. It can help in finding quick wins. Challenges of using RICE model: 1. The product manager will have to garner all the possible ideas to put them into the RICE framework for prioritization. If this is not done thoroughly then the model will prioritize an inefficient idea. 2. It’s time consuming as product manager has to evaluate each options against the 4 criteria before calculating final scores. 3. The model is constrained to use impact and confidence criteria for prioritization. This can lead to elimination of an idea that is important for an organization, yet low on impact and confidence. 4. The data for calculating all the 4 criteria aren’t always easily available. This makes RICE scoring difficult. 5. Human bias may deter the rational scoring of all 4 criteria in absence of accurate data leading to false prioritization. The results will be flawed if the criteria are flawed. References: https://www.productplan.com/glossary/rice-scoring-model/ https://medium.com/swlh/rice-scoring-model-for-prioritisation-88d879bfbac0 https://ascendle.com/ideas/why-the-rice-prioritization-framework-actually-works/1 point
-
1 pointRICE Scoring is a method which helps the Product Manager to Prioritize the roadmaps for the New Product, It's Features and other initiatives by considering the 4 factors namely Reach, Impact, Confidence and Effort which is collectively called as "RICE". It can be calculated using the formula, RICE (Score)= (Reach*Impact*Confidence)/Effort Scoring Criteria: Analogy: Reach, Impact and Confidence-Higher the Better Effort- Lower the Better Elaboration with example: Reach: Suppose "X" company gets 900 transactions through UPI payment/month. Then the reach is 900. Impact: If the company see's it as a huge Impact, then the score is 3 (Highest) or else If the company thinks it as a low impact, then the score is 1 (Lower). Confidence: If you have a confidence that transactions will cross more than 900 in the next month, then the confidence is 100% If you are not sure, then the confidence is 80% or if you know that transactions will never happen, then the confidence is 50%. Effort: If the huge effort is required to get 900 transactions per month. Say 50 sources/persons are required then the effort is 50. If only 25 sources/persons are enough, then the effort is 25. If we can achieve with only 10 sources/persons, then the effort is 10.
 1 point
 -
1 pointVery interesting question Deepak. Before I share some tips on how you can remember the concepts for a longer time, I would like to highlight that there is absolutely no need to remember everything specially in today's world where information is available at a click of a button. So even if you don't remember all the tests, it should be fine as long as you remember that there is some statistical method to solve for the problem. Now, coming to your question - 1. Practice on real life projects (but irony is we don't get projects easily) 2. Practice tools independently. Don't wait for the project, however, start applying tools to specific situations or data sets (this will be easier to do) 3. Visit our Forum and answer our 2 questions per week. These questions will keep you connected with the subject 4. Something that has helped me to remember the concepts for a longer time - pen down your understanding of the tools or even better try explaining the concepts to someone. You will only be able to explain if you understand the concepts Hope this helps!1 point


This leaderboard is set to Kolkata/GMT+05:30