Abhishek Chaudhary
Lean Six Sigma Black Belt
-
Joined
-
Last visited
-
Abhishek Chaudhary replied to Vishwadeep Khatri's topic in We ask and you answer! The best answer wins!Supply Chain Planning vs Plant Operations vs Sales Today, in a typical Home appliance manufacturing setup, the division looks like this: Function Responsibility Sales Demand forecast, schemes, seasonal push Central Supply Chain / Planning Monthly forecast consolidation, MRP run, capacity alignment Plant Operations Production execution, efficiency, delivery adherence Quality Audit, Inspection, rejection control Procurement Compressor, PCB, copper, coil sourcing These operate in silos. What Changes If AI Is Fully Integrated? If AI is deeply embedded (real-time demand sensing + constraint-aware planning + plant digital twin), the current functional boundaries break. - Forecast vs Execution Boundary Will Collapse Today: Forecast is monthly. Execution is daily firefighting. With AI: Demand sensing updates every 24 hours (channel sell-out, weather, dealer inventory). AI auto-adjusts plant mix. Planning cannot remain a “central Excel team.” Operations cannot say “forecast was wrong.” It becomes a closed-loop system. - Quality vs Delivery Will Merge into “AI-Governed Output Control” Today: Production chases volume. Quality checks after defect. With AI: Vision system flags rejections/defects in real time. AI reduces conveyor speed automatically. AI predicts powder consumption drift. Rejection prevention, not detection. Quality will no longer be a gatekeeper. It becomes embedded inside execution. Quality engineers shift from inspectors to model trainers. - Business vs Technology Boundary Will Disappear Today: IT implements ERP. Business uses it. Analytics team builds dashboards. Plant rarely trusts them. With AI: Models influence capacity hedging. AI suggests when to preload inventory before heat wave. AI predicts compressor stock-out 21 days early. You cannot have: “Business decision” “IT implementation” “Analytics support” Instead you need: Cross-functional AI Pods. - New Coordination Model for Manufacturing Org Instead of: Sales → Planning → Plant → Quality → Dispatch It becomes: “AI Control Tower + Execution Pods” Role New Nature Demand AI Lead Owns weather + sell-out models Plant Digital Twin Owner Simulates capacity & DFT risks AI Quality Engineer Tunes model thresholds S&OP Head Decision integrator, not spreadsheet owner Ops Head Constraint decision authority Roles That Will Merge Current Separate Roles Future AI-Integrated Role Demand Planner + Data Analyst AI Demand Architect Quality Inspector + Process Engineer Real-time Control Engineer Production Planner + Capacity Planner AI Scenario Controller What Will Not Work If you keep: Central AI team building models Plants executing blindly Sales overriding forecast manually AI will fail. Because AI requires: Shared data ownership Shared accountability Real-time feedback loops
-
Abhishek Chaudhary replied to Vishwadeep Khatri's topic in We ask and you answer! The best answer wins!Plant Head in Manufacturing (Discrete Manufacturing Operations) Today’s Plant Head (Traditional Model) Focus areas: Production targets OEE tracking Quality rejections Vendor management Cost control Manpower planning Maintenance firefighting Review-heavy decision making Heavy reliance on: Manual reporting Excel dashboards Experience-based decisions Reactive problem solving 5–10 Years: AI-Enabled Plant Head The role will shift from reactive operator to AI-orchestrated decision architect. Key shifts: 1. From OEE Monitoring → Predictive Throughput Optimization AI-driven predictive maintenance Real-time bottleneck detection Digital twin simulation of production lines Dynamic line balancing based on demand variability 2. From Manpower Supervision → Human + AI Workforce Orchestration AI-assisted shift planning Skill gap detection using performance data Automated SOP compliance monitoring via computer vision AI copilots for supervisors 3. From Vendor Follow-up → AI-Driven Supply Risk Management Predictive vendor risk scoring AI forecasting linked to capacity planning Real-time material deviation detection . 4. From PPT Reviews → Autonomous Insight Systems Instead of: 2-hour review meetings Manual presentation preparation AI systems will: Auto-generate anomaly alerts Provide root cause hypotheses Recommend action paths Run scenario analysis before capex decisions The Plant Head becomes: Decision validator What Capabilities Will Define Progression? Capability Layer 1: Strategic Data Fluency Understanding data pipelines (MES, ERP, SCADA integration) Ability to question AI outputs KPI modeling and causal thinking Statistical reasoning (beyond Six Sigma basics) Capability Layer 2: System Thinking Reducing downtime may increase inventory. Increasing automation may reduce flexibility. Future leaders must: Evaluate cross-functional AI trade-offs Balance automation vs resilience Capability Layer 3: AI Governance & Risk Leadership Plant Heads will need to manage: Model bias in defect detection Data security in OT environments Over-reliance on automation Cybersecurity risks in smart factories Operational leadership becomes techno-ethical leadership. Capability Layer 4: Change Orchestration The biggest barrier will not be AI. It will be: Shopfloor resistance Supervisor insecurity Skill displacement anxiety Advancement will depend on: Ability to retrain workforce Communicate AI augmentation vs replacement Build AI adoption culture Career Path Evolution Year 0–3: AI-aware Plant Head Uses AI tools implemented by others. Year 3–6: AI-integrated Operations Leader Co-designs AI systems with vendors and internal tech teams. Year 6–10: Strategic Smart Factory Architect Leads multi-plant AI transformation programs.
-
Abhishek Chaudhary replied to Vishwadeep Khatri's topic in We ask and you answer! The best answer wins!Example: Supply Chain Demand Planner in AC Manufacturing Company In AC manufacturing, demand is: Highly seasonal (summer spikes) Weather-sensitive Promotion-driven Capacity-constrained (compressor imports, copper price volatility, Free Trade Agreements etc) Today, AI models already: Generate baseline forecasts (SKU × region × week) Detect Anomalies Suggest safety stock levels How Hiring Criteria Should Evolve 1. Forecast Framing Ability (Problem Structuring > Calculation) Can the candidate: Define forecast hierarchy correctly? (SKU vs model vs tonnage level) Identify structural breaks (new product launch, channel shift)? 2. Causal Thinking Over Correlation Acceptance AI detects patterns. Humans must ask: Is this demand spike weather-led or distributor stocking? Is this repeatable or one-time? 3. Scenario & Risk Simulation Mindset Instead of “What is next month’s forecast?” The question becomes: What if IMD predicts a delayed summer? What if copper prices rise 12%? What if compressor imports delay 3 weeks? 4. Ai Literacy & Governance Some Skills become important Understanding model bias Knowing when to override Recognizing overfitting patterns Monitoring forecast accuracy drift Person should be supervisor, not just user.
-
Abhishek Chaudhary replied to Vishwadeep Khatri's topic in We ask and you answer! The best answer wins!When AI becomes a part of workflow, performance matrix must change from gauging individuals to evaluating collaboration of human and AI. Lets take an example of Supply chain - Demand forecasting. AI is being extensively used for generating Demand Forecast of SKUs and Location wise, it also suggests safety stocks. Now traditional KPIs like Forecast accuracy, Bias % or task completion rate might not work, it can either make organization, or individuals go for completely blind acceptance or if accuracy drops, go for resistance. After AI implementations performance matrix can be changed eg. % of overrides that improved accuracy or % of ignored alerts that caused issues. We can have impact score based of override. same way we can have KPIs for safety stocks. If KPIs are not changed it can either demotivate the individuals or make them completely blind towards risks.
-
Abhishek Chaudhary replied to Vishwadeep Khatri's topic in We ask and you answer! The best answer wins!Lets take example of AI based predictive maintenance for CNC machines in manufacturing plant. the AI system uses ML model like anomaly detection on vibration sensors, temp sensors etc to predict when tool/machine is likely to fail or when process parameters are heading towards out of spec parts/products. Then the AI based system makes recommendations to change tool, adjust parameters etc, be it automatically or manually. there are KPIs associated with the same, i.e. downtime, rejection, Yield, OEE etc. How to ensure that the overall process continues to deliver the intended outcomes over timeBecause of dynamic environment of manufacturing process, i.e. changing raw material specs, ambient conditions, govt rules, human involvement, it all leads to drifting of outcomes. there can be data drift (calibration issues, etc) or correlation shift (same vibrations may not mean early or late failure like it used to in past). then the AI system can predict wrong output, it can increase maintenance costs due to unnecessary spare changes or increase the breakdowns because of non-recommendations of maintenance when there was a need. so to keep the system relevant, we need to have a) continuous monitoring of KPIs, SPC charts (Breakdowns, Yield, OEE etc) b) AI system monitoring metrics like AI recommended breakdown windows vs actual breakdown, calibration error patterns How to response when performance starts to slipa) if detected early and KPI is still ok - investigate route cause and take action b) if detected late and KPIs are not ok - Then switch to time-based/stroke-based model, Human oversite for critical processes. Retrain the system again with newfound data/history, the redeploy with oversite.
-
Abhishek Chaudhary replied to Vishwadeep Khatri's topic in We ask and you answer! The best answer wins!An escape point is the next point of control after the root cause which should have detected the issue. It is control point which has failed to do its job. Idea behind identifying the escape point is to understand which control point has failed so that necessary action can be taken. This way root cause and control point both can be improved. Escape Point is generally used in 8D Problem solving technique, However it can be used just as effectively in DMAIC project. In DMAIC Project during analysis phase we can identify the escape point and update control plan accordingly in later phases. Taking action on escape point in Improve phase should be done.
-
Abhishek Chaudhary replied to Vishwadeep Khatri's topic in We ask and you answer! The best answer wins!RICE (Reach, Impact, Confidence and Effort) is a prioritization model used to choose features and initiatives in product development. This models helps us in determining which features should get more weightage and should be worked upon first and which can be left for later. This is done by evaluating each idea by scoring them in the bracket of 4 facets of RICE. Reach: The first criterial of evaluation , as the name suggest itself, is for determining what will be the reach of the idea, feature, initiative. Will this feature get more customers onboard? Will this feature enable more transactions? Your Reach score will be based on the number estimated that a particular idea will bring. So for Example if an idea brings 250 more transactions every month, then reach score will be 250. Impact: Impact scoring depends on the estimation of influence of the idea. for example what impact will the idea have on customer satisfaction index? Generally it is scored as below: 3 = massive impact 2 = high impact 1 = medium impact .5 = low impact .25 = minimal impact Confidence: Confidence score is determined by the level of confidence in idea being successful. Be it implementation, Other scores i.e. Reach or Impact. Availability of data for other factors such as Reach and Impact helps us determining the confidence level as well. 100% = high confidence 80% = medium confidence 50% = low confidence If the idea is having less than 50% confidence then generally it is not worth prioritizing. Effort: Effort score depends on what kind of work is needed to implement the idea. Effort can be different things, it can be cost, can be manhours/Man days/Person - Months required. This is also an important part to prioritize. i.e. if we have an idea in which others scores are very good but efforts needed is very high whereas 1 idea in which very less efforts can bring immediate and moderate benefits. Score can be given accordingly i.e. if an idea is taking 6 persons to complete in 2 month then score can be given as 12. Final score will determine which ideas to prioritize and which to not.
-
Abhishek Chaudhary replied to Vishwadeep Khatri's topic in We ask and you answer! The best answer wins!Timeboxing a project management technique in which a Fixed and Maximum time (Time Box) is allotted for a particular activity and that activity will be completed within that time frame. It is simple but very strong tool for time management in project. It is focused on time rather than activity. At the end of every timebox progress is reviewed and actions are taken accordingly. Benefit: Timeboxing is a great tool for sticking to the deadlines. Time limit enforce people to be more focus towards finishing and prioritizing their work. Drawback: This method might be a good management tool but creative people might find it hard. Some people might find it hard to stop working on thing in which they are focused on and start working on something new.
-
Abhishek Chaudhary replied to Vishwadeep Khatri's topic in We ask and you answer! The best answer wins!Project Scope helps us in limiting the boundary of a project. Understanding the requirement of project helps in determining the scope of project. Project Scope is formulated in Define phase of a DMAIC project, it contains the constraint of the project. However it can be changed later in different phases till Improve phase due to some of the below reasons in each phase. Measure: In measure phase project scope can be changed due to different reasons, sometimes your baseline performance for defined scope does not justify the project and then maybe you have to change the scope for adding the data to your base line performance. Analyse : In analyse phase if the analysis shows that some factors which are causing the issue lies outside of scope then you have to change the scope. Improve: If solution is not effective or feasible sometimes then project scope can be altered in order to take better solution.
-
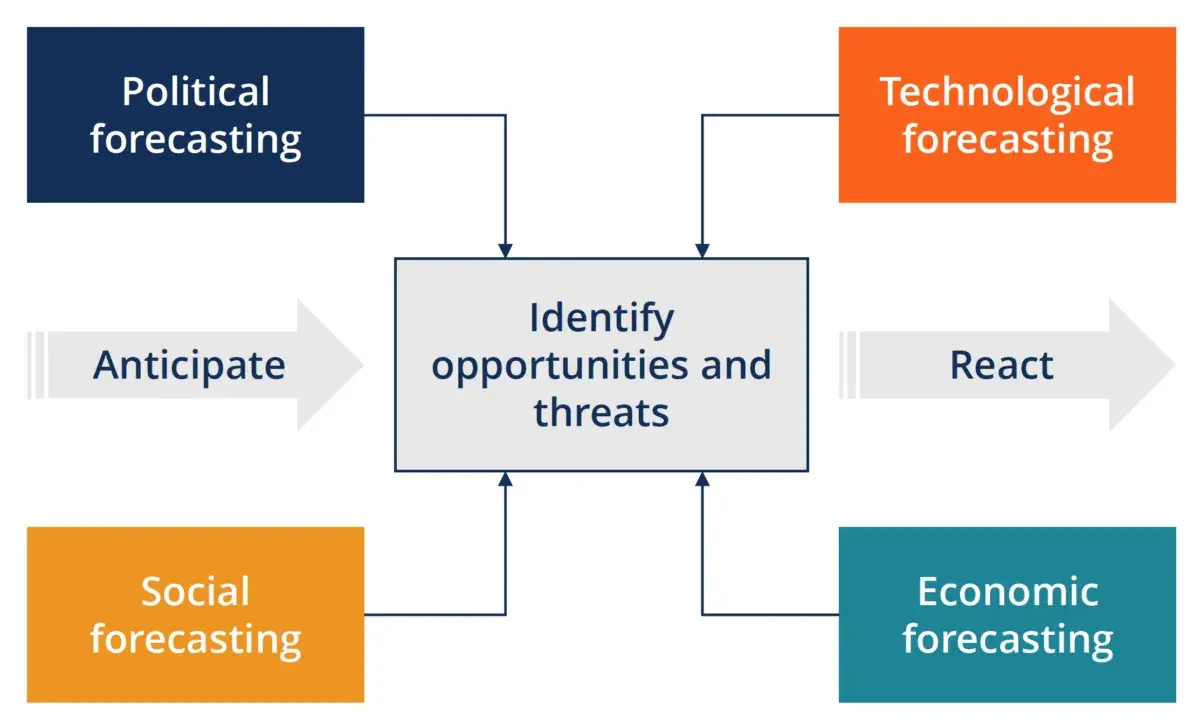
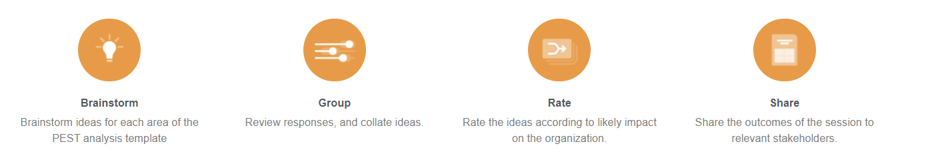
Abhishek Chaudhary replied to Vishwadeep Khatri's topic in We ask and you answer! The best answer wins!PEST Analysis (Political, Economic, Social & Technological) is a management method which is used to access the external factor so that organization can take steps in order to take advantage of or mitigate the situation and become more competitive. PEST analysis can be a good method to use in corporate strategic planning. It is to identify pros and cons of a business strategy. A popular variation on the PEST Analysis format, especially in the U.K., is the PESTLE strategic planning approach, which includes the additional aspects of Legal and Environmental. Some of the Example of different facets are given below: POLITICAL : Taxation Policy Environmental Law Labour Acts Subsidies etc. ECONOMIC : Per Capita income growth rate of region or country GDP growth rate Interest Rates Exchange Rates etc. SOCIAL : Culture Population growth rate Age distribution etc. TECHNOLOGICAL : Rate of change in technology R&D initiatives Automations etc. In PEST Analysis, any strategic plan or policy is assessed against these 4 facets. What would be of benefit and what would create an issue so that actions can be planned to mitigate those issue. HOW TO DO A PEST ANALYSIS: To get the most from the PEST technique, gather input from the participants with different perspectives. When you’re working with a large or distributed team, then you can get the most out of this analysis.

-
Abhishek Chaudhary replied to Vishwadeep Khatri's topic in We ask and you answer! The best answer wins!Acronym for SDQC is Safety, Delivery, Quality & Customer. It provides a visual assessment of how processes are operating in organization. e.g. Safety index will monitor whether we are achieving safety objectives on each day or not. Safety Metrix can include: 1) Near Misses 2) Major or Minor Accidents 3) PPE Usage adherence % etc. Same way daily metrics can be made for each facet and can be monitored visually on daily basis or a predefined frequency as per the need of organization. Some companies add other criteria as well i.e. inventory, productivity etc. Its a fast and easy visual representation of goals met or not for specific criteria. You only need color coding to represent whether target hit or not. It can be used in Process Management very often and can improve efficiency as management can see at a glance which areas are achieving and which areas need support. Counteractions can be presented and discussed in real time. It is also a good tool to improve accountability.


-
Abhishek Chaudhary replied to Vishwadeep Khatri's topic in We ask and you answer! The best answer wins!Bowling chart is a kind of tracking sheet used for tracking of KPIs or Policy deployment objectives. This tracking sheet generally visualizes the target vs actual on a sheet on a given frequency basis, which can be daily, monthly or annually. Its quite similar to hourly production data sheet in manufacturing however in Bowling chart color coding is also done to visualize the level of achievement. Red means KPI not achieved Green means KPI achieved. Yellow means KPI partially achieved up to a secondary level. Color coding can different variations as per the organizations standard or requirements. It is quite similar to bowling scorecard. Strength of Bowling chart is that it is a very strong tool to visualize if target is being met or not. Or how often the target being met but it is not best representation for "continuous improvement". If we are constantly meeting or not meeting our target, it is difficult to know if improvement is there or not in a bowling chart. Policy deployment KPIs can be easily broken into monthly or yearly targets and can be tracked easily through a bowling chart. A basic and popular visual representation of bowling chart is give below:

-
Abhishek Chaudhary changed their profile photo
-
Abhishek Chaudhary replied to Vishwadeep Khatri's topic in We ask and you answer! The best answer wins!DEDUCTIVE REASONING & INDUCTIVE REASONING There are two main types of reasoning used in developing and testing scientific theories or argument namely Deductive & Inductive reasoning. In Scientific circle, one can does not prove a hypothesis being true, but they can collect evidence that points to it being true. There is only conclusion drawn from facts and observations. Just like lawyers can not prove their theory being true but they can provide evidence that points to it. There is also a third theory called abductive theory, but we will discuss Deductive and Inductive Theory. INDUCTIVE THEORY Inductive theory works from specific observations to a generalized conclusion or theory. It is common to conduct inductive research when there is very less or no existing theories on the topic. When you don’t know much about the topic you observe and note the observation. Begin noticing patterns and regularities, then formulate some hypothesis that can be explored and finally developing the general theory. Because of this approach being started from micro level observation and formulating the general theory at the end also called “Bottom UP” Approach. Giving all of you a Pop culture example the fictional character Sherlock Holmes is a master of Inductive reasoning. He is masterful observer who observers all the details carefully to reach to the most likely conclusion in those circumstances. a. Observation - A low-cost AC has failed the ambient test after running for 20 hours. - Swan A is white b. Observing a Pattern - 10 more low- cost ACs have failed the ambient test after running for 20 hours. - Swan B & C are also White c. Developing Theory - Low-cost ACs will always fail the ambient test after running for 20 hours. - All Swans are white Limitation of Inductive Theory: An Inductive theory can not be proven, it can be invalidated, however. You observe 150 more low-cost ACs fail the same test so that validates your theory but you can never prove that 151st AC will also fail. But the larger the dataset the more reliable it is. A conclusion can seem to be true at one point until further evidence emerges and a hypothesis must be adjusted. A CONCLUSION IS EITHER WEAK OR STRONG, NOT RIGHT OR WRONG. Everyday inductive reasoning is not correct always but often useful. An Example of this would be A farmer feeds a turkey every day, so the turkey assumes that the farmer cares for its wellbeing. Only when Thanksgiving rolls around does that assumption prove incorrect. DEDUCTIVE THEORY Deductive theory works from top to bottom and that is why it called “Top Down” approach. It works from more general to more specific. In this an already existing theory is tested by narrowing it down to more specific hypothesis that we can test. Then the hypothesis is narrowed down further when we collect observation to validate or invalidate the hypothesis. This will proceed to us being able to test the hypothesis with specific data which can either confirm or deny the theory so that it can be adjusted or changed. a. Predefined Theory - All low cost ACs fail in ambient test after 2 hours of running - All swans are white b. Formulate A Hypothesis - If we buy low-cost AC then it will fail in ambient test - If we find a swan, then it will be white. c. Collect data to validate the hypothesis - Collect data for 1000 more low-cost ACs - Check 500 swans d. Analyze the result - 2 out of 1000 ACs run do not fail in Ambient test if run for more than 2 hours (Reject or Adjust the theory) - All of 500 swans are white (Support the theory) Limitation of Deductive Theory: The conclusion based on deductive reasoning can only be true if all the premises set in Inductive reasoning are true and terms are clear. Example All dogs have fleas (premise) Benno is a dog (premise) Benno has fleas (conclusion) Based on the premises we have; the conclusion must be true. However, if the first premise turns out to be false, the conclusion that Benno has fleas cannot be relied upon. Also, we should be very careful of deductive reasoning that appears to make sense without pointing to a truth. Someone could say “A dog has four paws. My pet has four paws. Therefore, my pet is a dog.” The conclusion sounds logical but isn’t because the initial premise is too specific. Combining Both Type of Reasoning The two methods are very different when conducting research. Inductive reasoning is more open ended and exploratory, while deductive reasoning is specific in nature. Both theories are combined in science to reach more and more close to the truth. It is a cyclical process. Inductive research is followed up with deductive research to confirm or validate the theory if not validated then it can be adjusted. Again, adjusted theory can be validated again by using deductive reasoning and the cycle goes on. Using In Lean Six Sigma Word Both type of reasoning is used in Lean Six Sigma word. Most hypothesis testing that are done in analyze phase are based on this reasoning. If our hypothesis is true, we accept the root cause which was our initial theory otherwise we look for more factors.
-
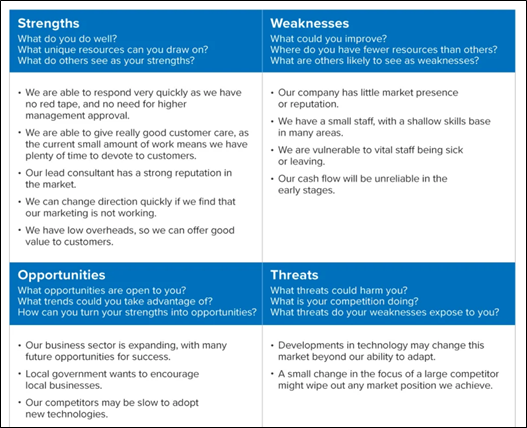
Abhishek Chaudhary replied to Vishwadeep Khatri's topic in We ask and you answer! The best answer wins!SWOT analysis is a powerful tool to understand the pros and cons of any strategy or organization. It can be used to check what will work and what will create an issue. SWOT is an acronym for Strengths, Weaknesses, Opportunities and Threats; this tool is used for analyzing these 4 facets of any strategy and business. It can be used in different scenarios e.g. for studying new business, new companies, part of company, any strategical planning. It can be used for industry, place, product or persons. It helps in decision planning. SWOT analysis can be used to predict the factors which will work in tandem to help implement the plan and also the factors which will create problem and strategy can be made to tackle those problems thus paving the way for smooth implementation. A Visual Example of SWOT is below: SWOT ANALYSIS – INTERNAL AND EXTERNAL FACTORS SWOT Analysis is comprised of INTERNAL and EXTERNAL Factors - INTERNAL FACTORS – Strengths and Weaknesses (Current or Backward-Looking Factors) EXTERNAL FACTORS – Opportunities & Threats (Forward Looking Factors) APPROACHING SWOT ANALYSIS SWOT analysis can be approached by using a brainstorming technique with a team from a different functions and levels in organization. Let’s look at each facet in more detail: STRENGTHS It is an internal factor as we look at the current situation or backward-looking factor. We look at things which are presently available. Strengths are the edge that organization/strategy have over others. It is the things which will work for betterment. Strengths are integral part of organization, so these are the advantages your company has and will utilize it. Example: · Company Culture · Company image · Better Capacity · Better Location etc, WEAKNESSES As is the case with Strengths, Weakness is also Internal Factor. Its time to write down things which goes against the organization. Being honest is very important and listing out as many things as possible. What could be improved? What are the things that is to be avoided. Example: · Low capacity · Little market presence. · Less organizational efficiency. · Inefficient Suppliers etc, OPPORTUNITIES Opportunities are the chances that can be grabbed with efforts and can be turned into strengths. It is a forward-looking approach which can be used for the benefit. They usually arise from the situation outside of the organization. Example: · Political Changes · Social pattern · Per capita income growth trajectory etc THREATS Threats include anything which can work negatively. It is also a forward-looking approach and generally are factors which are outside of your organization. It is vital to anticipate and tackle these threats. Example: · Change in market behavior · Shortage of manpower · Change in banking policies etc. Example of Completed SWOT analysis: How can it be used in Business Excellence Initiatives? Generally Business Excellence Initiatives involves radical policy changes or policy deployment. It can be affected by issues from both from the organization itself or outside of the organization. Doing SWOT analysis and trying to figure out Strengths & Weakness can create an extra advantage for the team. Also Figuring out Opportunities & changing them into strength would create the initiatives a lot more profitable. Avoiding threats is imperative for the organization to stay relevant in future as well. SWOT analysis in Business Excellence can give an outlook to the organization about what will work and what won’t so that measures can be taken for that.

-
Abhishek Chaudhary replied to Vishwadeep Khatri's topic in We ask and you answer! The best answer wins!Kamishibai Board is a tool for visualization of management system and standards. It was originated in 12th century in japan where people will show story telling of Buddhist moral through paper theater for people to self audit themselves so that they can check & compare if they are living the right way or not. Generally audits or checks are done on daily, weekly, monthly or quarterly basis. So Kamishibai board visualizes the steps that need to be taken for the audit and NCRs that are pending. That is how it standardizes the audit process and eliminates the need of specialized expertise. It contains 5W1H information (Who, What, When, Where, Why & How information) on the board. This information is written on the card which are placed on the board. It is useful for Gemba visits. Anyone can come, pick the card and check the system. The NCRs are issued and countermeasures are also mentioned. This board is located where it is visible to process owner and can be easily accessed. As is the case with most manufacturing originated tools this can be used in service industry as well and vice versa. A good example would be Car service centers where you can generally see Kamishibai Boards. It is used for auditing the basic checks on daily basis and even used for higher up audits. Another example would be Call centers where it can used to check the canteen facility. the quality of hygiene. Same can be displayed near work station. I am attaching a basic example of Kamishibai Board.