Somnath Mukhopadhyay
Members
-
Joined
-
Last visited
-
Somnath Mukhopadhyay changed their profile photo
-
Somnath Mukhopadhyay replied to Vishwadeep Khatri's topic in We ask and you answer! The best answer wins!The Problem Solving Process (Global 8D) is a structured approach to reach to the base cause and hence the escape point and taking actions to confirm that these are eradicated permanently through effective controls and actions that are embedded within the operations of the business. The Deming cycle is part of the Global 8D process, starting with the G8D form and is used at various steps through the method. In this current step the cycle is employed to: - PLAN - Plan for validation of the PCA Plan to remove the Interim Containment Action (ICA) as a part of implementation of the PCA Integrate check for side effects Plan for continued monitoring of effectiveness of the PCA’s Plan for all the required resources Documentation, Instruction, Training and Implementation to be planned What, when, who and when (team roles and responsibilities) - define clearly DO – Initiate the plan for implementation for both the basis cause and escape point, ensuring that each one the required steps are managed and adhered to. CHECK – ensure the PCA’s are fully implemented and integrated into the operational and business processes. The measures for effectiveness of the PCA’s should use the identical measurables that we wont to describe the matter within the article Describe the matter. In other words comparing similar looking data. ACT – Actions to be taken on any variation from the plan or expected outcomes. Validation is proof that's developed after implementation has taken place, over a period of your time and must: Follow successful verification Provide a knowledge driven comparison before and after implementation. Check that the implementation doesn't introduce a replacement problem or side effects. Validation is: Normally performed under defined operating conditions on the ultimate product or process. May be necessary in earlier stages before product completion. Uses the identical indicators that demonstrated the matter and should be easily tracked
-
Somnath Mukhopadhyay replied to Vishwadeep Khatri's topic in We ask and you answer! The best answer wins!RICE stands for Reach, Impact, Confidence, and effort – four factors to assist you assess and grade ideas. after you trust your final goal, delighting your customers, it’s laborious to not get weak with of these new ideas. groups could be tempted to dive right into the cleverest ones first, while not taking under consideration the potential lift. once there’s most to consider, however does one confirm priorities? This framework permits your team to rigorously consider every potential project and assess its feasibility. groups use RICE to achieve perspective before beginning a replacement a part of the merchandise roadmap. When to use RICE – RICE may be an flexible marking model. The best part of this method is that it forces you to articulate and assume through however and why a project plan can or won't have impact. It removes a number of the feeling from the decision-making process, creating it easier for groups to come back to a consensus. Use the strategy whenever you wish to choose between many compelling ideas, or attempting to assign priorities in an exceedingly product roadmap. once your team is troubled to align or agree, the RICE method is a easy thanks to get everybody along for a productive discussion. several groups conjointly notice it helpful to use RICE at the start of every major project or once coming up with a replacement product launch. the way to produce our own RICE framework • Assess the Reach of a project. what number people can the project affect? can your client see a right away impact? Typically, teams measure Reach because the number of individuals wedged or the amount of events occurring in an exceedingly given time period. for a few teams, this implies customers per quarter. For others, page views per month. It’s vital to try and quantify this price with real data, adore product metrics. Remember, the end result of this exercise may be a numerical value which will assist you grade tasks. • Think the Impact of the project. If Reach is what {number} people are going to be full of this project, Impact measures the result itself. For example, let’s say you’re launching a replacement paid feature in your app. Reach is that the number of individuals affected by this launch, whereas Impact is however doubtless the launch is to convert them to paying customers. in contrast to Reach, though, Impact will be tough to quantify. several groups assess Impact employing a scale from one to 3, wherever 1 is low impact, two is medium, and three is high. • Outline your Confidence level. however assured are you that this project can have the specified impact? it would be the best plan you’ve ever had, however if you don’t have the information to corroborate its success, it might not add up to figure thereon right now. Confidence is evaluated as a percentage, where 100 percent is total confidence, 80% signifies optimism but not certainty, and 50% is low confidence. something beneath 50% is extremely low. • Think Effort. What’s the entire time it'll want complete this project? to gauge Effort, don’t simply think about the project itself, however conjointly think about the groups who will contribute. it would take four days to finish the project as a whole, that breaks down into 10 hours for engineering, twelve hours for marketing, and then on. Effort is measured in person-months, or the work that one team member will execute in an exceedingly month. • Calculate your score. to urge a RICE score for a selected task, perform the subsequent easy calculation: Multiply Reach, Impact, and Confidence. Divide that price by Effort. That’s your score. • Repeat the method for every task. Then compile an inventory of tasks and scores to assess priorities.

-
Somnath Mukhopadhyay replied to Vishwadeep Khatri's topic in We ask and you answer! The best answer wins!ABC Analysis Overview- ABC Analysis aka ABC Classification is crucial driver when it comes to material management. Inventory categorization is done through this method and it is helpful in classifying the inventory primarily into three salient categories basis revenue generation. This also helps to identify the essential products in stock and thus prioritize the management of the same on the value. Analyzing inventory is based on the principle of Pareto, a popular economic theory, which signifies that optimum growth occurs only due to a small part of the economy. The relation between input and output has always remained unequal. Pareto Principle denotes that 80% of the sales volume is generated from the top 20% of the items. In any group, following the 80/20 rule, there are significant few and insignificant many. Category of ABC Analysis - Theory - All inventory items can not have similar or equal value. There are three categories X - Products included in category X are one of the most important stock items having the highest value. It is also the smallest category that has minimal products. Y - Mid level category that has products of slightly higher value and less tightly controlled goods are recorded. Items included in category Y are bigger in volume but of lesser utility compared to category X. Z - Usually Z is a general category that contains the largest volume of inventory goods containing the least value in terms of generating business revenue. These products would need the simplest controls and minimum records. ABC Analysis Calculations - Calculation is done in 5 steps - for both individual product groups or a wide range of inventory. Annual no of product gets multiplied wit each item's cost, and note the utility of the product Create a category of each product (descending order) on basis of usage value Sum up the usage value of the products, include total no of items Get the percentages (cumulative) of items sold and annual consumption value Divide the data into three categories, using an approximate ratio of 80:15:5 Criticality in Inventory management - Helps analyzing customer demand targeting particular product category Streamlines and optimizes the inventory process Supplier gets conducive negotiation Offers possibilities of strategic pricing of the products Customer service level enhancement Resource allocation made easier Shortcomings of ABC Analysis - New Products - Using the product's sales metrics to identify which level it belongs to in the model. However, it is difficult to classify the new products as there is no historical sales data to examine. Seasonality - Holidays and weather - significantly affects the ranking of certain products. During the winter season, warm clothing products may be categorized as an A item, however - during the summer, the same would be brought down to the C rank. How to overcome - Classifications to continually evolve and get adapted every given period. Blindness - The ABC analysis depicts a product's importance, how often it is sold and how much revenue they are bringing into the company. Still, there are many factors that will eventually contribute to a product's importance. However, the may not have a large effect on a brand's profitability and good will. They will not rank high in the model. How to overcome - Example - A retail store can have specific products in display. it will help attracting customers. If these items need to be set with higher rank (analysis) and business owners to continue to substitute them with new ones in the display to to have more footfall in the store.


-
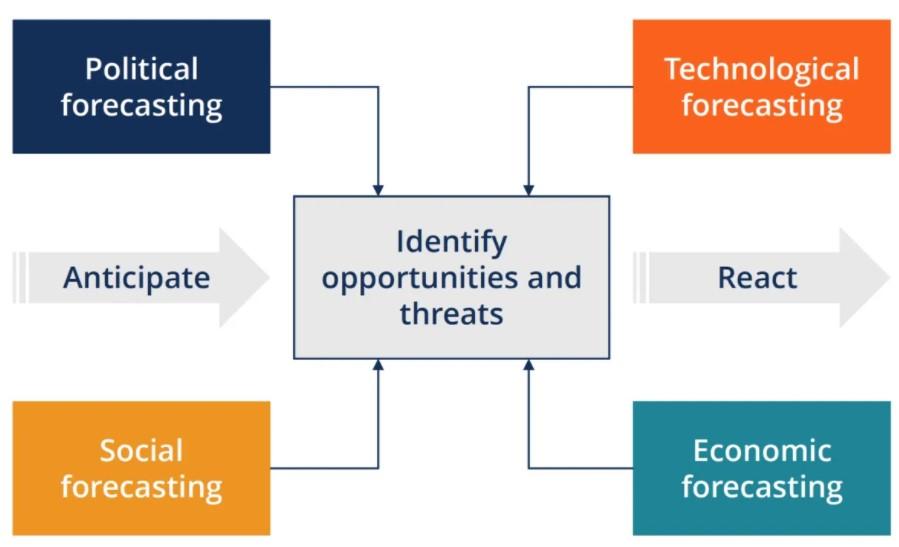
Somnath Mukhopadhyay replied to Vishwadeep Khatri's topic in We ask and you answer! The best answer wins!PEST Analysis is known to be a strategic framework that is used to assess the external environment for a business by drilling down opportunities and threats into Political, Economic, Social, and Technological factors. This analysis has evolved to be an effective framework to utilize in corporate strategy planning, handy in identifying the pros and cons of a business Strategy. Example: COCA COLA 1. Political Factor - FDA tests Coca Cola products. It must follow the rules particular to a country. It should also supply the local stores with the best beverages. Countries can very well prevent it from distributing the products if all rules are not obliged. Rules can relate to accounting, internal marketing, labor or taxes. 2. Economic Factor - Coca Cola has its customers around the world. The company has its production units in various countries. It prioritizes its customers’ tastes and preferences. Revenue comes from the beverage sales. Of late, people have started choosing healthy drinks. Coca Cola has noted it and has been moving in that direction. 3 Social Factor - Urban areas are targeted as major market. There are more than 30 types of flavors in Japan. Same is the case in China. US is more focused on healthy products. Water and teas are also some of the well known products that are under this category. Coca Cola can use the same approach in the countries like Japan and China. 4 Technological Factor - Use of new technologies can make Coca Cola very effective. It can help it in manufacturing a large number of quality products. The technological set up in Britain has helped ensuring that customers get the finest products in a short time. Coca Cola has also social media presence, that helps in increasing its popularity. Its promotion campaigns have been very popular on various social media platforms. 5 Legal Factor - The company has secured all the rights of its business. It has obtained the rights of all the past and future products with a patented process. 6 Environmental Factor - Water accessibility is quite essential to Coca Cola for manufacturing its products. If there is no water accessibility, then they can’t operate. It also need to be ensured that water processing is environment-friendly.
-
Somnath Mukhopadhyay replied to Vishwadeep Khatri's topic in We ask and you answer! The best answer wins!SDQC board is known to be a process management tool providing assessment (visually) of how each process is working within the factory. SQDC Boards are reviewed every day by leaders and they usually cover a minimum of 4 tracking areas - Safety, Quality, Delivery, and Cost. There can be other areas as well like - Inventory, Productivity or Environment. SQDC can do the visual indication of success and failure in no time - associated with specific criteria (daily targets). Once goals are clear for each tracking area, we only need two colors - green and red. Green depicts goals met, and red shows the opposite. Therefore, some errors could have occurred and we need to pay attention. Each tracking area features a letter with 31 numbers inside, representing every day of the month. Each number is colored in green or red depending on whether the criteria were met or not. If necessary, the standards are often explored in additional detail to the proper of the world letter. This can provide more of an understanding of which sort of error cause a red day. Example Criteria: Safety No Safety Incidents No Missed Work due to Injury No Near Misses No Unsafe Work Practices Observed No Safety Glasses violations Customer/Cost: No Complaints No Pipe Faults/Defects Two benefits of managing processes using SQDC - Improves Efficiency: At a look , management (and the entire workforce) can see which areas are succeeding, and which require support. Countermeasures can be discussed in real-time, on the spot and specific changes can be implemented quickly. Processes are tracked daily with a helpful bird-eye, visual approach, which suggests errors are identified and eliminated rapidly and therefore the work is more accurate and efficient overall. Not to mention, a praised work team (in areas with all green days) also can cause a team that feels appreciated, who can then exerting to realize green for all areas. The criteria can sometimes be too easy as well. In the spirit of continuous improvement, you'll then alter the daily goal to make sure it's slightly tougher to urge all green days, then the team is always pushing to get better. This helps improving work productivity also. Improves Accountability: With a daily guide to where errors are occurring and standards aren't being met, accountability is definitely assigned to at least one area. If a team says changes are made, but the red continues, further action are often taken. If the SQDC Board is during a public space, then this will be incentive enough for a team to figure smarter and begin achieving goals/targets.


-
Somnath Mukhopadhyay replied to Vishwadeep Khatri's topic in We ask and you answer! The best answer wins!The Bowling Chart is very comparative to the scorecard utilized in bowling. It shows the execution of the key targets simply and a group is responsible for conveying, usually over a period of a year. Within the simplest version, you list your targets on the cleared out, and on the correct for each of those destinations, you record your month-to-month targets and genuine comes about. In the event that you hit your target, the month is shown in Green. If you miss your target, the month is shown in Red. As a director, you'll be able right away to see where there are issues and work together with your group to address them. Of course, producing even this simple version takes a part of planning and discipline. The goals ought to be clearly characterized so that you simply know precisely what to a degree, and after that, you would like to get it how you're aiming to the degree it. Individuals utilizing the Bowling Chart discover that it may be an extraordinary put for finding out where things can be going off-base. And in the event that a metric does come up short to meet the target, it'll at that point require more data. Some of the time extra data can be made available straightforwardly within the Bowling Chart: a trend pointer is well known, as could be a year-to-date column, but including as well much can take absent from the basic green/red visual incite. Key plans created utilizing this prepare are more often than not visualized in X-Matrices. A Top-Level Lattice and a number of 2nd Level Lattices layout Breakthrough Goals and beat level enhancement needs that each of the partners are responsible for. Depending on the structure of an organization, 3rd level Lattices may be utilized to bore down to other Change Needs that offer assistance reach the objectives. Each X-Matrix is upheld by a Bowling Chart or Scorecard. At the extended level, an Activity Arrange is utilized within the arrange of an A3 report, nearby a Countermeasures report, which records all the activities to be taken to put the technique back on track.

-
Somnath Mukhopadhyay replied to Vishwadeep Khatri's topic in We ask and you answer! The best answer wins!Leader Standard Work (LSW) is beyond standardized work for leaders. It ensures influencing leadership philosophy and helps moving away from traditional leadership value proposition to critical work, leaders need to do to implement and sustain improvements in culture, performance and practices within organizations. This brings a fundamental change to a leader’s role, mimics the behavior they desire to see and sets the example for best practices. Thus, LSW as a management philosophy that instils values of ownership, responsibility, accountability and empowerment across all levels. LSW: This is a lean concept. However, it is not same as operator standard work. LSW has both up and downwards accountability - evaluated daily or multiple times in a day using different visual controls. One must follow it daily because it not only helps to verify that work is carried out properly, also ensures that everybody is considered accountable to work to the standard. It is primarily focused on activities at the ground level (Gemba) as well as supporting incremental improvements. Getting a standardized process to perform, more importantly when it is visual to all stakeholders - is a way of earmarking and ensuring all agrees to the process. Once a standard is established, it provides a solution from which teams can easily scrutinize and improve it on continuous basis. Improvement is easier in a streamlined approach. Putting this standard in place is crucial for any leader to empower their teams so that they can solve their own problems and improve the underlying processes. It is to be ensured that the standard is first established. Digital technologies enhances scope of the implementation of LSW across an organization: Digital tools and technologies helps streamlining and accelerating the improvement process. They can support the implementation of LSW primarily in two ways. Digital platform can automatically trigger the issues and get leadership focus on areas where more enablement is needed. Data visualization is possible and the same is communicated to foster faster decision-making at the right level. Digitalization also supports virtual work possibilities. Going digital also enables more transparency between levels and functions across organization. Better transparency of information guarantees the culture that leadership is trying to implement. These tools and technologies are of valuable support to leaders -helping them identifying LSW activities and improve business performance. Further, it links them to standard work and helps execution in a consistent approach across the business – this helps people, various practices and enabling processes stay integrated.
-
Somnath Mukhopadhyay replied to Vishwadeep Khatri's topic in We ask and you answer! The best answer wins!Inductive reasoning is – when we use specific scenarios and make generalized conclusions out of them. This is also called as cause and effect reasoning. Inductive reasoning can also be considered as a “bottom up” approach. For example, one might observe that his friend is good at studies, his friend’s older sister is good at studies and his mom’s older sister is good at studies. Inductive reasoning would conclude that - all older sisters are good at studies. Deductive reasoning is – when we make a generalized statement and back it up with specific scenarios/ information. It can be conceptualized as a “top down” approach while drawing conclusions. For example, think of a statement that - all mangoes are fruits. When you bring-up specific information like “all fruits grow on trees”, then we can deduce that all mangoes grow on trees. Inductive and deductive reasoning are crucial when we collaborate in the workplace. We keep on making inferences and bring conclusions using both the methods to make any kind of decision, generate ideas and improve processes. Examples - Inductive reasoning: • Determining when one should leave for work following traffic patterns • Deploying a new accounting process following the way users interact with that particular software • Deciding on bonus plans basis outcome of employee survey • Changing time for a training session or approach based on participant energy levels Examples - Deductive reasoning: • Developing a training pitch plan that can be effective for a specific audience • Designing the building plan of a mall and layout of shops to maximize sales • Planning out a budget and investment pattern to get the highest yield from investments • Determining the most efficient ways to get VOC from clients
-
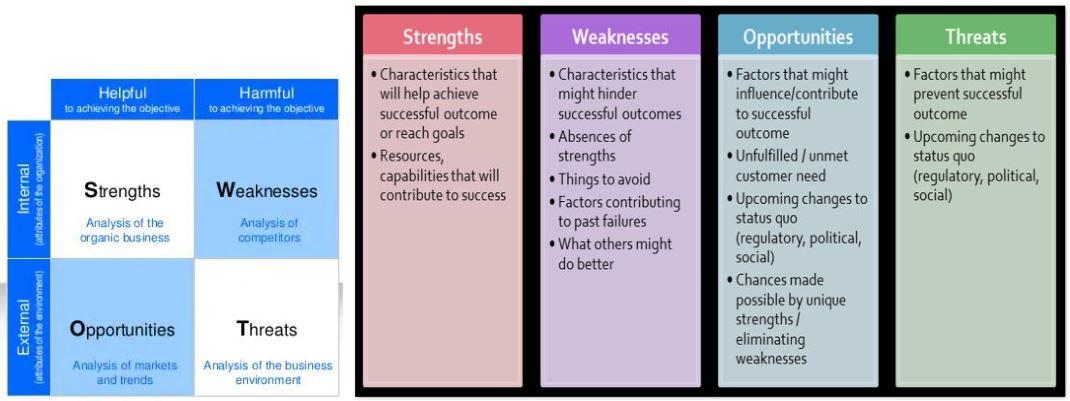
Somnath Mukhopadhyay replied to Vishwadeep Khatri's topic in We ask and you answer! The best answer wins!SWOT Analysis is a structured planning method used in business to evaluate the strengths, weakness, opportunities and threats. SWOT ANALYSIS FOR BUSINESS EXCELLENCE INITIATIVES - What can be improved? - SWOT is a very good tool for business excellence professionals to address root causes as lack of awareness, misinterpretation, less sense of urgency, no compelling reason to change, pointing the ‘what is in it for me’ syndrome, conflicting interests & priorities. Certainly these root cause are evident in different behaviors, usually active resistance, delayed or no decision, missed meetings, delays in pattern, false starts, passive resistance, vocal skepticism, disengaged team members, missed assignments and so on. How to use SWOT? - Identify strengths of the process, people and products related to the improvement initiatives. There are tangible and intangible factors with factors over which we control. ‘Control’ is the key and surrounds internal factors. It mostly means internal to the organization but when improving processes, it can be internal to a business unit, department, geographic location etc. Further, we need to look at the weaknesses of process, people and products. Weaknesses are contributing factors that can be within our control detracting from delivering value without creating more waste. Now look at the opportunities. What is the target improvement? What opportunity are we trying to capture? Why are we doing this? These questions will always help identify the primary opportunities. In traditional SWOT, the opportunities part of the analysis mostly refers to external ones. In process improvement projects/ initiatives, it can either be this or internal opportunities also. Finally we need to consider the threats. What is likely to happen if this process is not going to be improved. What will be the case, the outcome of not improving the situation. We need to be specific and detailed as much as possible. This also is (traditionally) external threats. But similar to opportunities, it can also be internal threats to the organization.

-
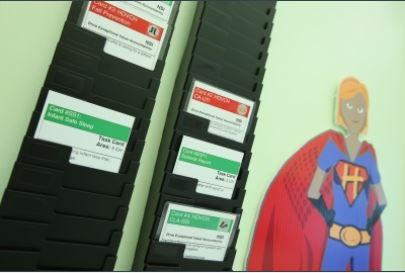
Somnath Mukhopadhyay replied to Vishwadeep Khatri's topic in We ask and you answer! The best answer wins!Kamishibai boards are popularly known as controls (visual) to conduct Audits for manufacturing processes. This method has been widely used in Toyota. There is a board and we need to place cards, which are selected at random, or may be basis a schedule designed by managers. The system makes sure that Audits are conducted with consistency, as well as ensuring cleanliness and safety of the workplace (in line with 5S method). Benefits: Communication - Managers can take a quick tour of the production floor and interact with their employees asking them simple questions and allow them to talk about what needs to be done in each part. Facilitates auditing - Audit process is simplified and improved - helping production. Inculcates values in employees - The intent is not blame anyone for making mistakes, rather help them to visualize the problem and get trained on how to solve them. It's a systematic identification process along with looking for opportunities to gain. Example from Service Industry: Kamishibai Card Rounding to prevent Hospital Acquired Infections. K-Cards is used (as a tool) in daily rounding to provide data (real time), helps improving rounding with a purpose and bundle compliance. It helps to prevent patient from the harm of hospital acquired infections. GOAL - To resolve issues related to hospital acquired conditions, help grow reliability with the elements of patient bedside care that are well known to reduce harm to patients. Use of bundles as standard work throughout the inpatient platform - will reduce preventable harm from HACs. The hospital's aim was to creatively use both process and outcome data to empower teams. But in the project early phase, it became evident that technology was a limiting factor to obtaining real-time bundle compliance data. So, leaders looked to the hospital's safety culture tools and challenged teams to round with a purpose while at the same time collecting data around bundle compliance. The Hospital team (Spectrum Health Helen DeVos Children's Hospital) made use of the lean tool - Kamishibai cards (K-cards), that provide scripting for a short interaction between staff and leadership. Supervisors organized a series of K-Cards on a board and opt at random or basis a schedule - ensuring employees maintain safety standards, keep the workplace clean and perform quality audits. At the hospital, the cards had brief statements reading like a checklist of bundle elements. Each interaction takes around five minutes and involves a component of conversation at the computer desk and at the patient's bed. These cards were meant to initiate a dialogue and to see if each bundle item on the card is compliant. While all care elements are performed correctly, the rounder recognizes the same with verbal praise - to the nurses. If an element is not completed correctly, it generates an opportunity for a discussion regarding the obstacles the nurse encountered stopping her from completing the desired care. These interactions influenced important behaviors in staff and helped to collect process data. The K-cards provided real-time compliance data and instantaneous rectification of bundle elements that were not completed. They also provide staff the ability to connect their work to safe-guard against any harm.