
Topics
-
AI News from ET - AMD to invest up to $5 billion in Anthropic; AI startup to buy up to 2 GW of chips
AMD has been seeking to expand its foothold in the fast-growing AI chip market as developers look to diversify beyond Nvidia, while Anthropic has been racing to secure computing capacity to meet growing demand for its AI services. View the full article -
A Meta Platforms lawsuit claims AI tools unfairly targeted employees for layoffs. Workers face difficulties proving AI discrimination due to limited access to internal processes. Arbitration agreements often prevent collective legal action and public scrutiny of workplace disputes. These hurdles explain the scarcity of high-profile AI employment lawsuits. Meta denies using AI for layoff decisions, stating humans made all choices. View the full article


Leaderboard
-
Vishwadeep Khatri
Administrators271Points6,711Posts -
Mayank Gupta
Members135Points679Posts -
Venugopal R
Members82Points238Posts -
R Rajesh
Members75Points160Posts


Popular Content
Showing content with the highest reputation since 10/04/2011 in Posts
-
Q1 - How would you define, compare and contrast the following terms - Personal Excellence, Process Excellence, Operational Excellence and Business Excellence? (In your answer to this question, please explore these in detail and you may like to cover the following and more - You may like to explain how these are related. You may like to mention if it is possible to achieve one in absence of another? What should an Organisation actually pursue? What kind of approaches, techniques do you think are naturally likely to be included in these terms, etc.) You may like to carry out research over the internet, talk to your partner, and colleagues while framing your response. Each club may submit maximum two responses, one by each member. Please write the answer in your own words. Please do not copy and present someone else's explanation as your own. As Excellence Enthusiasts, we are against plagiarism. Note for website visitors - Two questions are asked every week on this platform. One on Tuesday and the other on Friday. All Questions so far can be seen here - https://www.benchmarksixsigma.com/forum/lean-six-sigma-business-excellence-questions/ Please visit the forum home page at https://www.benchmarksixsigma.com/forum/ to respond to the latest question open till the next Tuesday/ Friday evening 5 PM as per Indian Standard Time. The best answer is always shown at the top among responses and the author finds honorable mention in our Business Excellence dictionary along with the related term.10 points
-
Excellence : Excellence is defined as the quality of being extremely good So what is Personal excellence? In simple words, setting up the bar higher [benchmark] in whatever activities, the individual(who is compared with the rest) does. Process Excellence: Providing an environment where the processes are highly stable and controlled with a minimal or no variation and with minimum or no wastage(Muda). Focus is on continuous improvement to ensure processes are highly stablized Operational Excellence: It reflects the way how as a person, unit, you or your team/organisation excel at parameters such as Cost, Human Resources, scope, time, quality etc.,. By excelling at this, the provider of a service, can provide value to the customer with optimal/maximum efficiency. Business Excellence: It is through which you make your business, with effective strategies ,efficient business plans , best business practices so that optimal results are achieved at a sustained rate. How each one is related to the other one(s): Personal Excellence is directly tied to Process Excellence. If and only if the individual is interested to adhere to the processes laid out, then process excellence or for that matter any other activity can be successful . If the cultural shift/mindset is not there amongst the individual/team , then no change would work. This can be represented by the formula : Quality of the solution (Q) * Acceptance of the solution (A) = Effectiveness of the solution (E). Unless there is an acceptance to any thing (which is the human part) nothing can be done. So if the individual has the desire to excel at his/her work, then he/she would strive to make sure he/she/the organization achieve Process Excellence. Process Excellence provides a way for continuous improvement. Purpose of process excellence is to streamline all the processes , make them stable and in the process to achieve minimal degree of variation and minimal wastage. By having a process excellence system in place, grey areas in Operational excellence and Business excellence can be identified and improved/rectified upon. Practically it is difficult to achieve excellence in one when another one is absent. For instance, Business and Operational excellence would require process improvements. If streamlining does not happen there then there is no excellence in Business and in Operational aspects as well.Similarly without human intervention or the elevated mindset of the individual, it becomes difficult to successfully run the processes at a top-notch. From an organisation perspective, the organisation should Provide a conducive environment to work with wherein by individuals can be encouraged to share their ideas/thoughts and create a transparency, making them feel belonging to the organisational/unit's problems/constraints (Personal Excellence) Encourage individuals to showcase their creativity in designing/providing solutions to problems (Personal Excellence) Create Challenging contests and rewarding people on various categories such as best creativity,best solution, optimal solution,... (Personal Excellence) Setup process standards and metrics for each parameter(Define the expectation).Set the Upper & Lower limit & also customer specification limits (Process Excellence) Conduct awareness sessions on process expectations with reasoning and justifications. Provide details with SMART goals (Process Excellence) Ensure that individuals/teams adhere to the standards with constant monitoring through Audits/Inspections/reviews. (Process Excellence) Look out for scope for continuous improvements periodically and accordingly adjust the process baseline if required. (Process Excellence) Define the Operational parameters that requires excellence. (Operational Excellence) Conduct awareness sessions to key stakeholders on those operational parameters and provide the plan on when and how to achieve them (Operational Excellence) Ensure the status of operational excellence through Project Management Reviews/status reports and other similar artefacts and address the deviations (Operational Excellence). Preserve the best practices that were followed to achieve Operational Excellence (Operational Excellence) Define the strategies/plans needed for improving the business results (Business Excellence) Define the best practices in getting business-oriented goals/activities done (Business Excellence) Conduct Confidential meeting with key stakeholders and provide the envisaged plan to them and convey your expectation (Business Excellence) Conduct monthly/quarterly review meetings with respective units and look onto the 4-quarter dashboard. (Business Excellence) Get Business Mgmt section of Customer Satisfaction Survey from the customer to see if organisation is in target with its objective (Business Excellence) Document the outcome of the business results and the effective means to achieve them (Business Excellence)9 points
-
7 pointsCause is a variable which affects the outcome by increasing its chances or making it happen. Problem is the outcome of the cause. Scenario Understanding Conclusion Action A cause (X) may be necessary but not sufficient for a problem (Y) to occur. Problem (Y) occurs ONLY when cause (X) is TRUE Problem (Y) may not occur even when the cause (X) is TRUE Causes other than X (A, B, …) must occur together with X for problem Y to occur Fix the cause (X) to remove one of the factors causing the problem (Y) however this will not fix it so look for other causes (A, B, ..) that result in this problem (Y) and address them too to fix the problem (Y). A cause (X) may be sufficient but not necessary for a problem (Y) to happen. Problem (Y) occurs whenever cause (X) is TRUE Problem (Y) can occur even when cause (X) is not TRUE Cause X is a definite cause for the problem (Y), however other causes (A, B, … ) can also result in this problem (Y) Fix the cause (X) to address some scenarios in which the problem (Y) occurs. However look for other causes (A, B, ..) which may also result in this problem to fix it for all scenarios. A cause (X) may be neither sufficient nor necessary for a problem (Y) to occur. Problem (Y) may not occur even when cause (X) is TRUE Problem (Y) can occur even when cause (X) is not TRUE Cause X is not established as a reason for the problem (Y) Fixing cause (X) may not fix the problem (Y). Look for other causes (A, B, ..) which are likely to be more relevant cause for this problem (Y) A cause may be both sufficient and necessary for a problem to occur. Problem (Y) occurs ONLY when cause (X) is TRUE Problem (Y) occurs whenever cause (X) is TRUE Cause X is a definite cause for problem Y Fixing cause (X) may fix Y completely.7 points
-
7 pointsMost of the textbook definitions of Six Sigma talk about Six Sigma being a strategy, methodology, metric, philosophy etc. There is another definition that I use in my training programs frequently. Lean Six Sigma provides you with world best methods of data driven decision making. If you are working in an organization or running a business, it is inevitable that you shall need to use data in decision making. Some pointers that highlight the importance of data driven decision making are given below. Even if one uses brainstorming techniques with teams, one can generate and use data.The use of basic cause-effect approaches for analysis like fishbone diagram get strengthened only by effective use of data.All functions in an organization generate data of various kinds. It makes sense to learn correct methods and techniques that help in decision making for business success.Analysis of wastes in a process requires data (like cycle times, takt times, value added time, non value added time, productivity, etc)Finding whether internal/ customer requirements (or regulatory requirments) are met requires data driven techniques like hypothesis testing.Forecasting methods are essentially a set of data driven techniques.Comparison of two or more sets of data( for comparing vendors, technology, techniques, materials, processes, customer types, teams etc) is a common need.Market research or R&D makes us of data all the time.Problem Solving is strengthened by usage of data.Project Management requires data driven decisions.Performance management cannot be considered fair unless data is capured, analyzed and used properly.To get more ideas on how Lean Six Sigma is useful in a specific Industry or Functional area, please make use of tags present at the top right section (found after clicking on forum tab above).7 points
-
At our e-commerce product company, we have an AI powered search and recommendation engine feature. It can be configured on each customer project to leverage multiple data sources (ERP, e-commerce, PIM, purchase history) to personalize search and product recommendations. Personalization features include adjusting results based on purchase history, brand preference, and customer profiles. Our learning has been The recommendation engine can personalize shop assortment for different customer segments. While designing customer flows for this feature, we must ensure that the engine does not unintentionally limit catalog visibility or surface exclusive categories disproportionately. If historical purchase data, browsing patterns, or segment profiles reflect societal biases (e.g., preferences along gender, age, ethnicity, or socioeconomic lines), the algorithms can and will replicate and propagate these biases—such as recommending certain products less to some demographic groups or showing limited assortments. Segment-based catalog restriction could reinforce silos and limit choices for certain customer groups, mirroring or reinforcing pre-existing marketplace or data biases. Customizing algorithmic weighting based on customer profiling without scrutiny could favor or disadvantage groups. We had a real example of a sports attire retailer using our product where we experienced that “Inclusive Sizing” (sizes beyond standard American XS–XL, such as plus sizes or petite/tall fit) appeared in only about 10% of products in a given search result. The dynamic facets logic tended to omit these size attribute from the filters entirely. As a result: Customers seeking inclusive sizes were unable to filter effectively. The represented bias favoured mainstream size ranges, thus marginalizing niche segments. The system then further skewed visibility toward products that align with majority sizing, and had potential to worsening representation over time. Some real world complains from users were - "I can never find anything smart with a good price in my size unless they are your top-of-the-line products" - "I see models wearing new designs in the ads but I can't find enough trendy but age-appropriate colours on the website" Additionally, one real risk that was evaluated was that our model/engine might consistently push popular products from high-traffic regions, while under-representing niche or emerging markets. This not only skews visibility but may also limit growth opportunities for less dominant segments. Some steps that we have attempted to apply Design Phase - Curate diverse and representative data inputs - Allow manual overrides for known critical attributes and for attributes deemed socially or commercially significant (e.g., inclusive sizing, accessibility features) were treated as “defined facets,” ensuring consistent visibility regardless of prevalence. - Ethical guardrails in personalization logic: Forbid certain features (like region or size) from driving recommendation weighting unless justified. Testing Phase - Synthetic Test Profiles across demographics - Manual Testing to find if the engine is developing such biases Monitor and Audit Facet Presentation - Track which facets are consistently hidden across queries and evaluate whether they represent systematically underrepresented groups or product lines - Before releasing compliance review is emphasized on Legal, Privacy(GDPR), Security & Accessibility These proactive steps are now taken on early and help ensure our AI serves all buyers fairly, avoiding the “bias in, bias out” trap in new implementation projects.6 points
-
I suppose everyone agrees that if one is not good with numbers, career growth is likely to face a serious roadblock at one stage or the other. I have noticed several people who fear mathematics and this leads to certain problems in learning or applying Six Sigma. Many have already given up hope assuming that they can never cover up. Good news, however is that this weakness can be addressed by most people. It definitely needs a persistent effort to capture Mathematics concepts that are really important. Some of these are Algebra, Data Handling, Decimals, Equations, Exponents and powers, Fractions, Graphs, Integers, Mathematical modelling, Mathematical Reasoning, Probability, Proportions, Ratios, Rational Numbers and Statistics. If you are one of those who felt this way and wish to improve your math, I can provide you a step by step approach which shall broadly follow the sequence below. Plan study time for these topicsUse the uploaded materialStudy identified topics and answer questions provided in the text. Check your answers with answer key provided.Conquer your weakness and face the Six Sigma world more confidently.In case good number of people see value in such a sequence, I shall be putting in extra effort and make the content and sequence available to you free of cost. I have written this post just to know whether there are many people out there who really wish to use such content and approach. Reply to this post showing your interest so that I can view the count. Best Wishes, VK6 points
-
While ChatGPT warns about the inaccuracies, some people tend to follow ChatGPT's responses for questions that are not straightfrward. This is a risky approach. Have a look at the following chat to understand more. Now this error is not a small one. I explored further Of course, Google Maps is not a ride-hailing service. So, I continued. The takeaway - ChatGPT is not a reliable tool for questions that are not straightforward.


 5 points
 -
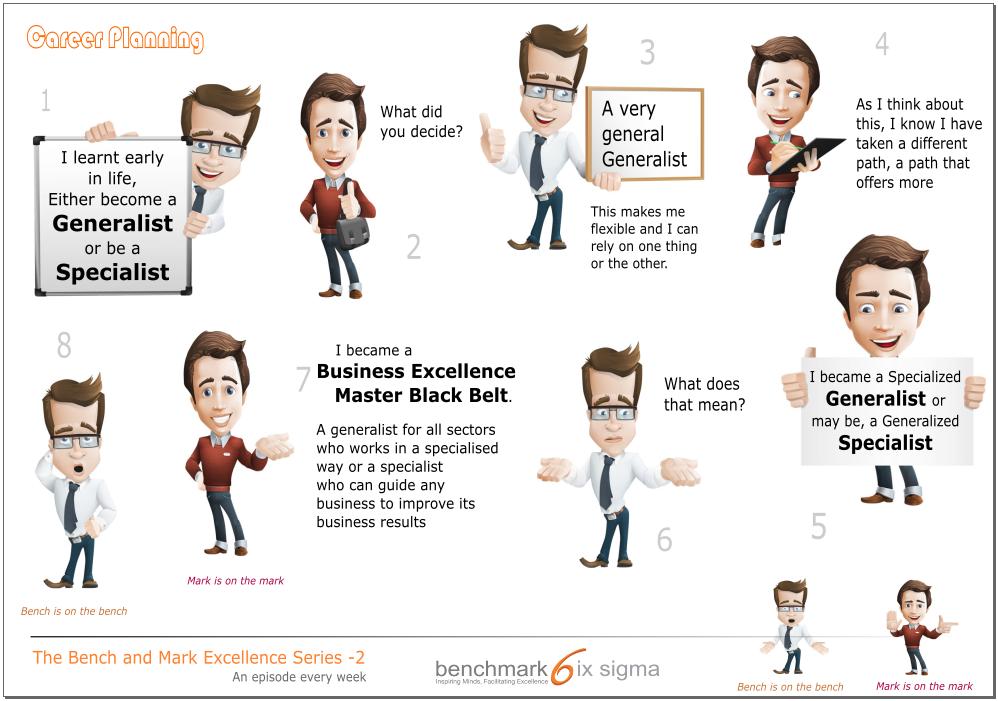
5 pointsDescription - Bench happily highlights that while planning his career, he had considered the choice between being a Generalist or a Specialist early in his life. Mark wants to know about the decision that he took. Bench says that he decided to keep options open for himself and proclaims himself as a "very general Generalist". After listening to Bench, Mark says that he has realized that he has taken a path different from the two options. He considers himself as a "specialized Generalist" or what can be considered as a "generalized Specialist". Bench want to understand what this means. Mark explains that he is a Business Excellence Master Black Belt. He calls himself a generalized Specialist as he specializes in problem solving which he can do in any sector. He further explains that he could be considered a generalist too as he can work with large variety of processes but in a specialized way. This cartoon depicts that Lean Six Sigma and Business Excellence competencies allows one to be specialized without dependence on a specific industry or functional domain.
 5 points
 -
5 points5 pointsMisuse of tools and techniques is a very common phenomenon. Misuse of a tool primarily happens because of two reasons 1. Intentional Misuse (it is better to call it as Misrepresentation) 2. Unintentional Misuse (due to lack of understanding of the concept) Pareto analysis or the 80/20 rule is a prioritization tool that helps identify the VITAL FEW from TRIVIAL MANY. 80/20 implies that 80% of problems are due to 20% of the causes. Intentional Top 20% causes might not be the ones leading to bigger problems - usually it is observed that causes with smaller effects occur more often. Applying the Pareto principle will divert the focus of the team to the causes that have a smaller effect on the customer while the actual cause might be languishing in the trivial many Prioritization without keeping in mind the goal - Pareto will help if the significant contributors identified help us achieve the goal. However, it is seldom checked whether the VITAL FEW will help us achieve the goal or if there is a need to take a larger number of causes. As an example, if our goal is complete defect elimination, we will need to consider all causes. If our goal is elimination of 95% defects, we will need to cover more of the cause. Unintentional Going strictly by the 80/20 rule - some people take the 80/20 principle in the literal sense. They will do a Pareto plot and blindly apply the 80/20 principle. What needs to be noted is that 80/20 is a rule of thumb and it is not necessary to always have 80/20 split. It could also be 70/30 or 90/10 Keeping the total to 100 = 80+20. This is one of the most common misunderstanding of the 80/20 rule where one beliefs that the sum should always be 100. It could be 80/15 or 75/25 as well Unclear about the purpose of using a Pareto Analysis. Pareto can be used while defining afocus area and also in Root Cause Analysis to identify significant contributors. In the former, data is for problems and their occurrence while in the later, it is causes and their occurrence. Due to lack of clarity of purpose, if problems and causes are clubbed together in the same Pareto, then meaningful inferences cannot be drawn. Treating Pareto as a non-living tool - Pareto is usually done once and the same result is treated as sacrosanct for a long period of time. Pareto chart only provides a time snapshot. Over a period of time, the defect categories or causes and their occurrence numbers might also change and hence if Pareto Analysis is done at different points of time, it might yield different results Some that could fit in both categories Small data set - Pareto Analysis will help if you want to prioritize vital few from a big data set. Doing a Pareto analysis on 4-5 categories will seldom yield a good result Completely ignoring the trivial many - Pareto analysis helps identify the vital few but it does not say that one should ignore the trivial many. It simply states that first fix the vital and then move on to trivial. However, most people consider that if they fix the top 20%, they do not need to work on the remaining. Pareto can be used to continuously improve the process by repeatedly prioritizing the causes that you need to focus on Doing Pareto at a high level only - Like most of the tools in Root Cause Analysis, Pareto can also be used to drill down. E.g. Pareto can be done first to identify the top defect categories and then a second level Pareto can be done for the top defect categories (using the causes)5 points5 pointsBy and large, we come across situations where we favor the mean value of the outcome of a process (central tendency) to be focused around a specified targeted value with as less variation as possible (dispersion). There are situations where the variation assumes relatively higher importance than the central tendency; mostly because higher variations are more intolerable than some shifts in central tendency. Interestingly, there may be certain situations where variation or controlled variation is advantageous as well. Study of Process Potential: The process potential index Cp is used to study the variation, or spread of a process with respect to specified limits. While we study process potential, we are interested in the variation and not in the central tendency. The underlying idea is that if the process is able to maintain the variation within specified limits, it is considered to possess the required potential. The centering of mean can always be achieved by setting adjustments. Or in other words, if Cp is not satisfactory, Cpk (process capability) can never be achieved, since Cpk can never exceed Cp; it can at best equal Cp. Many examples where the variation is generally considered unfavorable to the outcome: 1. Analysis of Variance While evaluating whether there is a significant difference between means (central tendency) for multiple sets of trials as in ANOVA, the variation between sets and within sets are compared using F tests. Thus in such situations, the variation comparison assumes high importance. 2. Relative grading systems For many competitive examinations, the concept of ‘percentile’ is used, which is actually a relative grading system. Here, more than the absolute mark by a student, the relative variation from the highest mark is more important, thus the relative variability becomes key decisive factor. 3. Control chart analysis While studying a process variation using a control chart, first the instability and variation are given the importance. Only if we have control on these parameters we will be able to meaningfully study the ‘Off-target’ i.e. the central tendency. 4. Temperature variation in a mold While performing certain compression molding process, temperature variation across different points on the surface of the mold does more harm than the mean temperature. Here the mean temperature is permitted to have a wider tolerance, but the variation across mold does more warping of the product. 5. Voltage fluctuations Many electrical appliances get damaged due to high variation (fluctuation) in the voltage, although the mean voltage (central tendency) is maintained. Controlled variation is favorable: 1. Load distribution in a ship While loading a ship the mean value of the load can vary, but the distribution of the load is more important to maintain the balance of the ship on water. 2. Science of music Those who understand the science of music would agree that more than the base note, the appropriate variation of the other notes with respect to the base note is extremely important to produce good music. Some examples where variation is favorable: Systematic Investment plans (SIPs) take advantage of the variation in the NAVs to accumulate wealth. Here even an adverse shift of the central tendency is compensated by the variation! Law of physics states that Force = Mass x Acceleration (F = ma). Thus, if we consider speed as the variable, it is the variation of speed that decides the force and the mean speed (central tendency) appears to have little relevance.5 points5 pointsGeneric Definition: Necessary means something needed. Sufficiency - an amount of something that is enough for a particular purpose 1). A cause may be necessary but not sufficient for a problem to occur: This means that the problem did/do not arise because of a single cause. There could be multiple causes which could lead to the problem Eg: An Application running in the system is responding very slowly. We could think that it could be due to less memory space in hard disk/RAM . But it may not be the only reason. It could be due to too many applications opened up thereby busying the CPU. It could also be because of some heavy processes running in the background or any other reasons. So our approach should be: a). To find out what other causes could be there which can make the problem to occur. b). Do try to drill down with 5-Why analysis or tree analysis of the problem or make Fishbone analysis and find out the other causes/category of causes. 2). A cause may be sufficient but not necessary for a problem to happen: This implies that a particular cause can be a potential source for the problem to occur but not necessarily be the primary one which will create the problem. Eg: If System "Welcome Screen" (logging in) taking time is a problem, then increasing the RAM size may be useful but it may not necessarily be increasing the speed as still the Processor CPU/Processor Speed(Frequency) could need to be addressed. There could be some more ways which can make this speed increased to Our approach should be : a). Find out the ways to have necessary conditions and satisfy sufficiency 3). A cause may be neither sufficient nor necessary for a problem to occur This portrays the fact that you are aware of the causes and have sufficient and needed information to resolve.But still there is a better workaround to ensure that problem does not occur Eg: You/Your organisation has technical challenge on Non Functional requirements and you think you know the causes and has sufficient and needed knowledge. However It will take 2 months of time for your team to complete this . But management outsources this to expedite this activity. So the approach should be a). To make effective use of the alternative method/approach that is being planned out for the problem. 4). A cause may be both sufficient and necessary for a problem to occur This means that initial assumptions are made on the necessity and sufficiency of causes, for a problem. Eg: If the problem is the smelling(bad odour) of Septic tank of the house, then immediately the assumption is made that the tank could be full and hence the smell is arising. So our approach would be : a). To validate as much as you can to ensure that the assumptions made are true. If not, then course correction needs to be done b). Depending on the assumptions , we need to proceed. If assumptions are false, then follow one of the approaches from the remaining 3 options/conditions5 pointsCreating an idea is personal excellence. Creating efficient process for that idea is process excellence. Executing that idea effectively is operational excellence. Gaining profits through that idea is business excellence.5 pointsIn 2022, Klarna launched a full-speed AI deployment automating most of its processes using AI solution and realized cost savings equivalent to 700 FTE. One of the processes they automated was their Customer Service Support. After a while, customer complaints and dissatisfaction ballooned. Customers claimed that AI responses were too generic and unhelpful when dealing with real-life problems. While AI solution like chatbots can handle simple and repetitive queries, emotions or complex issues were not addressed. Klarna realized that while AI solutions promise speed and cost savings, it can compromise service quality and customer satisfaction. Klarna decided to rehire employees to address poor service quality and customer complaints. This is a testament that AI solution isn’t about replacing humans, but rather, enhancing the human workforce with smarter tools and better support system. As an MBB, following were my recommendation: 1. Use VOC to identify critical customer requirements (CCR) where complex issues and customers needing to talk to human to solve their concerns will surface. 2. AI solution aims to enhance customer experience leveraging on personalized interaction for higher engagement. This was not apparent in case of Klarna. It is recommended to take advantage on Deep Learning capabilities of AI solution. Such model can identify complex patterns, making it suitable in image recognition, voice recognition, and natural language processing. 3. Lastly, while drawing the to-be process map, HILT (human-in-the loop) principle is recommended. In cases of complex customer concern, AI can escalate the concern to its human counterpart to further assess the given concern and provide necessary resolution.4 pointsAccording to what VK noted under his forum questions, “Some people seem to be using AI platforms to find forum answers. This is a risky approach as AI responses are error-prone..” AI is created by humans who are prone to error. We must always remember this and be diligent to make sure AI will make the best decisions. “Making sure” will ALWAYS to be and, I believe, will forever be, a human responsibility. I can’t ever imagine anyone shirking their responsibility and pointing at the AI solution and saying “It’s the AI’s fault that we lost revenue”. Yes. It might have been that we trusted the AI agent to make the decision but ONLY after we allowed it to make that decision. So, the real accountability still falls back to a human. Knowing that AI is prone to make errors, just as humans have done to mitigate making our own errors, we created guardrails to increase proper decision making and better outcomes – ergo, Business Excellence. Think of AI as another person. But now you are responsible for the decisions and actions of that person. It will need oversight, accountability, and transparency to make sure AI is making the right decisions on our behalf. Here are some of the elements that I think could be included in a governance framework to ensure responsible, high-impact use of AI in a process-driven organization. Creating a governance team or committee to oversee all AI solutions. This team would comprise people from IT, the business, legal, risk management and defining each role and responsibility throughout the AI development, deployment and maintenance. For transparency and accountability, conducting regular impact assessments to identify potential risks, biases and consequences of AI-driven decision. Also, implementing techniques that can provide insights into the how AI is making its decisions, such as feature attribution or model interpretability methods. Lastly, performing audit trails that let us see the data inputs, processing and outputs the AI used to make its decision. For agility and control, using agile development methodologies to allow for rapid iterations and deployment. Using change management to capture the all the changes made throughout the development which can easily be reviewed, tested, and validated. Lastly, establish access controls to prevent unauthorized changes to the AI system or data.4 pointsProposed Business Excellence Metrics for the AI Era - The use of AI in the core business processes is reshaping how value is created and delivered by organizations. Subsequently, the traditional KPI metrics we have used to measure performance in areas like quality, cost, and efficiency are becoming insufficient and redundant. Using these old metrics in an AI-driven environment can be misleading, causing organizations to optimize for the wrong behaviors and not reap ROI on their technology investments. Let us begin by assessing the Traditional metrics and their shortcomings in an AI driven environment. 1. Assessment of Traditional Metrics Metric 1: First Call Resolution (FCR) It has long been a primary KPI to monitor contact center efficiency and customer satisfaction, indicating a low effort experience for the customer and low cost for the business. In an AI-Driven Environment: Using AI-powered chatbots, IVRs, and self-service portals to manage simple, high-volume, transactional queries is an attempt to give the “Easy” Calls today to machines instead of humans. These were precisely the calls that used to be FCR wins for human agents. By filtering simple issues, AI is ensuring that the only calls reaching human agents are the complex, emotionally charged, or multi-faceted problems that the AI could not solve. And it turns out that these problems are more difficult to solve in one phone conversation. Following these developments, a high FCR rate might actually be a concern! It could potentially indicate that the AI is not being effectively used to screen issues, or human agents bring complex problems to a premature close just to attain an outdated target. While a lower FCR could signify that agents are appropriately handling the highly complex issues that require follow-up, research, and collaboration. Metric 2: Average Handle Time (AHT) AHT measures the average duration of customer interaction. It has been a pivotal metric in gauging operational efficiency, used for staffing models and cost control. The goal has always been to reduce AHT. In an AI-Driven Environment: Since the calls that are able to reach human agents as mentioned above are likely to be important ones. We shouldn't be obsessed with how soon the agent can get the customer of the phone but rather with what quality and value is one giving. A complex issue, high-value customer retention or an upsell opportunity might require a longer AHT. Stressing agents to cut AHT on complex calls can have detrimental effect not only with regards to poor outcomes, customer churn, and repeat calls (which negatively impact other metrics). The AHT metric also disregards entirely the time customers may have already spent interacting with an AI chatbot, rendering the “AHT” only a partial — and potentially misleading — view of the overall customer journey effort. 2. Proposed New Metrics In order to track performance in an AI-driven setting, we need new metrics capturing proactive problem-solving, and the utility of human-AI interaction. Proposed New Metric 1: Proactive Resolution Rate (PRR) PRR is the ratio of potential customer issues that are identified and resolved proactively by the AI system before the customer initiates contact. PRR Logic o The AI tracks customer journey data, usage patterns, and system logs for anomalies that indicate there is a problem in the process (e.g., missed payment, delayed delivery, odd user behavior in a software application). o The AI then initiates an automated resolution using the SOP’s, FAQ’s and KB updates to assist the customer (e.g., retries the missed payment, informs the logistics partner, proactively sends a "how-to" guide, or sends a system alert to the user). o PRR Calculation: (AI-initiated Proactive Resolutions / Total potential issues detected) x 100 · This metric, most importantly, switches the mindset away from reactive service and illustrates the value of preventative excellence. It captures a measure of the organization's ability to avoid problems, which is a far stronger indicator of operational excellence and customer-centricity than how effectively it cleans up messes. Proposed New Metric 2: Human-Assisted Value-Add (HAVA) · HAVA Score is a metric for evaluating the efficacy and efficiency of human agents involved in complex situations escalated by AI. The HAVA Score replaces the use of simplified metrics like AHT and FCR for these high-value encounters. · HAVA Logic: The HAVA Score is calculated after the interaction and based on a weighted calculation of the following: Problem Resolution Success (40%): Was the customer's issue ultimately resolved? (Binary: Yes/No, or a scaled rating). Customer Sentiment Analysis (30%): AI parses the text or audio of the communication to measure customer sentiment levels (i.e., measuring if the customer's levels of frustration decreased, positive language increased, etc.) Customer Lifetime Value (CLV) Impact (20%): Did the interaction led to customer retention, a new purchase, or an upgrade, this can be done by mapping the service interaction to CRM data. Knowledge Base Contribution (10%): Did the agent record the solution for this unique problem, so it could be used for training the AI in the future? (thus helping avoid similar escalations). · HAVA provides a path away from basic efficiency and instead reflects the true value of the human agent in the world of AI. HAVA rewards agents to be thorough and empathetic problem-solvers. HAVA also promotes a learning cycle in which the agent is incentivized to make the AI smarter through KB updates, contributing to the improvement of the system over time. 3. Linkage to Business Excellence These proposed metrics are directly aligned with the core principles of Business Excellence. Business Excellence Principle How Proposed Metrics Align Customer Centricity PRR is a measure of an organization’s ability to solve problems before the customer even knows about them, it is the most efficient form of customer-centricity and true commitment to an effortless experience. The HAVA Score ensures that when customers do need to talk to a human, the focus is all about solving their complex needs and maintaining the relationship that impacts their perception of value and care. Operational Excellence & Quality Improvement PRR actively measures the quality of operational processes. A high PRR means that the underlying systems and processes that are driving the standard approach we work towards, are efficient, intelligent and self-healing, which is an essential component of modern operational excellence. The HAVA Score assists and develops an environment for continuous improvement. Agents are rewarded for contributing to a knowledge base, ensuring human knowledge is captured, and then used to build up the overall human-ai capability to get smarter and smarter, and to be able to do more at scale over time. Employee Engagement & Empowerment HAVA, also enhances the human agent's role from "call handling" to "resolution expert or relationship builder." It enables and rewards them for spending time in solving complex issues whilst creating value - leading to higher job satisfaction and lower turnover. It recognizes and rewards the value of empathy, creativity and complex problem solving that are inherent to being human. Value-Driven Leadership With these metrics available to leaders, they can get a clearer and more informative view of their business performance. Instead of managing counterproductive metrics, they can focus on the real priorities: stopping customer issues before they occur, getting the most value for each human engagement, and designing a learning system that continuously improves with every transaction.4 pointsReminds me of an old saying - "Nakal ke liye, Akal ki bhi zarurat hot hai"4 points4 pointsGrubbs test is a statistical method used to find the outlier in the data range. Also, this test is used to find a single outlier in a normally distributed data set. This test is used to find if the maximum or the minimum value is an outlier in the given data range. Definition - Hypothesis of Grubbs test: Ho - There are no outliers in the given data set Ha - There is only one outlier in the given data set Test Statistic for the Grubbs' test - Y¯ represents sample mean and s represents standard deviation, the Grubbs test statistic is the largest absolute deviation from the sample mean in units of the given sample’s standard deviation. This is a 2-sided version of the test, the Grubbs test can also be defined as one of the following one-sided tests, 1. Test whether the minimum value is an outlier, 2. Test whether the maximum value is an outlier, Grubbs Test Example: Range given - 199.31, 199.53, 200.19, 200.82, 201.92, 201.95, 202.18, 245.57 Firstly a normal probability plot was generated, This plot indicates that the normality assumption is reasonable except for the maximum value. We, therefore, compute the Grubbs test for the given case to find whether the maximum value of 245.57, is an outlier or not. Test Results, H0: there are no outliers in the data Ha: the maximum value is an outlier Test statistic: G = 2.4687 Significance level: α = 0.05 Critical value for an upper one-tailed test: 2.032 Critical region: Reject H0 if G > 2.032 Hence we conclude that the maximum value is in fact an outlier at 0.05 significance level. Boxplots are used to graphically display different parameters briefly. Among other things, the median, the interquartile range, and the outliers can be read in a boxplot. The data used must have a metric scale level. Such as a person's age, electricity consumption, or temperature. How to interpret the boxplot? The box indicates the range in which the middle 50% of all values lie. Therefore, the lower end of the box is the 1st quartile, and the upper end is considered the 3rd quartile. Below q1 lies 25% of the data, and above q3 lie 25% of the data. In the boxplot, the solid line represents the median whereas the dashed line represents the mean. The T-shaped whiskers in the boxplot are the last part, which is within 1.5 times the interquartile range. This means, that the T-shaped whisker is the maximum value of your data but at most 1.5 times the interquartile range. Therefore, if there is an outlier, then the whisker goes up to 1.5 times the interquartile range. If there is no outlier present in the data, then the whisker is the maximum value. Hence, the upper whisker is either the maximum value or 1.5 times the interquartile range. Depending on which value is smaller. The same applies to the lower whisker as well, which is either the minimum or 1.5 times the interquartile range. Points that are further away are considered outliers. If no point is further away than 1.5 times the interquartile range, the T-shaped whisker thus gives the maximum or minimum value. Box Plot Example: Range - 199.31, 199.53, 200.19, 200.82, 201.92, 201.95, 202.18, 245.57 From the above example it’s graphically visible that the data value of 245.57 is not falling within 1.5 times the interquartile, hence it’s an outlier. Conclusion – I would prefer a box plot to find the outliers in normally distributed data range, since its less complex and easy to easy to understand because of its graphical representation. Thanks.
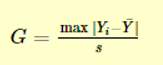
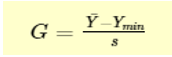
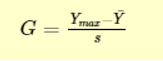


 4 pointsWho does not like a pat on the back!! We also like it and hence we would like to hear from you. Your positive feedback helps us stay motivated and continue to deliver excellent workshops. Please click on 'Reply to this Topic' and share the comment that you want to be displayed on this forum as your positive feedback? We value your opinion!!!4 points4 pointsThe following Japanese words related to “handling of manpower” in production process according to the organizational requirements; Shojinka: This is the Japanese word that originated from the lean manufacturing principles of Toyota. When we translate from Japanese to English, it gives direct meaning of “Various people”, shortly it can be “Vary people". i,e Flexible manpower lines maintain productivity with fluctuating demand. Shoninka: It means “Manpower saving”, by providing machines / equipment in order to free one or two operators: Shoryokuka: It means “ labour savings” partial removal or combining two operations by automation to support the process Productivity = outputs/ inputs i.e it is a measure of efficiency of production line. More often the Shojinka is defined as having to main categories; first, the workers are multi skilled and they can perform in multiple workstations at a time in a production line. The second is, the line should be designed in a way to accommodate or vary people based on the fluctuating customer demand. In simple words; Shojinka can be defined as “ability of a production line can be balanced when the production volume goes up or down" Demand Vs Supply: Shojinka techniques developed based on the Demand Vs Supply and no excess production as they considered as an inventory by deploying flexible machines and man powers. Capacity planning is the process of determining the production capacity needed by an organization to meet changing demands for its products. The capacity is normally developed based on takt time: Takt time: Available production hours per day / customer demand per day (Generally it is calculated on annual basis with full speed of line capacity). When the demand fluctuates, the organizations have some broad questions; · How to absorb the fluctuations in demand that will occur over next 12 months? · To what extent should inventory be used for this purpose · Can demand fluctuations be met by varying size of workforce (Shojinka?) · Why not absorb the fluctuations by changing activity rates and varying work hours( overtime) · Why not outsource to maintain a stable work force and let suppliers change activity rates to absorb demand fluctuations? · Will the organization lose orders if doesn’t meet all demands? Should the organization adopt this policy? Each of these choices determine the moves of the organizations. The organizations will adopt basically three strategies of planning to managing supply · Chase strategy: - when demand fluctuates, the organizations should adjust the capacity to match the demand as close as possible. E.g seasonal business demand like sale of apparels during festivals · Level strategy: - a firm maintain constant capacity over a period of time, irrespective of fluctuations in demand; e.g When more investment or skilled labour required, this strategy will apply · Mixed Strategy: Individual firms devise infinite combinations of the above strategies based on the situation. Shojinka is suitable to apply when organization adopts chase strategy. Flexible manpower line: The production line is designed in such way to meet the changing production requirements: Before designing of any production capacity, the following parameters to be considered; Takt time : Net production time / Customer demand Cycle time : Net production time / No.of Units produced No. of stations / Operators: Cycle time ( Work content) /Takt time In the competitive market, the organization has to prepare some strategy to prevent the business loss and shojinka is a solution for the flexible manufacturing; Calculating Manpower / machines: The following formula will help us to determine the manpower / machine requirements to meet the demand; Overall cycletime / Takt time = Manpower / machines Cycle time is the sum of the processing time to complete one unit of assembly Examples: Case: 1 Overall cycle time: 240 secs Takt time: 80 secs No of manpower = 3 So, we can use the manpower formula and assign no. of operators based on the demand Case: 2 When demand goes down, we can remove the manpower and he can be used in other machines/ assembly lines; Overall cycle time : 240 secs Takt time : 120 secs No of manpower : 2 When the demand low, we reduce 30% manpower and two manpower will produce the output to meet the low demand. Shojinka demands employee training, multiskilling to manage / operate different machines / practical standard operating procedure in place for flexible manpower line. Advantages of Flexible manpower line: · Avoid overproduction · Better usage of capacity · Smooth material movement · Kaizen culture Disadvantages of Flexible manpower line: · Design of production process is complicated as the forecast are not realistic · Require high skilled operator · Not suitable for small, medium size industries Conclusion in my purview: At the present time, most of the industries look for outsourcing when the demand peaked up. The peak demand may not be long-lasting, as the demand lows they withdrawn the order from the supplier. This will affect the supplier relationship in long term. However, organization should design flexible manpower line to the peak volume and if the demand is lower, the assigned manpower can be used in another production area, provided if they are competent. But practically it is complex in real time production situation. Industries, normally extend their work hours to meet the peak demand and cut off the extra hours if the demand goes down. If the forecast is realistic, the cell design is flexible to manpower, Shojinka is a best tool to apply.4 points4 pointsKaizen : It is a combination of two Japanese words , kai and zen . Kai means “Change” and Zen means “for the better” resulting in the meaning as “Change for the better”. It refers to any continuous improvement done in workplace, using small incremental changes Kaikaku: It is the Japanese term for ‘ radical change’ . It talks about the fundamental cum radical changes that we make to the system, in which we are working Kakushin: In Japanese it means ‘Innovation’ . It talks about the fact that changes done in the system (that we work upon) can sometimes lead to a paradigm shift in the working of the system such that that we need to realign our thinking to be more innovative S.No Kaizen Kaikaku Kakushin 1 Focuses on elimination of waste (Muda), Productivity improvement and Over hard working of employees (Muri ) with small continuous improvements Focuses on radical or revolutionary changes with big improvements Focuses on Breakthrough ideas /products /services 2 Cultural change is slowly imbibed into the working DNA of the employees . Cultural change happens explicitly and drastically changes Cultural change happens consciously due to focused thinking 3 Participation(involving in the activity) of all workers normally happens as kaizen activities deals with process kaizen (Individual workstands)and flow kaizen(material and information) Not necessarily all workers need to be involved Not necessarily all workers need to be involved How do they complement each other ? Kaizen is the base . Its the building block on top of which Kaikaku and Kakushin can be done. Objective is to remove any non-value adding work by doing a kaizen and then see what needs to be done. When too many Kaizen activities are not yielding any results , then we go got Kaikaku. This is akin to DMAIC and DMADV. If we think that DMAIC is not going to work, then no point in trying to improve the existing process. So we opt for DMADV as we think old process cannot be improved. Same way, we move to Kaikaku and hence that becomes a radical shift in our approach (again think of DMADV for analogy). Now this is done . What next ? What if we find a better way to optimise our benefits . Our system then should be in a transformed state with our thought process realigned with innovative approach. So Kakushin comes into picture . This is akin to DMAODV in Six Sigma parlour. Conclusion:All the three are a must so that an organisation can stay competitive in the market. What would a company lose if one of these as a concept was not utilised? Case 1: If Kaizen not utilised: If thats the case, it would be like building a house without a strong base. Kaizen helps in setting up individual standards and also helps in eliminating waste/non-value added activities. Also it helps in controlling the over work of employees. By not having Kaizen, the disadvantages would be a). Impact of other two type of improvements may not be effective as still the processes would be weak because non-value added activities would be present because those 2 improvement types may not have addressed this aspect b). Kaikaku and Kakushin focus on system improvements primarily and will not focus on individual standards unlike Kaizen . As a result, employee focus would be missing c). Employee morale may go down as cultural challenge is thrusted upon and as there is no Kaizen which speaks about Muri . Employee might spend long hours to adapt to the cultural changes brought by other 2 types of improvement Case 2: If Kaikaku not utilised: 1. 1. Potentially it could happen that small changes might keep on happening eternally for ages with not much impact 2. Management/Key stakeholders may not be able to take decisions on issues/problems Case 3: If Kakushin not utilised: 1. 1. The Organisation will not be competitive in its business 2. 2. Difficult to grow in niche market 3. Business growth and hence revenue will be stagnated 4. Morale of top management will go down Example for Kaizen, Kaikaku, Kakushin: Assuming we are in a primitive age of IT , explaining the concepts of Kaizen, Kaikaku and Kakushin Problem Statement Before Kaizen Kaizen Results Often multiple developers working on same code/functionality creates instability and also delays deployment of files Code written by one developer is inadvertently overwritten by another. This happens at times on the delivery date creating customer escalation Have a Version Control System which will alleviate the problems Version control eliminates overwriting. Latest code is always used for delivery and right file is deployed eliminating customer escalation Now Version control available . Next issue. Problem Statement Before Kaikaku Kaikaku Results As more than one developer working on same file and multiple files, changes need to be frequently deployed in the code repository which is not happening Due to time pressure , code deployed in the code repository throws error while testing the application . Tester would not be able to test in such a case Do a Continuous Integration (CI). Have an Integration Server which can seamlessly integrate all codes and provide a build (compilation of the code –ready for consumption by the users) and also intimate whether build is failed or passed Tester and Developer can get notification about the success or failure state. It makes easy for testers to test In today’s environment , Time to Market is the key. So the sooner we make the changes , the faster we should deploy it in the production environment . Else business would be lost. Now as we frequently make changes and deploy it in our local environment and test the application, do we have the capacity to deploy those changes in real time(production environment?) Problem Statement Before Kakushin Kakushin Results As frequent changes are done to the code and tested in local environment , it becomes difficult to deploy the changes everytime in production as the environments are different and we need to make changes in various places including code so that northing gets broken in production Takes 2 days of effort to do the manual changes . Also the stress in doing these changes (staying at office for long hrs) takes its toll on the health of the individual . More SMEs required to do this job since its for more than 1 day Automate the deployment part Avoids manual effort for deploying the changes 1 SME who knows automation is alone required If automation sequence is done properly, no mental stress or boredom will happen4 pointsHi All Please find below comparison on the topic. Hope I can connect to the lot here. Business Excellence Process Excellence Operational Excellence Personal Excellence INQUIRY What am I supposed to do How am I supposed to do When am I supposed to do Who am I CRITERIA Vision Outcome Output Realization FOCUS AREA Market Competitiveness Continuous Improvement Quality Service Learning RELATIONSHIP Transforming Reframing Refining Acting ORDER You start with You design it into You execute it as You reinvent each time ABSENCE CAUSES Annihilation Variation Waste Insatiety APPROACH Balance Score Card Etc Value Stream Mapping Etc 7 QC, 7 MT, 7 Waste Selflessness and learning Regards Igniting Minds 95 ( Nagraj Bhat - On behalf of )4 pointsBusiness Excellence 4 Sept 2017.docx Define, Compare and contrast Personal Excellence, Process Excellence, Operational Excellence & Business Excellence. Personal Excellence: - Is a state of an individual or any person in which the individual or a person inherits an excellent or highest level of ability to be fully aware and to be fully able to rightly work upon one’s own strengths and weaknesses. This is a state that a person or an individual has reached upon experiencing the higher degree of self-evaluation & at which the person or an individual can guide other person or persons to make them be able to reach the state of excellence. Process Excellence:- Is a control of any process in order to be able to course with higher degree of efficiency & effectiveness. This is a state at which the process could deliver exactly the right required output. Operational Excellence:- Is a state of operations in which the operations are running exactly as per the expectations of the Business by having the excellent processes in place with excellent team working on Operations Business Excellence:- Is a state in which the Business has reached to a level where it becomes remarkably successful in achieving the set vision and by fulfilling all the expectations from the trail of the business in parallel. This is the state in which a business itself becomes the way of life. Business Excellence is more of a macro level where it is very important that it surpasses the states of Personal Excellence, Process Excellence & Operational Excellence. It is not so easy to achieve the Business Excellence unless an individual, process & operations are contributing towards the whole of the agenda. Personal Excellence is more of a micro level & is very important as without this it is very hard to achieve any further steps/state of excellence either in Process, Operations or in Business. Process excellence is directly contributing to Operations & further to Business to achieve higher degree of excellence. Operation Excellence follows Personal & Process excellence. It is highly impossible to achieve Business excellence state without being excellent as a person or an individual contributing to the Business, without having an excellent process & operations. Business excellence is the final result of Personal, Process & Operational excellence. An Organization must make sure that it empowers every individual to be able to involve to the fullest extent possible. It is an individual who can actual make a big difference in the whole of the Business. According to me it is finally the individual who can design & lead the right process, who can identify the right tools and techniques in order to perform to a level of excellence. Finally it is an individual who can bring the business as the way of life as the life in the business is finally the individual itself, despite the business is fully correlated to customer or market in its business sense. Group 14: Srinivasa Vampathi & Abhijeet4 pointsMy simple take in this is that the relationship described in this is reversely related i.e. Business Excellence cannot happen without Operational Excellence which cannot be achieved with no Process Excellence which in turn cannot be conceived without Personal Excellence. In other words, excellence of a business is directly interlinked to the personal excellence quotient of its founders, core members and its employees. A sense of desire to achieve self excellence in individuals leads to defining excellent process in an organization which leads to operational excellence within business units which ultimately leads to the company or the business a whole to excel.4 pointsHere's a methodical and useful way to keep track of versions, make sure performance is good, and produce clear documentation for AI processes and prompts that vary over time: 1. Make a formal versioning system Think about AI processes and prompts as code instead of making arbitrary changes: You can save your prompt and flow definitions as text files (JSON, YAML, Markdown) in Git or a program like it. Semantic Versioning makes it easy to communicate about changes: Major: A substantial alteration in the design's purpose or flow. Minor: New features or better prompts. Patch: Fixes or small modifications. Add commit messages that say what the change is meant to do and why it was made. Put both the prompt text and the evaluation/test cases in the same repository so that you can observe both the inputs and the outcomes over time. 2. Make a registry for Prompt and store information about it. Keep a well-organized register (this might be a spreadsheet, a Notion database, or an internal tool) that has: ID of the version Date of Release Writer/Owner Changes Explained Results of tests that are connected Cost, accuracy, latency, and satisfaction are measured/ indicates performance. Rollback Reference - to the previous version This registry is your traceability source to/whether you compare or go back. 3. Check Before You Start To make sure that upgrades are useful and not harmful: Use fake and real test cases from the past to execute the new flow/prompt in a sandbox environment. A/B Testing: Send a small quantity of traffic to the new version and see how it compares to the baseline version. Regression Checks—Check that crucial KPIs don't go down for scenarios that are known to be good. When you can, automate tests by generating a list of queries and expected outputs ahead of time and running them on both old and new versions. 4. Document errors/problems with corresponding causes If you change something, be sure to add: The problem statement, such - users didn't understand step 3 in the flow. The theory, like - making the language easier should lead to more people finishing. The proof after deployment, such as - the recall rate improved from 72% to 84%. You or another developer will be glad know what was wrong when you look at older versions again. 5. Be ready to go back Make sure that the last stable version is always straightforward to install. Make it easy to roll back your deployment process, ideally with only one click or command. Write down when and why rollbacks occurred. They can be just as useful as changes that happen in the future. 6. Find a way to blend stability with new ideas. The Innovation Track is an experimental branch, where you may test new techniques to get engineers to work without putting the stability of production at risk. Stable Track: Flows that are ready for use and only get revisions after a lot of testing. Changes from innovation should only be merged to stable when the metrics/performance are fine. This is basically a two-speed paradigm for development: fast testing and slow release. An example of a workflow Create a new prompt in any AI tool. Make your commitment clear: Make step 3 clearer to cut down on drop-offs. Do automated testing and have people look at old cases. Send 10% of traffic to A/B testing. If the metrics improve, merge into the main branch and change the version. Put notes and numbers in the Prompt Registry. Conclusion Managing different versions of AI flows and prompts requires the same amount of attention as building software. The best method to do this is to put together: Git and semantic versioning are examples of structured version control. Centralized Documentation (a registry with performance logs and other information that is easy to access) Strong testing and rollbacks, such sandboxing, A/B testing, and automated regression checks Two-speed development means having a solid track for production and an innovation track for testing. This makes sure that every change can be logged, tested, and undone, which helps teams come up with new ideas quickly while keeping things stable. In short, always have a way back, write down the why, and test the what.3 pointsWhen we talk about Continuous improvement, as a concept, we refer to a constant WIP mode of innovation, enhancement and incremental progress. Take all possible learnings and loop it back an input to further refine a product or process. VOC, VOB, error types, new data or new pattern or behavior of a certain process or a machine that can be studied, performance monitoring. Getting RCAs. Feeding it back into the system and closing the loop of a continuous self-learning improvement process with the help of Artificial Intelligence. Natural language programing Reinforcement Learning : AI agents can learn by interacting with end users and learning best practices from online forums and receiving feedback (rewards or penalties). Over a period of time, AI models or AI agents can improve their decision-making based on outcomes. Example: AI in customer service optimizing responses based on customer satisfaction scores. Also, in an AI agent environment if a customer rates a low score or not resolved on a survey. AI can ask customer if he or she wants to get redirected to additional support Utilize online libraries: System based or conventional training methods have a focused content and is periodically reviewed once or twice a year. Unlike traditional models trained once on a fixed dataset, online learning allows models to update continuously as new data arrives. Can prove to be extremely useful in dynamic environments like fraud detection system that can improve itself whenever a new fraud pattern emerges or email classification or query categorization. Optimized Human-in-the-Loop (HITL): AI backend can incorporate VOC of output or a human feedback to refine and improve performance. On a continuous basis which a key component of continuous improvement For example, customer service agents correcting AI-generated email drafts helps the model learn better phrasing, grammar, formatting, and tone. Use concepts like A/B Testing and Feedback Loops: A tried and tested AI system can test different strategies (e.g., email templates) and learn which ones perform better. Manual or online VOC and Feedback loops help the system adapt to changing customer behavior or business goals. e.g. In a Banking Email Customer Service Context: AI can learn from: VOC (NPS scores, complaints and RCA) Agent corrections to AI-suggested replies, check of all queries are answered in a multi query email. Frequency and Escalation patterns (e.g., which types of queries lead to dissatisfaction) Compliance checks (to avoid regulatory violations) Though there will be challenges to guarantee a continuous improvement on AI based models, if we study it enough it can be overcome. Challenges like Propagation of systematic Bias. For e.g. an AI model might be more favorable to a certain type of machine or high-performance shift timing, or certain region in terms of Sales etc. Distribution or pattern shift. Or drifting of parameters, Real world the situation changes dynamically so AI will have to be trained to Adapt. Failing which it will follow a fixed pattern and might not necessarily be effective. In manufacturing or Healthcare sector or if we speak from a Six sigma perspective AI can Conduct SPC if we feed it in initial stage. Analyze process deviations If we find some points or processes out of control, we will implement solutions to get the process in control, AI agent can learn from such corrective actions It can also Suggest process changes to reduce defects depending upon previous corrective actions taken by us or information available online. Would be better poised to predict process output or future failures or improvement opportunities3 pointsI have not been trained or certified as an MBB but I can apply what I have learned in this course. Here's an example of an AI solution technically is working as it should but has become a part of the problem. Consider a business who has a customer service center and their customers are experiencing long wait times. In an effort to decrease the long wait times, they create a Chat Bot. After implementing this AI solution they certainly can see the the call wait times has significantly decreased because the Chat Bot can "answer" them quickly. So, technically, this AI solution is a success. Wait times have drastically decreased. But the company begins to hear from their customers how angry and frustrated they are, even more so than when they had to deal with long wait times. The business failed to understand that what they should have been really trying to solve was increasing customer satisfaction, not merely the symptom of addressing long call wait times. The Chat Bot caused greater unsatisfaction because customers now have to make repeated calls (even though they don't have to wait) because the many "simple" calls are often precursors to more complex issues and the Bot could not handle these, thus forcing customers to start over with an agent, which leads to more frustration. Also, agents may now have to deal with more calls from customers because the Chat Bot did not properly diagnose the underlying problem. This situation wasn't created by the Chat Bot, but by those who didn't have the foresight to really understand how they should have created the Chat Bot. At the end of the day, technology or technical solutions, such as AI, will not be blamed for these problems that arise. Those who created the AI solution will be. You don't want to be that person. Back to the original thought of creating an AI solution. The business thought it was to merely solve lowering long wait call times. But the real root of their issue was customer frustration and dissatisfaction. Their "AI solution" was focused on the wrong thing and it even caused a deeper problem for them How could this have been prevented? Using the FRT process and documentation which captures the Desired Effects (DE), the Undesired Effects (UDE), and the Negative Injections (NI) of any AI project and solution. FRTs can help to envision the ideal future state of an AI solution but also proactively identify negative consequences BEFORE a dime gets spent on creating the solution. The FRT would have captured the root cause by addressing and thinking through the UDEs and also creating NIs to create answers for these UDEs. Utilizing the FRT process and documentation, along with creating a very thorough and thoughtful BRD, would have greatly increased a proper AI solution that result not only in lowering call wait times, but mor importantly, raising customer satisfaction.3 pointsBelow listed are the traits of a good AI Governance Model – 1.) Clear and Fair – Identify and reduce any biases in the model, provisioning options for human interventions for big decisions and ensuring POCs are defined and known to all stakeholders in case something goes wrong. 2.) Strategic Fit – Ensure every AI deployment directly supports the organization's strategic goals and delivers clear value 3.) Managed Lifecycles: AI systems should have a defined route from initial conception to continuing upkeep. This calls for extensive testing prior to deployment, ongoing performance monitoring, and a defined procedure for modifications or even retirement. We require accurate documentation of everything. 4.) Training – Ensuring that relevant teams are well trained to work effectively with the AI. Also, teams need to be aware of what the AI can and cannot do. Stakeholders of an ideal AI Governance Model – 1.) Leadership 2.) AI oversight group 3.) Ethics and compliance team 4.) Internal Auditors Mechanism to ensure both agility and control 1.) Smart Risk Assessment – Design and approval framework aligned with the risk quotient of the deployment. 2.) Use of standardized tools and reusable modules – Provision pre-approved tools and use of reusable building blocks to cut down redundant work. 3.) Build in governance from day 1. 4.) Centralized guidance from the AI oversight team. 5.) Clear and defined RACI. 6.) Provision Human-AI collaboration for high risk decisions.3 pointsTraditional KPI metrics such as productivity, quality, cost, delivery, efficiency, and many more should not leave management lenses, rather, targets associated with them should be adjusted accordingly. Customer and employee satisfaction surveys however can be done through AI, leveraging on its capability to detect emotion, interpret facial expression, body language, and many more which is difficult for human eye to decipher and prone to certain biases. To track AI’s real performance and value, I recommend Input Data Integrity, and Bias Detection as two additional KPI metrics that management should add under their lenses. These are crucial for AI’s model creation, accurate training and analysis, impacting AI’s recommendation for business decision-making process.3 points3 points9. Imagine a process where the AI agent must balance two or more objectives — for example, minimizing response time vs. maximizing customer satisfaction, or sticking to process rules vs. delighting a VIP client. Describe one such situation and explain how you would guide the AI to handle the trade-off. What logic, rules, or signals would help it make the right call? Situation Case Flight EK 380 has a case scenario where AI should decide to opt one of two passengers to fly. One is the Platinum tier(Highest of all tier) passenger who exactly has arrived one hour prior the flight and Other is passenger who is a blue tier (Lowest of all tier) member who travels in economy class once a year but customer is seriously ill he should travel immediately with doctors recommendation.Unfortunately economy class is completely filled an hour before due to festive season. AI is asked to tactical situation. Conflict - Stick with process vs delighting a vip client. Signals - Key factors Platinum tier passenger To be upgraded immediately to business class most of the time of his travel. Loyalty/ Revennue - Generators $10,000 a year and always fly the same airline Present booking - Economy Blue tier passenger Passenger who serious ill required medical attention Loyalty/ Revennue - Fly the airline at least once a year and $1000 a year Present booking - Economy Operational Parameters - Flight starts 60 min decision to be taken the soonest - Security check and reaching the boarding gate takes 45 mins - Next flight 8 hours later - Compensation to Blue tier $300 dollars and next flight booking - Compensation to Platinum tier $1000 dollars and unhappy customer. AI Rules - Emergencies should be given priority over VIP clients. - Cost of compensation to the airlines. - Loyalty status of the customer AI Decision - Upgrade blue tier passenger with medical emergencies to priortize life risk to upkeep airline PR & advert status which can bring more new businesses to airline. -Platinum tier passenger given a ticket for next flight with free business class upgrade without detecting any points. And offer free lounge access with spa services for the long wait/ lounge access with $200 additional voucher. - AI decision summary points - Platinum tier passenger still satisfied with additional rewards given by the airline and awaits for next flight. Airline makes sure platinum tier passenger is satisfied and loyalty program member is maintained throughout the year. - Blue tier passenger understand the airline compassion and policy towards life risk issues than loyalty or revenue. -both decision are understood by the customer and upheld.3 pointsEmployee assistance programs, Mental health, etc. a task that continues to seem “too human” to delegate to AI is supporting employees during emotional or mental health difficulties, especially when they find it hard to express their emotions. Sometimes, people don't express even when it is clear, or they exhibit frustration that truly hides burnout, anxiety, or even early indicators of depression. Although AI may not currently be able to kick off these conversations, I can imagine it as a discreet supporter operating in the background. For instance, AI could identify behavioral patterns such as a decrease attendance, or meeting attendance, alterations in communication styles, or numerous emails sent late at night and subtly notify HR or supervisors regarding these concerns. It might also suggest wellness resources or conversation starters tailored to the context, facilitating opportunities for meaningful human engagement. In this way, AI serves as a support system, not a substitute making certain that no one slips through the cracks, particularly when they are unable to express their emotions.3 points3 pointsAs artificial intelligence systems evolve, the elements described interact in intricate ways, usually dependent on one another to reach ideal performance. Below is a review of every element together including examples showing their interdependence and if it can operate in isolation. Below is system by system analysis of ability to work in isolation, requirement of integration & Example or use cases of dependencies Machine learning (ML) can run in isolation in fields like predictive modeling or categorization,. A solo ML model, for example, might look at historical data to project future outcomes without direct connectivity to other components. ML sometimes demands for integration with other components for more challenging tasks, though. ML models must be combined with language rules for NLP jobs, for example, to increase knowledge of context accuracy. For a recommendation system, for example, ML techniques look at user behavior to provide product recommendations; but, they might rely on knowledge representation to more fully understand consumer preferences. Natural language processing (NLP) conduct tokenizing and sentiment analysis on its own, hence enabling simple text processing tasks. For complex usage like virtual assistants or chatbots, NLP must integrate knowledge representation—to provide relevant responses—with ML—for intent identification. For example, a chatbot uses NLP to examine user questions then rely on ML to classify intentions and knowledge representation to get the pertinent information. Robotic systems can work under pre-defined rules and with simple programming without advanced artificial intelligence components. If it is to run autonomously, robotics largely depends on computer vision (for navigation), ML (for learning from environments), and planning/scheduling (for task execution). To negotiate obstacles, for example, an autonomous vacuum cleaner uses computer vision and ML to improve its cleaning patterns over time. Expert systems can run independently to handle certain tasks including medical diagnosis using a rule-based approach, Depending on fresh input, expert systems can update their knowledge base using ML; else, NLP provides user interaction. For instance, a medical expert system might use NLP for improved user communication and ML to learn from fresh patient data, hence increasing its capacity even if it uses rules for diagnosis. Computer vision allows one to execute simple image processing tasks as picture filtering or edge detection by themselves. Computer vision often calls for robotics (for real-world applications) and ML (to educate models) for usage include item detection or facial recognition. A self-driving car uses computer vision to identify road signs and dangers and depends on ML to steadily raise recognition accuracy over time. Planning and Scheduling tasks which are simple tasks can be done without integration, using predefined algorithms, therefore isolating oneself. Difficult planning and scheduling demand both knowledge representation—to understand the surrounds—and ML—to adapt to changing conditions. In logistics, for example, a planning system might employ knowledge representation to understand delivery constraints while basing deliveries on current traffic data—which it learns via ML models. Knowledge Representation and Reasoning systems can run by itself by organizing facts and rules in a disciplined manner. Still, it is typically integrated with other aspects including expert systems (to apply logic), ML (to learn new facts), and NLP (to extract knowledge from text). For example, NLP can be coupled with a knowledge graph to find objects from text and then reason over their relationships. Most of the time, the way these components are combined defines the effectiveness of artificial intelligence systems. While some people can function alone, their real power comes from cooperating and information sharing to handle difficult problems. Strong and efficient responses depend on the design of artificial intelligence systems considering these interdependencies. For a self-driving car, for instance, success depends on perfect interaction among computer vision, artificial intelligence, robotics, planning and scheduling aspects.3 points3 pointsDiagnostic Analytics is one of the data analytics techniques that analyses a dataset to arrive at root causes of events, behaviours, and outcomes. It is primarily conducted to provide insights on various factors that are responsible for a problem at hand and tends to uncover the “WHY” behind the data. The data source, quality and reliability is paramount while conducting a Diagnostic Analysis. Diagnostic Analytics primarily represents the Current State in a problem-solving domain which connects the dots between Descriptive Analytics (what is wrong?) and Predictive Analytics (what is likely to happen?). The findings of these provide further insights on Prescriptive Analytics (Future Course of Action). In a DMAIC framework of six sigma, maximum value can be derived from Diagnostic Analytics in the Analyze phase. Examples & Use Cases: RCA Techniques: 5 WHYs & Pareto analysis to find out of the root cause - For e.g. A 5-why analysis revealed increased usage of UPI transactions to be the root cause of CASA ratio decline in a leading bank. A pareto analysis showed that discounted products which correspond to 20% of the overall merchandise are contributing to around 80% of the sales. Clinical Diagnostic tests use patient's tests results data to generate a complete summary based on the insights derived post comparing it against the standard and also against patient's past data. The physician in turn could do RCA to derive meaningful conclusions as to why this is happening. Hypothesis testing: To test an assumption that better wages outside is contributing the most to the attrition in a leading organization. A sample of exit interview data was subjected to a statistical test (1 proportion test). The test result was found to be statistically and practically irrelevant and rejected the assumption. Correlation & Regression Analysis: Many stock broking platforms have built-in algorithms based on pattern recognition, correlation & regression analysis to derive meaningful conclusions so that their investors can make informed decisions. Anomaly Detection: Network analysis make use of built-in control charts to detect any anomalies that may shed further light on the assignable causes of frequent downtimes and network jams.3 points3 pointsDOE is generally meant for continuous response data. Continuous data can be interpreted very easily as it can be, in most cases, fit into a particular probability distribution and insights can be drawn very easily. Also, the measurement of interactions of the different levels of inputs on the response can be very easily assessed. However, discrete DOE would be a difficult to handle as the response to the inputs needs to be fit into binary, ordinal or nominal categories. While the output can be fit into distributions like Poisson or Binomial, there is a chance that the result might be misinterpreted on account of limited number of trials. The resolution is not well captured in discrete output as good as it is can be done with continuous data. Despite these challenges, discrete data DOE can be a powerful tool in certain situations. For example, in quality control, we may want to investigate the factors that influence the probability of a product being defective. Or, in marketing, we might be interested in modeling the likelihood of a customer responding to a particular promotion.3 pointsI have been compiling a comprehensive list of contemporary methodologies for Business Transformation. I started this in the year 2005. Over time, I have made several modifications to ensure the list covers all established and emerging approaches. To ensure the list was inclusive, I deliberately avoided methodologies limited to a specific industry, such as enterprise architecture, or those useful only for a particular function, such as Customer Relationship Management. I also tried to avoid subsets, for example, by recognizing that BI is already part of Business Performance Management. Currently, the list includes ten methodologies that have proven to be effective across different industries and functions. These are - Lean Management Lean Six Sigma DMAIC or Six Sigma DMAIC Six Sigma DMADV Agile Leadership Digital Transformation (includes Business Analytics and Big Data) Business Performance Management (includes BI) Design Thinking Theory of Constraints Creativity and Innovation (includes product innovation, process innovation, business model innovation, and marketing innovation) Business Process Reengineering (BPR) I propose that we collaborate on developing this list by discussing it together. We can explore whether there are any reasons to modify, enhance, or change it based on our collective insights and expertise.3 points3 pointsLean Six Sigma is a powerful methodology that can be used to improve business processes. It is a structured approach to problem-solving that can be applied to any process - manufacturing, sales, marketing, IT, BPO, accounting, purchasing, you name it. All processes have variation. Variation is the cause of all evil - it leads to defects and customer dissatisfaction. Lean Six Sigma methodology can be used to reduce variation from any source and thus improve costs, quality, and hence customer satisfaction. The standard methodology that is used to improve existing processes is called DMAIC. The acronym DMAIC stands for Define - Measure - Analyze - Improve - Control. If you think about it - this methodology is common sense. Before we start working on a problem, we need to have a good definition of what is the problem, why we are working on it, where is the pain area, what is in the scope of the project etc. All of these are accomplished in the Define phase. Secondly, in the Measure phase, we are interested in ensuring that the data used for further analysis is free of measurement errors. Lean Six Sigma is about making decisions based on facts & data. If the data is inaccurate, we would end up making the wrong decisions. Hence, the measured phase ensures good data. Before making any improvements, it is also important to establish a baseline so that we can clearly communicate the benefits obtained from our project to other key stakeholders. The next phase, Analyze, is all about making the hypothesis and using data to either prove or disprove our hypothesis. We make the hypothesis about what is causing the problem and then establish the real root causes. The fourth phase, Improve, focus on getting the best possible solution to solve the root cause of the problem. The solution is optimized and any potential failure modes are resolved before the solution is deployed in the real world. The last phase, Control, is all about ensuring that the solution is sustainable in the long run. Any financial benefits obtained from the project are also quantified. Finally, the improved process is transitioned over to the process owner. As we can see from this paragraph, any problem can be addressed using this structured approach. Here are some things that should come to your mind when people talk about Lean Six Sigma: Business Process Improvement Methodology 3.4 defects per million opportunities Customer focused Uses facts & data Quantify financial benefits Structured improvement approach3 points3 pointsQ 482. Explain the KT Analysis method of problem solving using an example. Does it provide any advantage over other problem solving approaches? Note for website visitors - Two questions are asked every week on this platform. One on Tuesday and the other on Friday. All questions so far can be seen here - https://www.benchmarksixsigma.com/forum/lean-six-sigma-business-excellence-questions/ Please visit the forum home page at https://www.benchmarksixsigma.com/forum/ to respond to the latest question open till the next Tuesday/ Friday evening 5 PM as per Indian Standard Time. Questions launched on Tuesdays are open till Friday and questions launched on Friday are open till Tuesday. When you respond to this question, your answer will not be visible till it is reviewed. Only non-plagiarised (plagiarism below 5-10%) responses will be approved. If you have doubts about plagiarism, please check your answer with a plagiarism checker tool like https://smallseotools.com/plagiarism-checker/ before submitting. The best answer is always shown at the top among responses and the author finds honorable mention in our Business Excellence dictionary at https://www.benchmarksixsigma.com/forum/business-excellence-dictionary-glossary/ along with the related term3 points3 pointsOutliers are part of the real world and need to be investigated before analyzing and interpreting the data. This is, even more, the case with small sample sizes, as the outliers have a greater impact on the results. Some models such as Principal Component Analysis, Hierarchical Models, K-Means, Linear, and Logistic Regression are very sensitive to outliers. Detection of unusual transactions may be the aim of the operations. This unusual transaction is generally in the form of outliers, such as fraud detection, stock forecasting, etc. Hence understanding outliers is critical because outliers are most likely to bias the entire interpretation or the outliers maybe what we are looking for. Reason for Outliers Error The error may be due to Data Entry, Recording, Measurement in Gage, Measurement due Operator, Measurement error due to calibration, Sampling Errors, Data Processing Errors. Part of Normal Process Outliers may be present in the data due to Bulk orders, Resellers or Extra Loyal Customers, etc. How to Detect? Data Visualization Outliers can be detected through Data Visualization such as Box plots, Scatter Plots, Histograms, Run Charts, Lag Plots, Line Charts. Statistical Methods Outliers can be detected through Statistical Methods such as the Standard Deviation Method, Tukey's Method. Etc. What is the strategy to deal with outliers? Keep the outlier and carry out the test with the outliers. Segment the data and carry out a deeper analysis. Imputing outliers and treating them separately. Set up a filter to do the test without the outliers. Since significant effects are hidden by outliers, it may be appropriate to set up a filter to examine the results without the outliers. Delete the outlier - The outliers may be deleted if there was an error in data or the reason for the outlier is not likely to happen again Delete the outlier after post-test analysis Change the value of the outlier. This may be done by replacing it with a more appropriate value such as the mean or the median. Consider the underlying distribution. An Anderson Darlings or Shapiro Wilk Test may be done to check the normality of the data. Carry out a Non-Parametric Test in case the underlying distribution is not Normal. Transform the Data. Data can be transformed using the Box-Cox Transformation, Johnson Transformation, log transformations, scaling, cube root normalization, etc. Methods and Tests that can be done for data having Outliers Winsorizing or Winsorization It is named after Charles P Winsor, who was an Engineer and Biostatistician. In this process the effect of the outliers is reduced by limiting the extreme values. It sets the value of all the outliers to a specific percentile of the sample. Data estimated through the Winsorization method is generally more robust to outliers. Example. A 95% Winsorization would set the bottom 2.5 percentile of the data to the 2.5 percentile value and the top 2.5 percentile of the data to the 97.5 percentile value. Trimming/ Truncation This is a method of censoring data. All data above/below a certain percentile is removed. Example. A 95% truncated data would eliminate the bottom 2.5% of the data and the top 2.5% of the data above the 97.5 percentile. TRIMMEAN function in Excel may be used from trimming the data. Winsorized mean and truncated mean are not the same. Non-Parametric Tests such as 1 Sample Sign Test, 1 Sample Wilcoxon Test, Mann Whitney, Kruskal Wallis, Moods Median, Friedman, Runs can be done in case of the underlying distributions being not normal. Transformation - Transform Data and carry out Parametric tests. Univariate Methods Box Plot - The box plot is the easiest method for identifying outliers. It uses the median and the Q1 and Q3 to determine the outliers. Tukey Method - This method identifies the extreme outliers as being greater than three 3 times the Inter Quartile Range below/above first/third quartile, Mild Outliers as between 1.5 to 3 times IQR. Multivariate Methods At times the univariate method may not detect the outliers. Multivariate methods such as multiple linear regression may be used. Minkowski Error. This method can be used to minimize the impact of the outliers on the model. It is a loss index and more insensitive to outliers than the mean square error since in the mean square error the contribution of the outliers increases exponentially. References https://en.wikipedia.org/wiki/Winsorizing https://www.sigmamagic.com/blogs/how-to-handle-outliers/ https://cxl.com/blog/outliers/ https://aichapters.com/how-do-you-handle-outliers-in-data/ https://aichapters.com/how-do-you-handle-outliers-in-data/ https://www.aquare.la/en/what-are-outliers-and-how-to-treat-them-in-data-analytics/3 points3 pointsMy thoughts on Backcasting Backcasting is a planning methodology that works backward from a desired outcome/outcomes or future state/states to the present. While implementing this methodology one needs to identify the policies, programs, actions, milestones that are necessary in order to reach the future desired state, goal, or objective. Hlomberg Robert in their paper on Backcasting from non-overlapping sustainability principles – a framework for strategic planning have defined Backcasting as a planning methodology that is particularly helpful when problems at hand are complex and when present trends are part of the problems (Robèrta, 2000). John B Robinson from the University of Waterloo first coined the term Backcasting in 1980 and laid out its fundamentals ten years later in 1990. Whilst the term Backcasting may have been coined in 1990, its use could date back to the origin of man. The landing of man on the moon 20 July 1969 is a good example of Backcasting. President John F Kennedy announced in Congress on 25 May 1961 “I believe this nation should commit itself to achieving the goal, before this decade is out, of landing a man on the moon and returning him safely to Earth (History, n.d.).” This set into motion a plethora of activities to put a man on the moon by the end of the decade. Backcasting vs Forecasting While forecasting aims at predicting the future based on trends of the past, Backcasting works in the opposite direction, from the desired outcome to the present. In forecasting, the past is known and the outcome is predicted from these historical trends (partially unknown). In Backcasting the desired future is known, and the likely things I need to do to achieve this desired outcome are partially known. In terms of the dependent variable and independent variable, forecasting predicts the future value of the unknown dependent variables based on known values of the independent variables whereas Backcasting predicts the unknown values of the independent variables in order to explain the known value of the dependent variables (Backtracking, 2021). Backcasting from a Single Scenario and Multiple Scenarios. Backcasting can be done both from a single future desired scenario or a multiple future desired scenario. The individual or the leadership may need to use various techniques such as brainstorming, NGT, Delphi technique, PESTLE, horizon scanning, cause and effect diagrams, etc to list out the future scenarios and home-in onto the desired scenarios that are desirable and favorable to them. Backcasting on the Individual Level and Corporate Level Backcasting can be used on both the individual and corporate levels. A common question during a job interview is; where do you see yourself in the next 5 years? The next logical step to ask would be; what are your plans to achieve that desired outcome. These questions naturally lead to the Backcasting process. At a Corporate level, Backcasting may be taken as a strategy-building exercise examining various scenarios of the future and planning the alternate steps to achieve these scenarios. The planning may involve common activities that could be applicable to all scenarios so that flexibility is built in the planning process and finally differentiation can be built in the plan when closer to the desired future. Steps in Backcasting. The very fundamental step in Backcasting is setting a goal/goals, a vision of the future. What does out vision of the future look like? The clearer the vision, the greater will be the motivation to achieve this goal. After visualizing this goal, one must backtrack and work out the sequence of the steps to achieve this goal. Working out the milestones along with the timeline is an important step. This is similar to the saying – putting your ducks in a row or if you aim for the Stars, you will not land up with mud in your hand. The next step would be to build as much flexibility in the plan as possible. The rapid change in technology and societal patterns Finally, one must work out the resources required at each step and milestone to achieve the future desired state. Backcasting during the Pandemic. The pandemic has affected people across the globe equally, however, the smart ones are using the technique of Backcasting by upskilling, learning totally new skills, networking, and many other activities. Doing a Lean Six Sigma Green Belt or Black Belt or even the Master Black Belt certification or certifications such as the PMP, CPSM, etc. could be milestones that one could achieve while Backcasting. Backcasting and the DMAIC/DMADV Process The tools used in Lean Six Sigma DMAIC or DMADV Projects could also be used in the Backcasting technique. The Delphi technique could be used to get a consensus opinion on what the future could look like. The tollgates could be used at each milestone to see if one is on track and build flexibility based on the changing future. Tools in the Analyse phase such as listing the potential scenarios akin to causes and identifying the root causes (main scenarios), hypothesis testing, design of experiments, simulation, etc. can be used to analyze the various scenarios. Conclusion Proverbs 22:6 is an example of backtracking. Train up a child in the path/way/manner in which he should go and when he is old/mature he will not depart from it (Bible Hub, n.d.). “In the path/way/manner, he should go” is akin to the desired future state, “Train up” is akin to backtracking and setting milestones in the life of the child, “and when he is old/mature, he will not depart from it” is akin to achieving the future state. The technique of backtracking has been around for centuries; however, the technique has been formalized and coined as backtracking just three decades ago. References Robèrta, J. H.-H. (2000, December). Backcasting from non-overlapping sustainability principles — a framework for strategic planning. The International Journal of Sustainable Development and World Ecology, p. 2. History. (n.d.). Retrieved July 28, 2021, from History: https://www.history.com/topics/space-exploration/moon-landing-1969 Backtracking. (2021, July 28). Retrieved from Wikipedia: https://en.wikipedia.org/wiki/Backcasting (n.d.). Retrieved July 29, 2021, from Bible Hub: https://biblehub.com/proverbs/22-6.htm3 points3 pointsQuestion - A forensic expert walks into a room with a bunch of dead Six Sigma Black Belts who show no visible signs of injury. What's the first thing he should check for? Answer: Poisson distribution.3 points3 pointsAgainst:- Zero defect is a Nirvana stage. When there is no waste, no unwanted activities in process of making a product. No matter how much money you invest, there will always be some waste generated/ some activity that is a not adding any value to the product. You take any organization with world class equipment,processes, technologies. They are still struggling to achieve Zero Defect, because it is practically impossible. I am not telling that Organization should stop working to achieve zero defect. Considering "Zero defect" as a concept is brilliant. It motivates and drives people for continuous improvement. If Zero defect is possible why do organization struggle to achieve 6sigma level. i.e 3.4 DPMO. why don't they target higher sigma level where there is 0 DPMO. six sigma is only one aspect of Zero Defect3 points3 pointsEveryone has brought out great points which deserve to be respected. The passion to believe that 'Zero Defect' is NOT an impossibility is very encouraging. However, prior to this debate, the question was initially asked as a Yes / No question with no conditions and no room for explanations or deeper interpretations - "Is Zero Defect achievable?". All the answers that support this have some conditions attached., viz. it comes with a cost, it is possible with sufficient planning, could be done with mistake proofing, it is a management concept etc. etc. I am a strong supporter of the zero defect thought process, but when it comes to answering this question unconditionally, I would maintain a "no". No quality standard is complete without a "corrective action" clause. Big brands do have well defined customer service clauses that include warranty services and product recall procedures. Inspection and rework lines are built in even the best of production lines. Robust design and Mistake proofing techniques have greatly helped in improving efficiencies and reducing human dependencies and thus reduced errors. Even then, it is hard to find a 100% mistake proofing for all processes in a production line or a service industry. Even a 7 sigma process is termed as 'Near Perfection', but still not perfect! All of us know that the normal distribution will touch the X axis only at infinity! When we buy a product, say a Television set, we expect it to perform defect free for a reasonable period of time. In a large population of TV sets from highly reputed manufacturer, the defect rate is expected to be extremely low, but certainly it is still not zero. You may visit the nearest service center for any product to find out! Yet for those small portion of affected customers, what is considered very important is the prompt response and remedy with least inconvenience. When we say zero defect, it cannot be even one in a million. It is very important to encourage the philosophy of 'zero defect', and continuously strive towards it, but one has to be very careful before making a claim of achievement. An organization might do its best to overcome most of the factors that are controllable, but there are factors that may not be controllable and it wouldn't be practical to build a factor of safety for all such factors. We should not permit over complacency to set in that would come in the way of planning good remedial and recovery plans, for which failures need to be anticipated and mitigation plans built in. Many safety systems that necessarily may not prevent failures, either due to product or due to external factors, but help in reducing severity of the impact in an 'unlikely' event. Just as in an FMEA exercise, we tend to prioritize the actions based Severity, Occurrence and Detection, but may not necessarily eliminate all possibilities 100%. The "Zero defect" thought process will continue to be key driver for continuous improvement, and would help to intelligently understand and manage the variabilities more proactively to provide products and services that keep up with ever revising Quality and Reliability expectations.3 points3 pointsI agree with Ms. Reena And Ms. Kavitha but I would like to add some points to explain more for Mr Venugopal as I am not agree with you because here we are not talking about zero defect in general. We are talking about zero defect in industries, services sector, telecom sector, manufacturers, car manufacturers, vehicle manufacturers and many more. For any organisation business performance and profit making and satisfaction of customer is the main goal. If any organisation has aimed to achieve some financial goal with satisfaction of customer and if they achieve it then we can say that they have zero defects. It depends on how we are interpreting it and where we are applying it. I agree with Ms Kavitha that it involves a lot of cost and previous planning also. If we talk about car Manufacturing industry then here we have different methods to meausre JD Power customer service index, customer satisfaction index and Initial quality study. For example if I give example for Honda City, it has IQS score on first position since last more than 10 years and Honda aims to be number one in IQS study, and Honda is achieving it continously year after year, although they have invested huge to achieve and maintain consistency on first position in its segment, here we can say that Honda is achieving zero defects because Honda aimed to be number one and achieving it also.3 points3 pointsThere are many situations where we really require zero defect. like already pointed out "Surgical set up" , or a "plane landing". The question here is not about zero defect required or not.. It is about "Is zero defect achievable?" When we say zero defect does it mean: 1. Absolutely no defect from a process... for how much duration? For ever? 2. Are we drawing some upper and lower tolerance on % defects or DPMO. and so long as the defect rate falls with in a service level agreement, are we going to accept it as zero defects? 3. if we are talking about a particular product, on which multiple defects can manifest,... when we say zero defect, are we referring to the non-occurrence of a particular defect or do we mean that no defect type should occur? 4. Are we referring to only the final output? Are we ok to have inprocess defects, but the final outcome is expected to be zero defect? 5. When we say zero defect, are we ignoring other factors like delivery time, processing cost, productivity etc? WHAT IS ZERO DEFECT? DEFINE IT.3 points3 pointsNull hypothesis (Ho):- It is a hypothesis that says there is no statistical significance between the two variables in the hypothesis. It is a statement of “No Difference”. It is a statement we are testing in order to determine whether or not that statement is true. The observed difference is purely by chance and there is no special cause for the difference. Alternative Hypothesis (Ha):- Hypothesis which states that there is statistical significance between the two variables in the hyphothesis. It is a statement of “difference”. It states that there is real effect and the observations are affected by the effect and some pure chance variations. Example:- A person reaching his office through a route 1, after some days he takes another route 2. We have recorded time taken for a person to reach his office. Ho:- there is no difference in time taken to reach the office from route 1 and route 2. Ha:- There is statistical difference in the time taken to reach the office from route 1 and route 2. There is no situation in which Ho becomes and Ha and vice versa. Ho statement always has the words “No Difference”. While Ha statements will always have “statistical difference” words.3 points3 pointsWhile continuous data is generally preferred over discrete data, please indicate circumstances where discrete is the preferred data type although continuous data is available for the same characteristic. Note for website visitors - Two questions are asked every week on this platform. One on Tuesday and the other on Friday. All questions so far can be seen here - https://www.benchmarksixsigma.com/forum/lean-six-sigma-business-excellence-questions/ Please visit the forum home page at https://www.benchmarksixsigma.com/forum/ to respond to the latest question open till the next Tuesday/ Friday evening 5 PM as per Indian Standard Time. The best answer is always shown at the top among responses and the author finds honorable mention in our Business Excellence dictionary at https://www.benchmarksixsigma.com/forum/business-excellence-dictionary-glossary/ along with the related term.3 points3 pointsKaizen, Kaikaku and Kakushin are three approaches within Lean which have their roots from Toyota. They work well together and have different areas of focus and magnitude of impact/risk. The table below provides differentiation and tips for their implementation. Kaizen - Kai – Change, Zen – Good Kaikaku – Radical Change Kakushin – Innovation Definition Evolutionary change for better focused on incremental improvements Revolutionary change focused on radical improvements Innovation, transformation, reform and renewal Focus Area Continual improvement of their processes Transformation of their organizational culture Bringing something new into existence People All levels including workers Executives and top management Top Management Risk / Impact Low Medium High Steps / Tips / Techniques · 5 S o Seiri – Sort out o Seition – organize o Seiso – shine the workplace o Seiketsu – standardization o Shitsuke – self-discipline · 7+1 Wastes o Transportation o Inventory o Motion o Waiting o Over-processing o Over-production o Defects o Skills under-utilization · Look for ways to make maximum contribution to ideal state – “What would be ideal customer experience” · Search for opportunities for radical improvements · Apply 80-20 rule to do more with less · Creative problem solving · Challenge assumptions · Ask What and why questions – think differently · Brainstorm creative solutions · Know how to sell radical ideas – overcome resistance · Think positively and act promptly · Follow radical improvements with continual improvements (Kaizen) · Attribute listing · Biomimicry · Brainwriting 6-3-5 · Challenge assumptions · Osborn checklist · Harvey cards · Lotus Blossom Technique · Redefinition · Reverse Brainstorming · Systematic Inventive Thinking · COCD Box · Force Field Analysis · Six Thinking Hats · Follow it with radical and incremental improvements Eg. · Reduce production time by implementing 5 S · Usability improvement in software that’s allows people to enter data with reduced no. of values to enter · Introduce new lighter material for vehicle body - reform production processes · Upgrade software with new technology which allows faster development, better performance and more features · Make simplified cars by cutting the number of parts in half · Extending software on multiple media allowing ease of access and seamless collaboration and eliminates duplication throughout the supply chain Conclusion: All the three techniques have different role in the lean journey and allows organization to identify and implement changes at different levels and magnitude of impact. Each of them are necessary and must be run in tandem for an organization to be truly lean and successful cause by just being innovative, a company may not be successful in long run as it may lose out on efficiency nor by just being a company which is strong on efficiency sustain itself in long run as lack of innovation will allow competitors who are innovative to beat it down in market.3 points3 pointsMeans Approach for problem solving Case 1 A cause may be necessary but not sufficient for a problem to occur. - This cause is must for problem to occur but cannot cause the problem alone. - There will be additional cause/s which are necessary & interaction of these causes becoming sufficient for problem to occur. - Find out other cause/s which are necessary for problem to occur. - Check which cause out of these is easy to eliminate & improvement made is easy to sustain. - Eliminate that cause to solve the problem. Case 2 A cause may be sufficient but not necessary for a problem to happen - This cause can alone cause the problem to occur - But there may be other cause/s also which can cause the problem to occur even in the absence of mentioned cause - Find out other cause/s which are sufficient for problem to occur. - Find out which cause is creating the problem most. - Start working on that cause. After eliminating the first one take next cause which causes the problem most & so on…. Case 3 A cause may be neither sufficient nor necessary for a problem to occur This cause is not the main cause for problem to occur - Find out the cause/s which are necessary for problem to occur. - If there is only one cause eliminating it will solve the problem. - If there are more than one necessary causes use approach mentioned for CASE 1. - If there is no necessary cause, find out significant cause/s & use approach mentioned for CASE 2 - If there is no significant cause also check interactions of probable causes & find out which interactions become significant. Then try to eliminate the easy to eliminate causes from each of these interactions to solve the problem. Case 4 A cause may be both sufficient and necessary for a problem to occur. - This is the main root cause for the problem. - There may be other root causes which are necessary for problem to occur but they will not able to cause the problem in the absence of this cause. - Eliminate this cause to solve the problem.3 pointsPersonal Excellence - Personal excellence is a concept. It means striving to become the best possible expression of who we are on a core level. Process Excellence - Process excellence is about process effectiveness and efficiency. It requires processes to be designed and improved for consistent delivery with minimum variation and minimum waste. It is the domain of Six Sigma and Lean." Operational Excellence -Operational Excellence is an element of organizational leadership and organizational intelligence that focuses on meeting customer expectation, all while stressing the application of a variety of principles, systems, and tools toward the sustainable improvement of key performance metrics. Business Excellence - Business Excellence is often described as outstanding practices in managing the organisation and achieving results, all based on a set of fundamental concepts or values. These practices have evolved into models for how a world class organisation should operate. Comparison: Process Excellence – effective, efficient processes Operational Excellence – process excellence plus some attention to HR, culture and systems thinking Business Excellence – the pragmatic pursuit and delivery of outstanding results for all stakeholders Personal Excellence - concept of one's self excellence, to derive best in him. Contrast - Operational Excellence can be used in absence of process excellence. However for an organisation's best interest Operational Excellence, Business Excellence and personal Excellence are equally important.3 points3 pointsDear Sandeep, Robotic Process Automation (RPA) is there in the industry for quite sometime now but more popularized in last 3 or 4 years. Considering the competition in every industry, every organization is trying to keep their operating cost low and provide the right product or service with right quality to the customers. It has become mandatory to every organization to search and implement new methods of production to improve the margins and quality at same time. RPA is becoming new buzz word or new method to talk and implement as every customer, organization, Industry are looking for change and a quick change. As a Lean Six Sigma Practitioner, our role has become more significant during initial stages of RPA implementations. In a simple way, A LSS Practitioner can identify and suggest the right opportunity to implement RPA by following structured method. Few debates are there saying that there is no involvement required from LSS Practitioners in RPA implementations as these would be pure technology driven. At the same time, I have observed that many projects are not able reach their end objective on time (Please read the line again... NOT ABLE TO REACH THEIR END OBJECTIVE ON TIME) due to lack of structured methodology during initial phases. A Lean Six Sigma Practitioner can support/add value to make the RPA projects success as below. 1) Understanding the objectives and preparing the business case for improvement 2) Establishing right metrics to measure the improvement 3) Preparing detailed VSM to identify highly manual repetitive time consuming process steps. 4) Estimating the benefits by performing cost vs. benefit analysis (All the processes may not yield greater ROI but many qualitative aspects to consider) 4) Design/Re-design the process to make it suitable for RPA (Please note that automating the process As-Is may not give desired results) 5) Standardize the input and handoffs 6) Support the RPA developers with suitable functional guidance 7) Tracking and Monitoring the projects with robust governance models (Depending on PMO structure in the organization) 8) Evaluating the outcomes (Metrics, Benefits) post implementation Depending on organization's project management structure, LSS Practitioner can have greater role to play in implementing RPA projects. Few organizations have started RPA consultant roles to manage all the activities mentioned above and few are managing with existing LSS teams. Fundamental method would be the same irrespective of organization structure however, LSS practitioners will have additional edge of LSS methods and concepts to get quick results. Hope this helps.3 pointsThis leaderboard is set to Kolkata/GMT+05:30


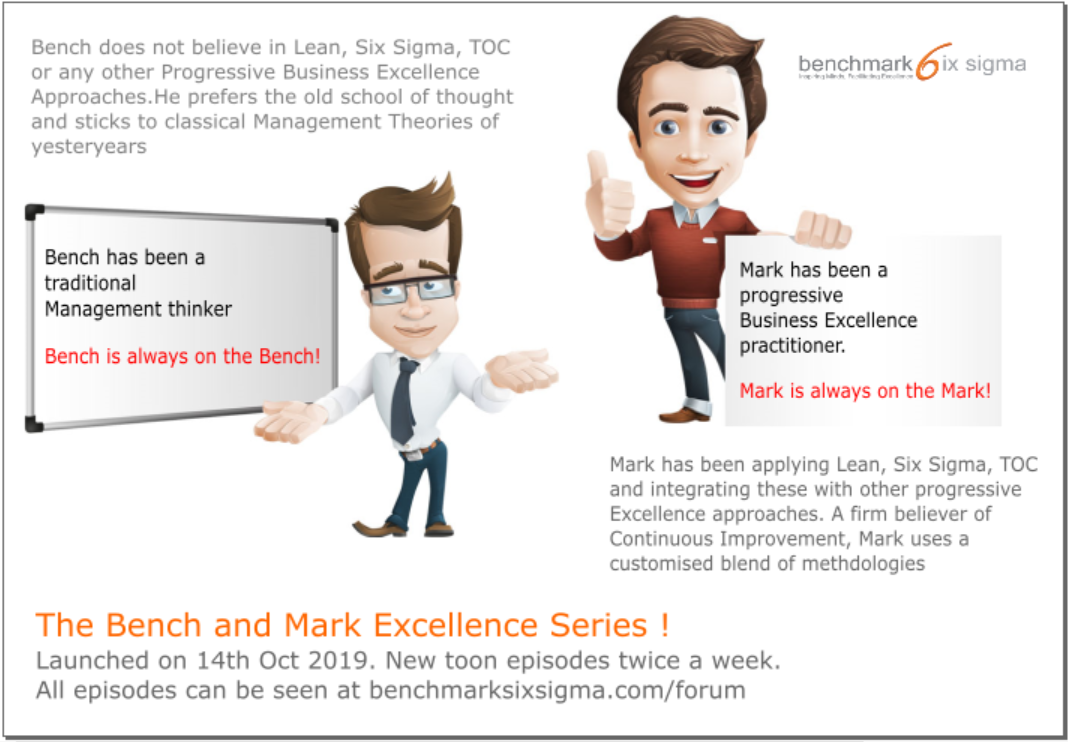


.thumb.jpg.3905d730e60a7d89c4765932a9ab340e.jpg)


