
Topics
-
Fifty-five women engineering students completed an AI bootcamp focused on rural Karnataka. Participants developed AI-based solutions after visiting villages and conducting field interviews. The She Innovates bootcamp partnered with several organizations to achieve its goals. This initiative aims to boost women's participation in AI and entrepreneurship. It encourages AI applications for rural development and community-focused sectors. View the full article
-
Besi's quarterly orders more than doubled, fueled by AI and hybrid bonding technology. The company saw increased customer adoption of its advanced chip packaging solutions. Demand for AI applications continues to drive growth in data centers. Besi anticipates revenue growth between ten and fifteen percent. This strong performance aligns with other semiconductor sector reports. View the full article


Leaderboard
-
Mohamed Asif Abdul Hameed
Fraternity Members2Points78Posts -
R Rajesh
Members2Points160Posts -
Natwar Lal
Members2Points50Posts -
Prasanna Pokhrel
Members2Points3Posts


Popular Content
Showing content with the highest reputation on 08/30/2019 in all areas
-
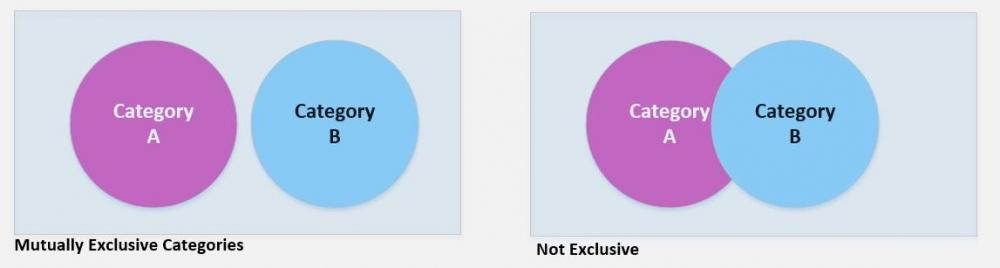
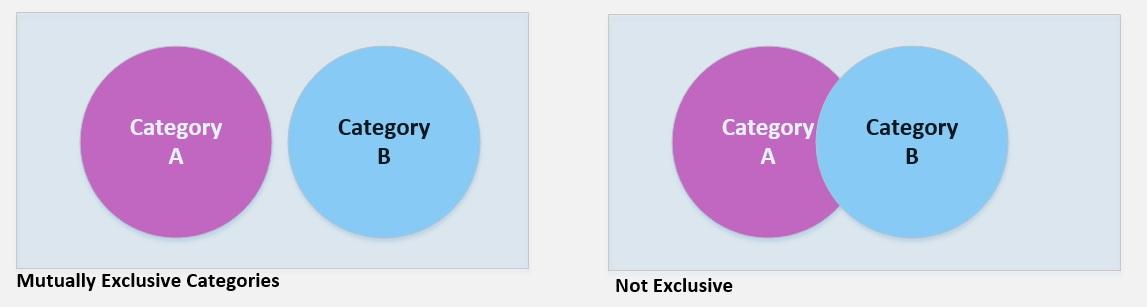
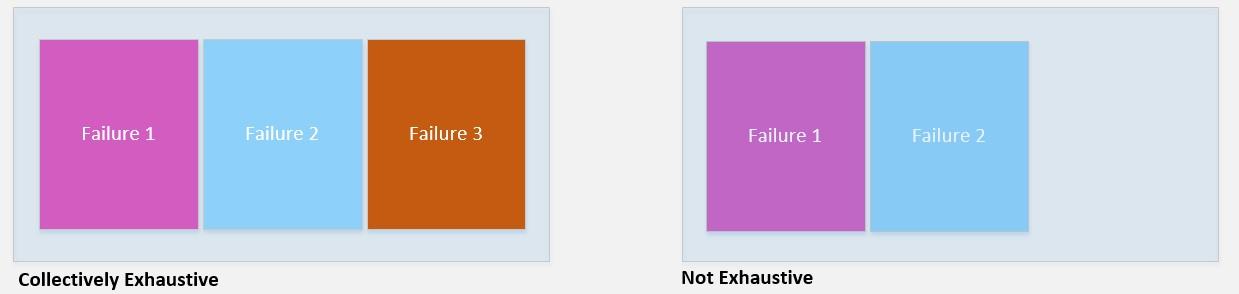
2 pointsPareto Analysis is used to separate Vital few from Trivial Many parameters. Vital few contributing to 20% and trivial many 80%. This principle is otherwise called as 80-20 Rule. It simply says, majority of the results come from minority of causes. In numerical terms, 20% of inputs are accountable for 80% of output 80% of productivity comes from 20% of associates 20% of causes are accountable for 80% of problem 80% of sales comes from 20% of customers 20% of efforts are accountable for 80% of Results Example Dataset: Metric Freq Percentage Cumulative Demand Exceeds Supply 232 24.12% 24.12% Incorrect Memory and CPU Usage 209 21.73% 45.84% Bandwidth Constraints 203 21.10% 66.94% Network Changes 64 6.65% 73.60% Fatal Bugs in Production 59 6.13% 79.73% Poor Front-End Optimization 52 5.41% 85.14% Integration Dependencies 39 4.05% 89.19% Database Contention 34 3.53% 92.72% Browser Incompatibility 23 2.39% 95.11% Device Incompatibility 14 1.46% 96.57% Hardware Conflicts 13 1.35% 97.92% Inadequate testing 9 0.94% 98.86% Too much code 6 0.62% 99.48% Exception handling 5 0.52% 100.00% Classification: Public Pareto Chart: Classification: Public Some of the common misuse include below scenario’s: Working only on Vital few parameters: There could be other potential parameters were the frequency is less and which falls on one of the trivial many factors, however when criticality or the severity of the potential parameter is high, since the frequency is low it is not considered and underestimated. For the referred example, Inadequate testing can be critical, if there is insufficient test case or when the test review is poor it can lead to multiple production issues, which is not factored when focusing only on Vital Few. On a ideal situation, 80% of the resource should focus on reducing the vital few and 20% of the resource working on minimizing trivial many parameters. Using pareto for defects belonging to multiple categories: Another misuse of pareto analysis is when combining defects from multiple categories. We need to clearly understand that categories must be Mutually Exclusive. Using Pareto when parameters are not collectively exhaustive: What is collectively exhaustive? Collectively, all the failures in the list should cover all the possible failures for the problem., that is, there should not be any gap. Definition: Events are said to be collectively Exhaustive, If the list of outcomes includes every possible outcomes. Performing analysis on small data sets/few data points: For statistically significant analysis, we will have to use relatively large data sets rather than working on small data points. At the same time number of categories need to be practically large enough. above pareto analysis, does not make sense, when the data set is relatively small. Inaccurate measuring: Visually looking in the pareto chart and selecting the Vital Few rather than considering cumulative % < (less than) 80% Analyzing defects only once: Pareto Analysis should be performed before the problem is solved and during the implementation period to see the trend and Post improvement. It is repetitive and iterative process, rather than running only once and focusing on the defects that were identified during the early stages of the analysis. 80 + 20 should be 100; and not 75 - 20 or 90 - 40 Considering 80 in the Left Axis: Left axis displays frequency and right axis the percentage, some time when people consider 80 in left axis leading to selecting wrong vital few could lead to poor problem solving. Flattened Pareto Analysis: If there is any bias in data collection methods, we might end up with bars being flat, this happens mainly when we are separating / breaking vital problems into small problems. It does not make sense to proceed with Pareto Analysis. Rather work on action plans based on the severity and criticality. Considering defects as Root Cause: Considering Vital defects identified during the analysis as Root Causes, and not analyzing further/deep dive to understand the root cause. This will not potentially stop the defect in occurring rather it would be applying band-aid scenario for the identified loop holes.


 2 points
 -
2 pointsMisuse of tools and techniques is a very common phenomenon. Misuse of a tool primarily happens because of two reasons 1. Intentional Misuse (it is better to call it as Misrepresentation) 2. Unintentional Misuse (due to lack of understanding of the concept) Pareto analysis or the 80/20 rule is a prioritization tool that helps identify the VITAL FEW from TRIVIAL MANY. 80/20 implies that 80% of problems are due to 20% of the causes. Intentional Top 20% causes might not be the ones leading to bigger problems - usually it is observed that causes with smaller effects occur more often. Applying the Pareto principle will divert the focus of the team to the causes that have a smaller effect on the customer while the actual cause might be languishing in the trivial many Prioritization without keeping in mind the goal - Pareto will help if the significant contributors identified help us achieve the goal. However, it is seldom checked whether the VITAL FEW will help us achieve the goal or if there is a need to take a larger number of causes. As an example, if our goal is complete defect elimination, we will need to consider all causes. If our goal is elimination of 95% defects, we will need to cover more of the cause. Unintentional Going strictly by the 80/20 rule - some people take the 80/20 principle in the literal sense. They will do a Pareto plot and blindly apply the 80/20 principle. What needs to be noted is that 80/20 is a rule of thumb and it is not necessary to always have 80/20 split. It could also be 70/30 or 90/10 Keeping the total to 100 = 80+20. This is one of the most common misunderstanding of the 80/20 rule where one beliefs that the sum should always be 100. It could be 80/15 or 75/25 as well Unclear about the purpose of using a Pareto Analysis. Pareto can be used while defining afocus area and also in Root Cause Analysis to identify significant contributors. In the former, data is for problems and their occurrence while in the later, it is causes and their occurrence. Due to lack of clarity of purpose, if problems and causes are clubbed together in the same Pareto, then meaningful inferences cannot be drawn. Treating Pareto as a non-living tool - Pareto is usually done once and the same result is treated as sacrosanct for a long period of time. Pareto chart only provides a time snapshot. Over a period of time, the defect categories or causes and their occurrence numbers might also change and hence if Pareto Analysis is done at different points of time, it might yield different results Some that could fit in both categories Small data set - Pareto Analysis will help if you want to prioritize vital few from a big data set. Doing a Pareto analysis on 4-5 categories will seldom yield a good result Completely ignoring the trivial many - Pareto analysis helps identify the vital few but it does not say that one should ignore the trivial many. It simply states that first fix the vital and then move on to trivial. However, most people consider that if they fix the top 20%, they do not need to work on the remaining. Pareto can be used to continuously improve the process by repeatedly prioritizing the causes that you need to focus on Doing Pareto at a high level only - Like most of the tools in Root Cause Analysis, Pareto can also be used to drill down. E.g. Pareto can be done first to identify the top defect categories and then a second level Pareto can be done for the top defect categories (using the causes)2 points
-
1 pointWhile most of the answers very well highlight the misuses of Pareto Analysis, the most comprehensive answer is that of Natwar Lal; thereby marked as the best answer. His idea of mentioning intentional vs non-intentional misuses is interesting. Benchmark Expert View has been provided by Venugopal R.1 point
-
1 pointPareto principle is an effective root cause analysis (RCA) tool which help us separate the vital few factors from the trivial many without having to conduct deep research into each of causes of key factors, however, if not applied well, we may run into oversimplification of critical factors which may not resolve the issues or take us in a different direction from the real factors which actually affect the business outcomes. There are some inherent limitations of Pareto principle and if these are not taken into account wrong conclusions may be drawn while applying the principle: Historical Data: Based on historical data & does not account for the changed dynamics of the present. If for example 20% of the customers currently contribute to 80% of revenue, incorrectly applied Pareto conclusions may lead the business to ignore the others which may have greater untapped revenue potential. Does not take into account the future possibilities : Pareto Principle is descriptive & not prescriptive, so it will be a mistake to use it for forecasting future patterns. May not apply to all business phenomena: In some cases it is entirely possible to have evenly distributed causal factors or may have only one significant cause with others being more or less equally distributed. e.g. 80% of system downtime may not be directly linked to in 20% of the computers. Based on quantitative data only & ignores human factors which may have considerable influence on the outcomes. E.g. in a ten member team, while there may be significant productivity variations, it is unlikely that 2 people will contribute to 80% of the work. Data independence: While we take care to have mutually exclusive & collectively exhaustive (MECE)data as far as possible, interrelationships between the causal factors may not be ruled out as in real life, they may not be totally independent of each other. Pareto works well on a large data sample & may not apply well in those with few samples & causal factors Short period data may be lopsided & may not reflect the true behavior of the process when observed for a long period & this may lead to incorrect conclusions Very long period data may not account for changes in the nature or attributes of the causal factors over the time period. E.g. while looking at response times, the fact that information processing system may have undergone key upgrades and changes over time may be overlooked. Data collected from unstable processes or outlier events may lead us to draw incorrect conclusions 80 & 20 do not necessarily equal to 100: the 80% & 20% do not refer to the same elements & hence do not necessarily total to 100%. The 80% represents the result / outcome or Y whereas 20% represents the causal factor/ input or X. It is not correct to take them together for making a 100% as may be mistakenly done. Mistaking the 20% drivers for root causes: The 20 % causal factors are only the categories that contribute to the 80% of out outcome, these are NOT the root causes, which will need to be understood further by conducting further analysis. The mistake here is to stop at the vital few identified & not go deep into the looking at the root causes. Not reviewing the "Others" category: Typically we tend t ignore the "others" category while looking at Pareto, however, if this category has key drivers, it would not be a wise decision to ignore them completely as there could be significant business implications , especially if business environment & other factors change.1 point
-
Q. 188 Explain the common challenges in Severity Assessment as a part of PFMEA (Process Failure Mode and Effects Analysis). Also mention how these challenges can be addressed. Note for website visitors - Two questions are asked every week on this platform. One on Tuesday and the other on Friday. All questions so far can be seen here - https://www.benchmarksixsigma.com/forum/lean-six-sigma-business-excellence-questions/ Please visit the forum home page at https://www.benchmarksixsigma.com/forum/ to respond to the latest question open till the next Tuesday/ Friday evening as per Indian Standard Time. The best answer is always shown at the top among responses and the author finds honorable mention in our Business Excellence dictionary at https://www.benchmarksixsigma.com/forum/business-excellence-dictionary-glossary/ along with the related term.1 point
-
Some of the common challenges in conducting severity rating in PFMEA are listed below along with some thoughts on how these could be mitigated. 1. Understanding the ordinal rating scale: Interpretation of ordinal rating scale may be different from the interpretation of ratio scales and there might be the risk of drawing incorrect assumption. For example if the rating scale gives 3 likely and 6 very likely , in the rating, the impact may be significantly different from that of 2 & 4 and not exactly double the rate (as is the ratio in both the cases). The range, however, may be considered as such if the rating scale is not well explained. The solution is to have detailed discussion on the assessment mechanism including the rating scale. 2. Different rating scale for different industry: The severity rating scale may have very different implications for example, the rating scale used for healthcare industry will have very different scaling parameters and levels vs insurance industry or automobile industry. This challenge can be addressed by working with the actual team members & the respective functional leaders to design a rating scale which is relevant to the organization. 3. Difference in interpretations: Even in case of the same rating scale being provided, there could be difference in interpretation of the severity & impact of a possible risk based upon the personal experiences of the person conducting the assessment. The solution in such a situation is to have calibration meetings to ensure that every one is on the same page. 4. Cognitive Biases: The challenge in using rating scales and not statistical data in arriving at severity rating is that it may be subject to cognitive biases as follows: a. Only takes in to account "known -unknowns" & does not plan and design suitable response mechanisms for black swan events & "Unknown-Unknowns) b. Availability : People will typically ignore statistical evidence and base their estimates on their memories, which favor the most recent, emotional and unusual events which have a significant impact on them. c. Gambler’s Fallacy: People make the assumption that individual random events are influenced by previous random events which might be spurious correlations and may not have causal relationships. d. Optimism bias: People overestimate the probability that positive events will occur for them, in comparison with the probability that these events will occur for other people. e. Confirmation bias: People seek to confirm their preconceived notions while gathering information or deriving conclusions. f. Majority: People may go with the assessment of majority to conform with the group at the cost of their objective opinion which may be truer representation but different from the group opinion. g. Self-serving bias: People have a propensity to assign to themselves more responsibility for successes than failures. h. Anchoring: People tend to base their estimates on previously derived/ used quantities, even when the two quantities are not related. i. Overconfidence: People consistently overestimate the certainty of their forecasts. j. Inconsistency: When asked to evaluate the same item on separate occasions, people tend to provide different estimates, despite the fact that the information has not changed. Solution in this case is to screen out whether the ratings have been influenced by these biases and inform the participants in advance to consider whether the ratings may have been influenced by such biases. Other mitigation measures could be blind peer rating or benchmark comparison with industry ratings for similar processes. 5. Interdependence between causal factors and failure modes: FMEA assumes that each risk is an independent event, whereas there may be a high degree of interdependence between factors which could influence risk rating significantly. Understanding and articulating such interrelationship could be challenging & not considering such impact could mean that the assessment is not representative of the possible risks & the resulting impacts. The way to mitigate this is to have a detailed discussion with all the relevant stakeholders & the process expert in a well-designed structure to ensure that all the risk and their interrelationships are well understood and documented. 6. Challenge in considering the effect on both the customer or the process (assembly/ manufacturing unit). As against DFMEA(Design FMEA) where we look at the effects on the customer , in process FMEA, we will need to consider the impact & hence the severity rating of the failure mode if it impacts both the process & the customers. This is because, the impact of the failure mode in this case will mean the impact on the process or the customer in both the cases. This leads to more complications in having to consider multiple scenarios. This challenge can be mitigated by taking the higher of the severity rating of the failure modes for other the process or the customer as the severity rating for the causal factor/ failure mode. 7. Challenge in deconstructing the impact of Root cause vs. assessing failure mode. Though there is a perspective that in some cases Root Cause and Failure Modes can be used interchangeably, however, if we drill down further, it is evident that root cause analysis is typically conducted post facto (after the event) whereas Failure modes identification happens proactively and will take into account various other factors apart from the proximate cause. The challenge is to ensure that this understanding percolates to the team creating the FMEA document. 8. Challenge in ensuring the risk assessment as an ongoing process vs as a single time activity - Risk assessment (including identification & severity assessment) has to be an ongoing process & not a single point in time activity ( as the severity and impact may show material change in cases where there have been significant changes in either internal or external drivers, process dynamics or in key the environmental factors). The challenge is ensure that the rigor of assessment is maintained & updated with any relevant changes. The solution in this case is to have a monitoring / governance mechanism which will ensure that FMEA is kept as a live document with relevant updates to ensure correct risk rating. 9. Challenge in considering the impact due to timescale: E.g. the impact of a risk manifesting immediately may be significantly different from that which may manifest after some time. The solution would be to conduct time-scale analysis of such risk factors to take into consideration the impacts of recent events and see whether the severity rating could change in such cases.1 point
-
We are going to discuss all about PFMEA process Failure Mode of Effective analysis . Before that let’s have look on FMEA i.e Failure Mode of Effective analysis. FMEA is tool used to prioritize identify, quantify and evaluate the risk. Goals Reduce the Failure Risk Detection of Failure are ensured Prevention of failure Why FMEA : FMEA is to track Failure of potential Reduce the risk counter measures to be taken In success of FMEA it starts with capturing all requirement properly and arranging potential failure modes. FMEA has 3 Points Failure Mode Failure Effect Failure cause There are 3 Types of FMEA Design Failure Mode of Effective Analysis : This method is to detect error in design . for ex : if any dimensions or size of product varies with standards due to which risk generates Process Failure Mode of Effective analysis: This method is to detect error in process . for ex : If any problem with Ids System Failure Mode of Effective analysis: This method is to detect error in System Process Failure Mode of Effective analysis The primary objective of PFMEA is to give proof of specific cause failure. If this can not be given then next level is mistake proof ,where team has to come up with ways of catching either cause or failure of specific failure mode of defect. PFMEA approach is to Identify ,reveal potential of failure Recognize function with process which reduce opportunity of potential To prevent out of conformance based on current details and document the process. Work towards corrective and prevention RPN: Risk Priority Number is component of PFMEA, It deals with 3 factors Severity: Seriousness of problem. It is rated in range of 1 to 10. Depending on how seviour problem is . if it is 10 then it may be without information If problem not effect function then it may 1 or 2, for ex if color of any product which is working fine is not so suitable. Occurrence: This is opportunities to raise the issues or problem it is rated from 1 to 10. The error which occurs or repeat highest then it extreme value toward 10 Detection: Identifying the problem, Rated between 1 to 10. The problem detected fery easily with less effort or which reflects its existence more is 10, Risk Priority number = product of Severity, Occurrence and detection RPN= S * O * D Highest value of RPN is 1000 and lowest value of RPN 1 How to Address the PFMEA A Team need to Formed with process owners Expectations to be set about goal, objective and duration of time line Team has to go through process MAP Implement process map in FMEA step by step AS team work on Severity, occurrence and detection scores. When team will get RPN value work on corrective measures Corrective measures to be tracked for consistency.1 point
-
1 pointFrom what i have seen or observed , general human tendency is to do Correlation and Comparison of things. People correlate one thing to another thing and compare things(objects, persons (read attributes/characteristics)...). Why they do this ? Because the human beings are trained and taught to do so since time immemorial. Man is a social animal with plenty of knowledge!! Human tendency is to go from a 'known' entity to an 'unknown' entity, in many cases. So the comparison starts from there. What are we trying to say by "Apple to Orange" comparison. It does mean that we are trying to compare two different things(in reality it could be about some objects or about some human beings). In the case of human beings, the comparison could be about their characteristics , in a personal context; skill set, experience-level, soft- skills, etc... in a professional context. So why is this important ? Because as a human brain is naturally aligned to compare people , it does not see what/whom needs to be compared with what/whom. This is the generic behaviour which needs to be consciously be changed by every individual to stay balanced. Apple to Orange comparisons , therefore would happen in reality in several cases, though the comparison often would be unfair. Let us see some examples where 'Apple to Orange' Comparison becomes necessary 1. In an IT organisation, an experienced employee(10+ year exp.), resigned from his job. As his job was a billable position, the service providing company found a lesser experienced(1 year) professional to replace the experienced professional. The customer knew the experience of the replaced staff. But a week later, the customer is not happy with the performance of the new staff stating the team that new staff needs to be upto speed and expects the quality as he got from the experienced person. Here clear 'Apple to Orange' Comparison has happened. Both the experienced employee(resigned) and the new employee have knowledge in that technology(Advanced Java) but the knowledge gap is wide. But for the customer, this is immaterial. He needed the same quality as it was earlier. The onus will be on the service provide to bridge the gap but the point is this comparison is made because the customer is expecting the same quality. 2.In an appraisal process in an IT company, all the team members(TM) were appraised. TM1, TM2, TM3 were all experienced in that order - with 10,7,5 years of experience respectively. TM4,TM5,TM6,TM7- were experienced with 4,2,1,1 years respectively. TM5,TM6, TM7 felt that it was unfair to compare them with senior TMs (TM1, TM2). They felt that they were feeling the pressure. Even though the project mgmt team had done some criteria for each experience, still the lesser experienced TMs felt that appraising them with the seniors would not help their appraisal. This is often the case we would come across many teams in many industries. 3. While doing software estimation: a). Say you have a start up company and you have got few development projects. Suddenly you get an enhancement cum maintenance project. Since you do not have an estimation template for an Enhancement , you rely on your estimation template for Development . You compare that (only to see if you get any initial idea) and try to tailor to suit your enhancement project requirements. In reality this could be a failure. b). Say you have an estimation model for Java/J2EE technology . Now you are getting a mainframe project and you do not have an estimation model for it. Now you decide to take a leaf out of your Java/j2EE estimation model and take that as basis for your mainframe estimation. In both the cases, we are making an Apple to Orange comparison ,as we are left with no choice but go from 'known to unknown' entity (to begin with). 4. How many times we would have seen the fact that to find the Greatest of All Time (GOAT) in a sport, we compare people who played the sport in different eras? Imagine how that sport would have been played in each era. Then how will you find GOAT ? Of course. various factors might be considered by the agencies (companies/relevant parties) which decide on the GOAT. Sometimes multiple Agencies who pronounce the result on GOAT, choose different players as the GOAT (they do not concur), because they may choose different factors. So to find the GOAT , we are making an Apple to Orange comparison and we try to minimise this indifferent comparison by bringing in various factors. Otherwise how can you say , who is the greatest cricketing batsman of all time, greatest tennis player of all time, greatest golfer of all time ? How difficult or easy to compare a tennis player who played lawn tennis in a wooden racquet, with a tennis player who played his tennis in synthetic hard court with a graphite racquet? Is there any technique to carry out such a comparison? Honestly am not sure if there is any technique. I could think of few things however which can give some quick guidance , in my opinion. 1. Organisational Process Assets (OPA) - Previous projects could have done like this and could have updated the organisation's repository - Documents could be like logs, Excel sheets, Lessons Learnt etc.,. Those artifacts can have data on the comparable entities and the associated data that was required for each of the comparable entity and the decisions made on the comparison. 2. SharePoint, Online database - Where Information or factors deciding the comparison can be captured; data about comparable entities Conclusion: Comparing things is a human mindset and has become a prerogative. Nothing can stop a person from comparing things . In a business context, this comparison takes importance because of cut-throat competition across the globe in every industry.Therefore , Apple-to-Orange Comparison , even though it may seem not correct, it is becoming increasing essential part of our day-to-day life.1 point
-
1 pointWhy Baselining is important Baseline is the first step for anyone to understand how well a process is working or should work and then how much further we can achieve or take it to the next level. In order to calculate the process baseline sigma, we need to have the following information at hand: 1. No of units that a process can produce 2. Total no. of defects opportunities per unit 3. Total no. of defects Let us take an example: In a software development project for an online site (a java language web based application), 30 files (codes) are there. Customer is moving to Agile framework for the first time and is ok to have 10% defects for the first quarter. There are 5 opportunities to produce defects per file. S.No Opportunity 1 Usage of console - Print statements for debugging purpose which will clog memory 2 Code Not structured properly 3 Not handling Exception properly 4 Improper Relational Database handling 5 User Interface guidelines not properly followed Here is the defects count for each file Files Defects Count File 1 3 File 2 2 File 3 3 File 4 4 File 5 5 File 6 5 File 7 5 File 8 2 File 9 4 File 10 1 File 11 0 File 12 0 File 13 2 File 14 3 File 15 4 File 16 2 File 17 2 File 18 3 File 19 1 File 20 4 File 21 5 File 22 2 File 23 3 File 24 2 File 25 1 File 26 2 File 27 3 File 28 2 File 29 1 File 30 2 Total Count 78 To calculate the DPMO Total number of Defects (D) = 78 Number of units (N) = 30 Total number of defects Opportunities (O) =5 Defects Per Million Opportunities (DPMO) = 1000000 * (D/N*O) = 1000000 * [78/(30*5)] = 1000000 * 78/150 =520000 This is equal to 1.45 Sigma (with 1.5 shift) with yield at 48% and a 52 % defect which is much higher than the customer baselined - 10% defect allowance Now a process improvement was put in place. Coding Standards were introduced and a code review process was put in place. Now with this improvement in place, the opportunities for a defect to happen got reduced to two. S.No Opportunity 1 Improper Relational Database handling 2 User Interface guidelines not properly followed Number of units (N)=30 Total number of defects Opportunities (O) =2 Files Defects Count File 1 0 File 2 0 File 3 0 File 4 0 File 5 0 File 6 0 File 7 0 File 8 0 File 9 1 File 10 0 File 11 0 File 12 0 File 13 0 File 14 0 File 15 0 File 16 0 File 17 0 File 18 0 File 19 0 File 20 0 File 21 0 File 22 0 File 23 0 File 24 0 File 25 0 File 26 0 File 27 0 File 28 0 File 29 0 File 30 1 Total Count 2 Total number of Defects (D) = 2. Note the 2 defects are due to the one file having database error and another file having User Interface guideline issue. Number of units (N) =30 Total number of defects Opportunities (O) =1 Defects Per Million Opportunities (DPMO) = 1000000 * (D/N*O) = 1000000 * [2/(30*1)] = 1000000 * 2/30) = 66666.66 This is equal to 3 Sigma (with 1.5 shift) with 93.3 % yield and 6.7 % defect, which is well below the 10% baseline allowance from the customer. As we see, there is a drastic improvement in the yield and the process improvement made has virtually eliminated all but 2 defects. So the state before and after the process improvement is vast The baseline can even be re-shifted to this new state(6.7%), since the new improvement process is quite capable of producing lower amount of defects. Conclusion Thus we can observe how baselining helps us to know the current position of the process and how much we can improve on our process. We also saw how performance made, after an improvement is having vast difference with the performance made before improvement and how adjustment is made to have a proper comparison.1 point


This leaderboard is set to Kolkata/GMT+05:30