Mohamed Asif Abdul Hameed
Fraternity Members
-
Joined
-
Last visited
-
Mohamed Asif Abdul Hameed replied to Vishwadeep Khatri's topic in We ask and you answer! The best answer wins!Picking the best idea is the most critical part during the improve phase, when there is multiple solution available and identified, best way is to go data driven, structured and inclusive approach. We can go one step ahead by choosing the Strategic Best Fit (Best Aligned Option) and not just the Best Idea, reason being most of the time the best solution on the papers is not the best fit operationally. Some of the consideration includes that of: 1) Is this solution rolled out to multiple teams across the organization? - Scalability 2) Will this idea/solution work on long-term? potentially considering on-going, upcoming changes - Organization and Industry wide - Sustainability 3) Does this align with the team preference? considering the resource ecosystem - Team Alignment This in fact should be done with the cross functional stakeholder and leaders to get the broader clarity so that Involving them early and frequently and leveraging the Change Management System in the organization. This will bring down the resistance to change in a significant way. Below is the holistic structured data driven approach that could complement the POV. "The Decision Matrix." "The best idea is the one that scores high not just in creativity, but in feasibility, impact, and alignment with organization needs."

-
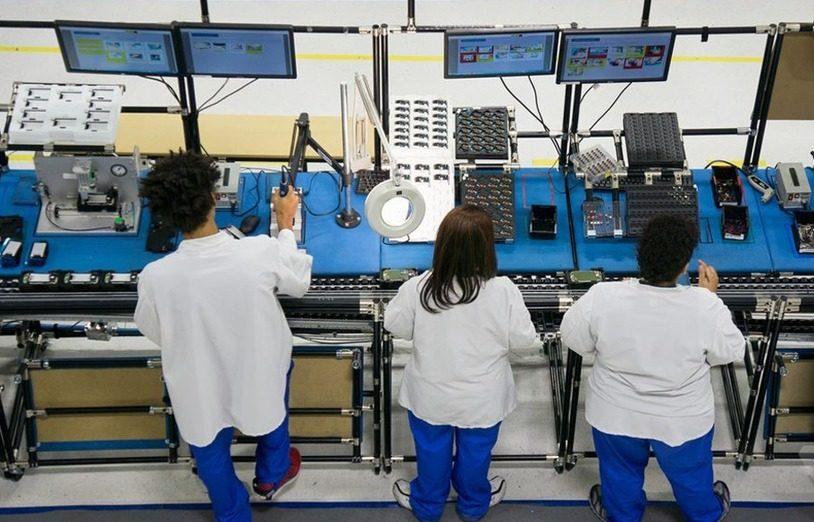
Mohamed Asif Abdul Hameed replied to Vishwadeep Khatri's topic in We ask and you answer! The best answer wins!Mohamed Asif Abdul Hameed replied to Vishwadeep Khatri's topic in We ask and you answer! The best answer wins!Control charts provides us powerful insights into process performance, variability, and stability, and help us in making data-driven decisions to improve the quality of our outputs. Typically, control charts help us in getting below insights Identifying process stability Detecting process variation Predicting future process performance Comparing different processes Communicating process performance We have 2 charts, the upper chart typically displays the process data in the form of a line graph or scatter plot, while the lower chart displays a measure of the variation in the data. The two charts are typically complementary and together help to monitor the performance of a process over time, and to detect any unusual variation or changes that might be occurring. Using two charts together helps us in understanding the comprehensive picture of the performance of a process. In Xbar-R, the Xbar chart can help us see whether the process is stable and centered around a target value, while the R chart can help us see whether the variation within subgroups is consistent over time. If the variation in the process is consistent, the R chart should show relatively small and consistent ranges. If the variation is not consistent, the R chart may show large and/or inconsistent ranges. In I-MR, the I chart shows the individual data points plotted over time, and the MR chart shows the moving range between each successive data point. By using both charts together, we can monitor both the average level of the process and the variation in the data. In Xbar-S, Xbar chart shows the average value of the process data within each subgroup, and the S chart shows the variation within each subgroup. To conclude, using both control charts together can help us identify potential problems or changes in our processes, and take corrective action before the process goes out of control.Mohamed Asif Abdul Hameed replied to Vishwadeep Khatri's topic in We ask and you answer! The best answer wins!Workload balancing is a crucial component of lean manufacturing as it helps to bring down the lead time, increase the productivity, and enhance the overall quality. It refers to the process of allocating work among the team members to ensure each one is being utilized efficiently and effectively. This is done to eliminate any bottlenecks or waste in the production process. There are three things that have an obvious impact on balancing the production workload: Amount of work content at each operation involved in the overall process. Variations in customer demand, which deplete or overload the production process. Ability to implement “Heijunka” or “production smoothing” to overcome these problems. To simplify, by referring to the above diagram, we can see that operator A’s tasks add to 55 minutes, operator B’s 45 minutes, operator C’s 30 minutes, operator D’s 15 minutes. We can simply give operator D’s tasks to operator C and redeploy operator D to where they are needed more. In this case we have a 25% direct reduction. Below are some of the top considerations for workload balancing in manufacturing setup: Capacity of Workstations Type of Product Skillset of Workers Production Schedule Below are some of the considerations for workload balancing in service industry: Service Capacity Type of Service Customer Needs Service Schedule AI can play a vital role in workload balancing by automating tasks that can be optimized and to analyze data to make better decisions. Listed few examples of leveraging AI and ML for workload balancing: Predictive Analytics Forecasting Task Automation Resource Optimization Real-Time Monitoring Decision Support Personalization Examples of workload balancing in Service industry: Restaurant Staffing Call Centre Management Healthcare Staffing Retail Staffing Hotel Staffing In all these examples, workload balancing is used to optimize the allocation of resources and staff, ensuring that customer needs are met while minimizing employee stress and improving overall efficiency. Similarly, in a manufacturing setup, workload balancing can be applied in following areas, ensuring that production demand is met while minimizing machine downtime and improving overall efficiency. Assembly Line Staffing QC Inventory Management Maintenance Scheduling Production Planning We can use any of the below formulas to calculate and manage the work load better: Capacity Utilization: Capacity Utilization = Actual Output / Potential Output. Workload Index: Workload Index = Workload / Staffing Levels. Efficiency Rate: Efficiency Rate = Actual Output / Standard Output. Staffing Ratio: Staffing Ratio = Staffing Levels / Production Demand. Lead Time: Lead Time = Total Processing Time + Wait Time. These formulas can be adapted and customized to fit the specific needs of an organization or industry. The goal of workload balancing is to optimize resource allocation, reduce workload imbalances, and improve overall efficiency and productivity. In general, by leveraging artificial intelligence and machine learning, we can improve efficiency, reduce errors, and improve employee satisfaction and organizations can improve their competitiveness and better meet customer needs.
 Mohamed Asif Abdul Hameed replied to Vishwadeep Khatri's topic in We ask and you answer! The best answer wins!The decision to choose between batch processing and one-piece flow depends on several factors, including that of: 1. Product Characteristics: The nature of the product that is being manufactured can greatly influence the choice between batch processing and one-piece flow. If the product has a high volume and is repetitive in nature, batch processing may be more efficient. On the contrary, if the product has a low volume and requires customization, one-piece flow may be more effective. 2. Demand: The level of demand for the product is also an vital factor. If the demand is high, batch processing may be more efficient as it can produce a large volume of the product rapidly. However, if the demand is low, one-piece flow may be more effective as it can produce the required quantity without creating excess inventory and avoids waste - Pull rather than Push. 3. Equipment: The type and capacity of the equipment used in the production process can sometime influence the choice between the two. If the equipment is designed for batch processing, it may be more efficient to use this method. However, if the equipment is flexible, meant for customization and can handle small batches, one-piece flow may be more effective. 4. Labour: The availability and skill level of the workforce can also influence the choice between batch processing and one-piece flow. If the workforce is highly skilled and can work efficiently in a one-piece flow environment, this method may be more effective. However, if the workforce is less skilled, batch processing may be a better option as it requires minimal skill and training. 5. Cost: The cost of production is one of the most important factor to consider. Batch processing may be more cost-effective as it can produce a large volume of the product quickly. However, one-piece flow may be more cost-effective in terms of reducing inventory, reducing lead times, and improving quality. Overall, the decision to choose between batch processing and one-piece flow should be based on a careful analysis of the above factors and should be aligned with the organization's goals and objectives. The selection between batch processing and one-piece flow can have significant impacts on quality, productivity, and lead time in a manufacturing process. Quality: Batch processing can result in higher defect rates as it can produce a large volume of defective products before the defect is identified and corrected. One-piece flow, on the other hand, allows for immediate detection and correction of defects, resulting in higher quality products. Productivity: Batch processing can result in longer setup times and longer processing times, which can reduce productivity. One-piece flow, on the other hand, can reduce setup times and processing times, resulting in higher productivity. Lead Time: Batch processing can result in longer lead times due to the time required to produce a large volume of products before they can be shipped. One-piece flow, on the other hand, can reduce lead times as products can be produced and shipped in smaller quantities and with shorter processing times. All in all, one-piece flow can result in higher quality, higher productivity, and shorter lead times due to its ability to reduce defects, setup times, and processing times. However, batch processing may still be a viable option for high-volume, repetitive products, or when equipment is not flexible enough to handle small batches. Eventually, the selection between batch processing and one-piece flow should be based on a careful analysis of the product characteristics, demand, equipment, labour, and cost, and should align with the organization's goals and objectives. Batch processing examples: Food and beverage industry - producing large batches of canned or bottled products, such as soft drinks or canned vegetables. Bakery: Most bakery uses batch processing to produce large volumes of bread. The dough is mixed in large batches, which are then divided into smaller batches for shaping, proofing, and baking. Pharmaceutical industry - producing large batches of medications or supplements, such as tablets or capsules. Textile industry - producing large batches of fabrics or garments, such as a batch of 5000 t-shirts. One-piece flow examples: Automotive industry - producing individual car parts or subassemblies, such as engines or transmissions. Aerospace industry - producing individual airplane parts or subassemblies, such as wings or landing gears. Electronics industry - producing individual circuit boards or electronic components, such as microchips or resistors.
 Mohamed Asif Abdul Hameed replied to Vishwadeep Khatri's topic in We ask and you answer! The best answer wins!DPU is measure of average number of defects per unit. DPMO is the measure of number of defects per million opportunities. Yield % is the measure of proportion of products that pass the assessment or QC stage. DPMO or DPU are used when the defects are discrete in nature and when it can be counted on a unit basis. Yield% is used when defects are assessed on a pass/failure, true/false basis, mostly in quality control or during quality inspection. Appropriate metric depends on the specific context, specific goals and the requirements of the processes in the organization and can differ from case to case basis. Minor, major and critical defects may be weighted differently in terms of their impact on the overall quality of the prod or service. So, it is recommended to use weighted metrics that accounts the severity of each defect. Software development example: When we are tracking number of defects in the code and when we identify 100 defects out of 10000 lines of code. DPMO would be: DPMO = (100 / (10,000 * 1,000)) * 1,000,000 = 10,000 For DPU, when we have identified 50 defects in the user interface and when the mobile application has been downloaded and installed on 1000 devices. The DPU would be: DPU = 50 / 1,000 = 0.05, meaning on average there are 0.05 defects per mobile device. Yield %, during QC, when we run tests on 100 instances with 90 passing the test. The Yield% would be: Yield % = (90 / 100) * 100 = 90% To conclude, when we track both defects and defectives, we can use DPU or DPMO to measure the number of defects per unit or per opportunity and over an above use yield% to measure the proportion of defect free units. So, choice of metric depends on: Specific context / goals Type of defect and Impact on overall qualityMohamed Asif Abdul Hameed replied to Vishwadeep Khatri's topic in We ask and you answer! The best answer wins!Over Production is producing more than what is required, producing earlier or faster than when is required to be used by the end customer. Over Processing is a non-value-added processing step and the efforts add no value to product or service from clients and customers standpoint Over production examples: Producing more than client’s demand of good, service, product, detail, or any information for that matter. • Production of excessive number of quantities than required by the user. • Production of reports which are not used. • Buying before the need is specified. • Huge snacks in bars • Passenger trains with more wagons than necessary • Overstaffed sales stores • Too many meetings or the wrong folks in meetings • Printing all forms instead of obtaining the information in a laptop • Multiple forms with same data • Staff meetings held when it could have been communicated in an electronic mail. • Unstable production scheduling. • Incorrect forecasting model How can we eliminate overproduction? Better planning to understand customer demands. Sending out survey to find out how many people will attend the meeting to plan for snack boxes. Clarity on – How much, when, what can avoid over production situations. Over Processing Examples: Each pointless activity which is required to produce a service, goods based on customer’s expectations. Doing the same thing for the second time (e.g., double check of computations). • Signs, forms, manager’s approvals which are not required to complete the task • Re-writing of data which was already inserted (e.g., from pdf to the system) • Correction of previously performed work. • Software features that no one ever accessing it. • An MRI when an X-ray would be adequate. • Complex purchasing procedures with multiple approval levels. • Reports reviewed by multiple people or multiple signoffs. • Passing customer calls around. • Painting / polishing on unseen/hidden areas. • Doing unnecessary quality check when not required How can we eliminate over processing? Getting to know about customers expectation and converting them to meet the precise specification. We can use, VSM to identify VA, NVA and can essentially reduce the over processing.
 Mohamed Asif Abdul Hameed replied to Vishwadeep Khatri's topic in We ask and you answer! The best answer wins!Starting with the basics, Control limits are the process's voice (what the process does) and Specification limits represent the customer's voice (what we want the process to do). Lower and upper control limits are LCL and UCL, respectively. Lower and upper specification limits are LSL and USL. In general, these limits represent our process variation and help highlight when our process is out of control. x̄ - center line for the data is the sum of all the input data divided by the total number of data points LCL – is 3 process standard deviation below the average and UCL – is typically 3 process standard deviation above the average If the data point falls within ±3SD of its average, it is considered as “EXPECTED” behavior for the process and thus is a common cause variation. Something special happened to those data pointers outside these control limits and can be special cause variation. Let’s consider real-time data from the 2022 Japanese Grand Prix. The qualification session usually determines the starting order and the pole position of the race. To occupy pole position, the fastest driver must ensure that their performance is the quickest, that is, with the lowest lap timing. Below are the lap time/s (actual performance) for the qualifying session. LCL 01:29.304 UCL 01:31.511 Five of the slowest cars are eliminated. Now comes the specification limit, which is set based on the 107% rule. For instance, if the fastest lap time was 100 seconds, each driver who is eliminated in the session must complete at least one lap within 107 seconds to guarantee a race start, which is the USL. Often, only one specification limit is used as in this example. Control limits are applied to summary statistics, whereas specification limits are applied to individual measurements. Control and specification limits are extensively used in control charts and can give us an early warning if a process is showing irregularities, giving us the opportunity to take remedial steps before the situation becomes a problem. Let’s consider another example from the customer contact center: if the average handling time is 4 minutes with a standard deviation of 1 minute, then the control limits are UCL = 7 minutes and LCL = 1 minute, respectively. Specification limits are the targets for the process and defined by the customer or based on the performance of the market. It is desired that those control limits be within the specification limits so that, in case of special causes, the customer will not be impacted. Application of control limits in control chart: The position and scattering of data points plotted on the control chart assist us in identifying process behavior. Process behavior includes that of identifying the stability and understanding the pattern of process variation from a special and common cause viewpoint. Let’s consider one more example based on the below referred Shewhart chart of a manufacturing unit of Prod X. If we could notice that none of the data points are outside the specification limits, and usually the production management team will be OK and glad about this type of run, it is worth noting that if the process were managed statistically, these patterns would assist the line engineer in adjusting and retargeting the process. However, the effectiveness of re-targeting will be determined by the usefulness of the process gain factors. Consider the following scenarios to better understand process performance: Scenario 1: The specification limit is within the control limits. Scenario 2: The specification limit is the same as the control limit. Scenario 3: The specification limits exceed the control limits. In scenario 1, part of the process (natural variation) may function outside of customer-defined targets, leading to rejections and defects. In scenario 2, the process may meet customer specifications, but it can produce defects when there is an uncommon source of variation. In scenario 3, which I would call an optimal scenario, the production is stable, within its capability, produces no defects or rejections, and of course meets the customer specification. To summarize, Control limits are calculated from the process data, so they are the voice of the process, and specification limits are defined by the customer, so they are the voice of the customer. Control limits emphasize location, spread, and width, whereas specification limits focus on meeting the requirements. Control limits are applied to subgroups, and specification limits are applied to items. Control limits help reduce internal rejections in the process, and specification limits help reduce customer rejections. Control limits are displayed in the control chart, and specification limits are displayed in the histogram and probability plots.

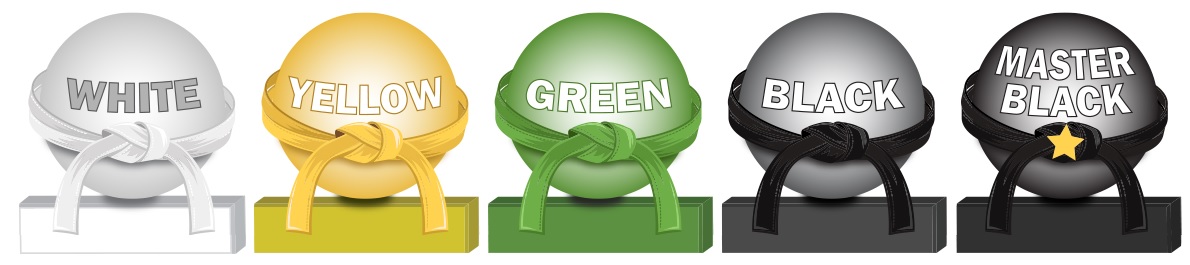
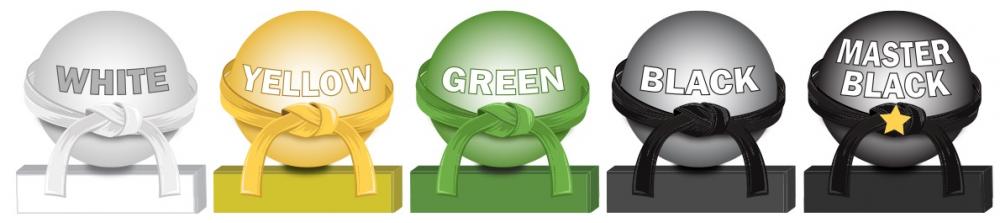
 Mohamed Asif Abdul Hameed replied to Vishwadeep Khatri's topic in We ask and you answer! The best answer wins!Various levels tell us, who can perform what role, and usually when they can be dealt with the projects. Professional skills, expertise and the technical lexicon vary accordingly as the expert levels up. It starts with White Belt, who has the basic understanding of six sigma concepts, more from an awareness perspective and then into Yellow Belt, were the expert participates in the project and supports green belts and black belts in achieving various milestones. Green Belts, extensively assists with data collection and statistical analysis and leads green belt projects and teams. Black belts have advanced lean six sigma expertise and most of the time coaches, mentors, teaches, monitors, and leads projects. Master Black Belts works with leaders to identify gaps and select projects and is responsible for Lean Six Sigma Implementation and cultural change in the organization. White Belt: Has basic understanding of six sigma concepts and methodologies. Yellow Belt: Aware of Six Sigma Principles. Green Belt: Uses analytical tools, DMAIC, LSS and focuses on Lean Principles. Supports black belt projects. Black Belt: Full time project Leader. Trains and coaches green belts Master Black Belt: Advises on Six Sigma and trains black belts and green belts. Acts as six sigma technologies and an internal consultant to the organization.
 Mohamed Asif Abdul Hameed replied to Vishwadeep Khatri's topic in We ask and you answer! The best answer wins!Agile team's one of the commonly used practice is Daily stand-ups, which is short and regularly held to aid team coordination. Impediment can be anything that keeps the team from getting the work done and that which usually slows the velocity. Scrum Master, as a servant leader, helps and enables the team to reach their full potential and capabilities by being an impediment remover. However, everyone on the team shares equal responsibility for identifying impediments and all of those identified need to be flagged in daily scrum. To make effective progress, scrum master should consider and make conscious decision about removing impediments, some examples include that of: Do we essentially have to remove the stated impediment? What is the real problem here? Is it considered as impediment or something which the team can fix themselves? Some common impediments that the team can face are listed below: • Product owner (PO) inaccessibility • Indecisive PO • Internal conflict between team members • Poor health of team member • Unforeseen changes in team structure • Shortage of required skill set • Loads of technical debt • Issues with suppliers • Undesired pressure from top management • Problem with tooling of development team • Lots of trivial meetings that the development team need to attend • Restriction to team setting Best practices and tactics to remove impediments: • Understand the organization • Collaborate with PO • Stop spending time in solving wrong problems • Be transparent – Use Impediment board • Have clarity between blocks and impediments • Use sprint goal • Do not wait for daily stand-up meeting to raise an impediment • Keep track of fixed impediments • Be brave in removing impediments If impediment does not go and reoccur, which means team has not effectively identified the root cause and it is suggested to start with the A3 process to eliminate the barriers. It is important that the team continually identify new impediments which is part of the key concept in scrum continuous improvement and as the team matures ideally the long term goal for the scrum master is to empower the team to remove identified impediments by themselves.
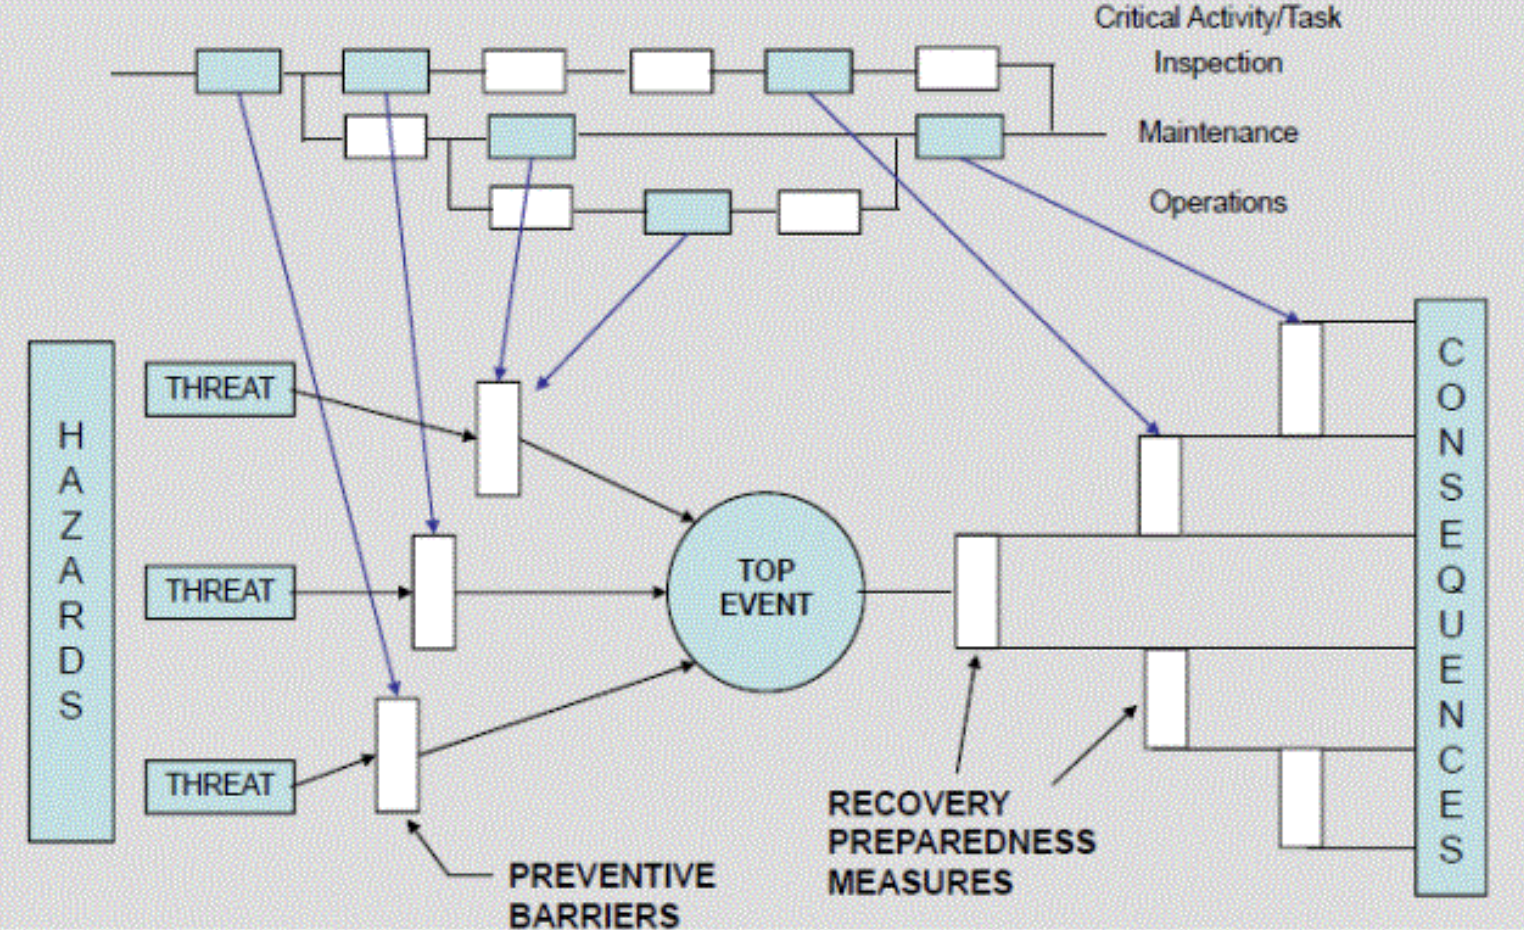
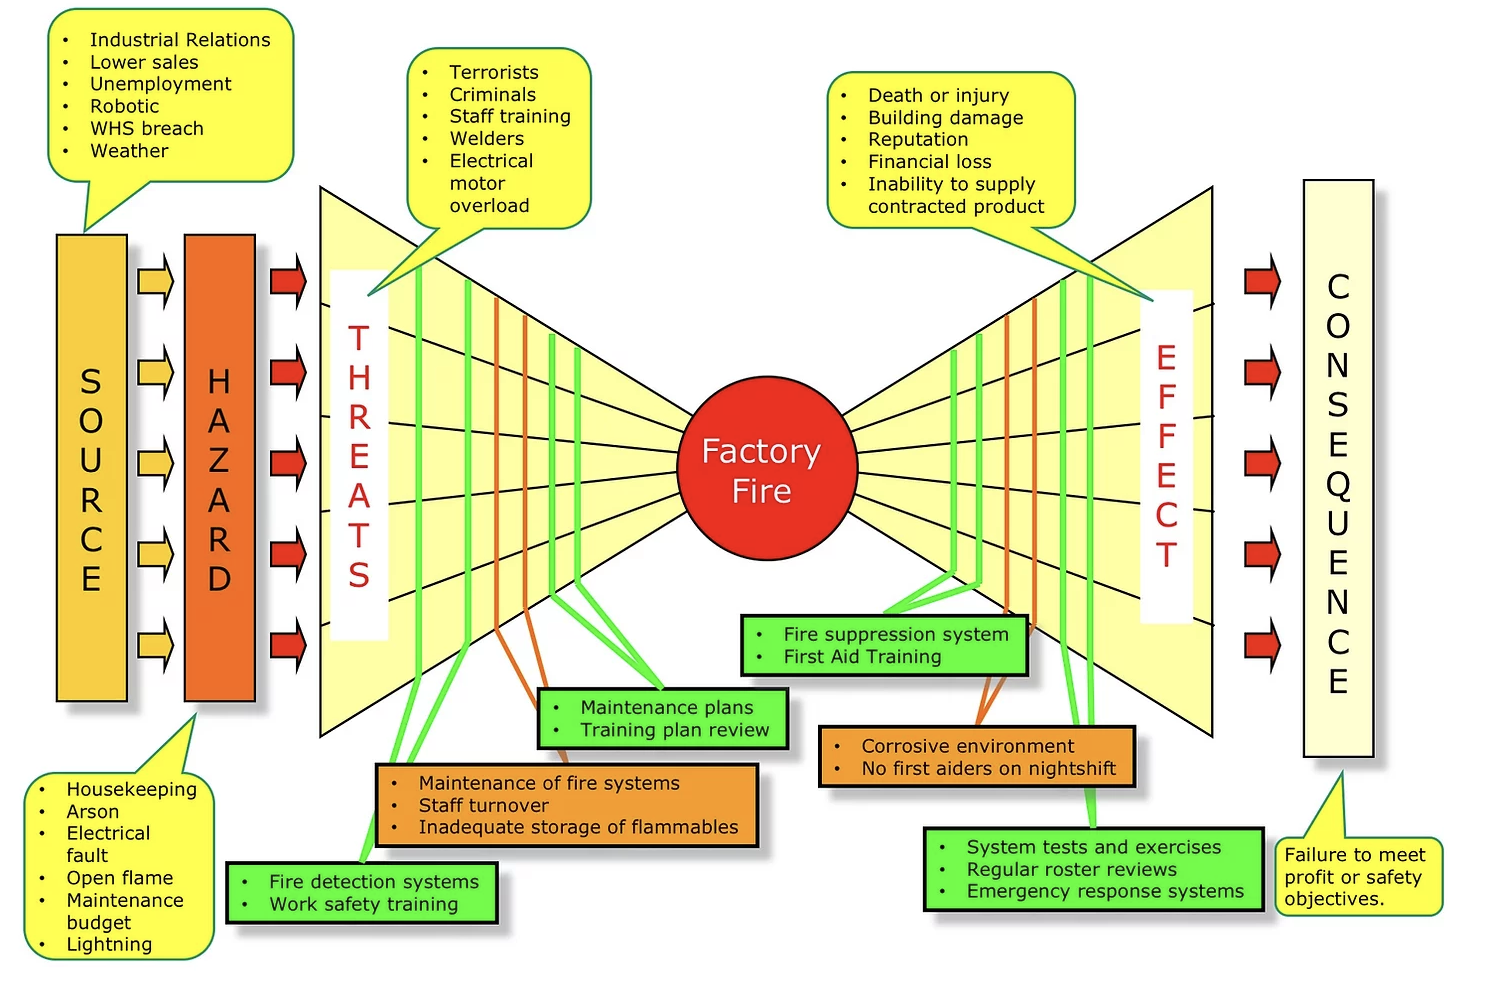
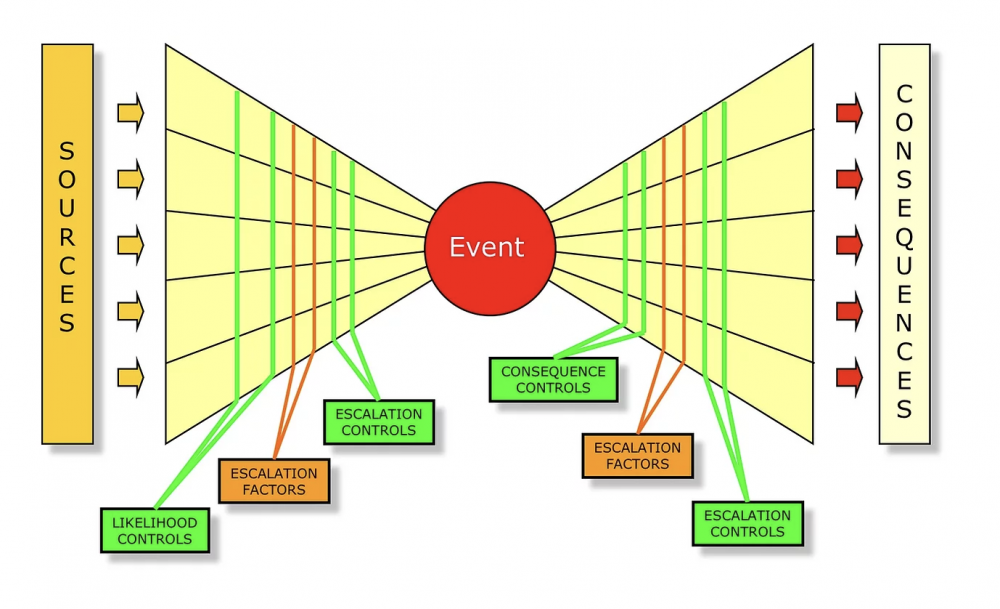
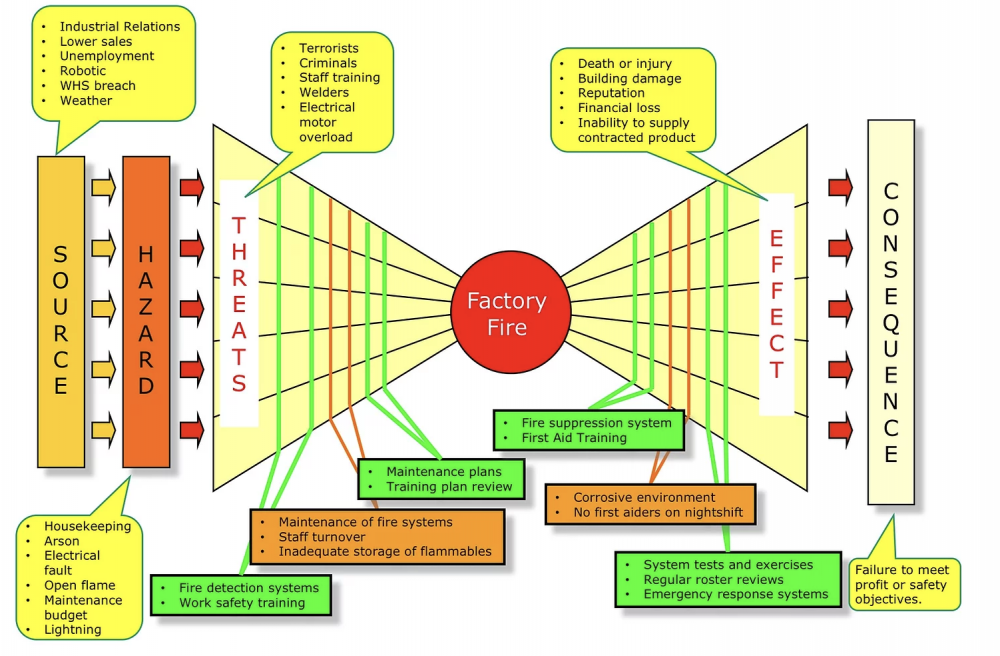
 Mohamed Asif Abdul Hameed replied to Vishwadeep Khatri's topic in We ask and you answer! The best answer wins!Bowtie Analysis is used for risk assessment, risk management and risk communication. By using bowtie diagram we can visualise risk. It shows the causes and consequences of an event. More over the control measures to mitigate the risk is also shown on the diagram. Having potential causes and control barriers on one side and having potential outcomes and defense causes the other side of the hazardous event gives this analysis the shape of "Bow Tie". It simply combines Fault Tree (FT) and Event Tree (ET). Bow-tie Shape reference Bow-tie Modelling Examples: Factory Fire Bow-tie Example Financial Product Bow-tie Example Car Crash Bow-tie Example Bow-tie use cases: Risk Analysis Reliability Engineering Safety Assessment Mining FMEA use Cases: Chemical Aerospace Military Automobile Electrical Mechanical Large scale industries Difference between FMEA and Bowtie: FMEA is Bottom-up and Bowtie can be constructed using both bottom-up and top-down approach FMEA is quantitative whereas Bowtie is qualitative In general, risk analysis helps an organization to identify risks and potential threats to its internal operational processes and provides severity and likelihood of those occurrences. Below is the list of risk analysis methods and techniques. Qualitative: Bowtie Analysis Delphi Technique SWIFT Analysis Fly Analysis Risk Register Probability-Impact Matrix Risk Categorisation Expert Judgement Quantitative: Monte Carlo simulation Decision Tree Analysis Sensitivity Analysis Three-Point Estimation FMEA Scenario Analysis Latin Hyper Cube Simulation Conclusion: Even though there are many risk assessment methods like Bowtie, FTA, FMEA, etc., they focus with single threats and most of the time struggle to represent multiple simultaneous failures. FMEA systematically identifies the effects/consequence of Failure mode and used to remove/reduce the possibilities of failure and Bowtie, predominantly gives hazard insights and its management and helps to represent the influence of safety system on the shop floor accident scenario. Integrating them, both Bowtie and FMEA can be used together for hazard analysis and risk assessment. Detection rating and RPN calculation based on FMEA along with corrective measures to improvement RPN and subsequently using bowtie to identify safety critical barriers and associates actions can improve the effectiveness drastically.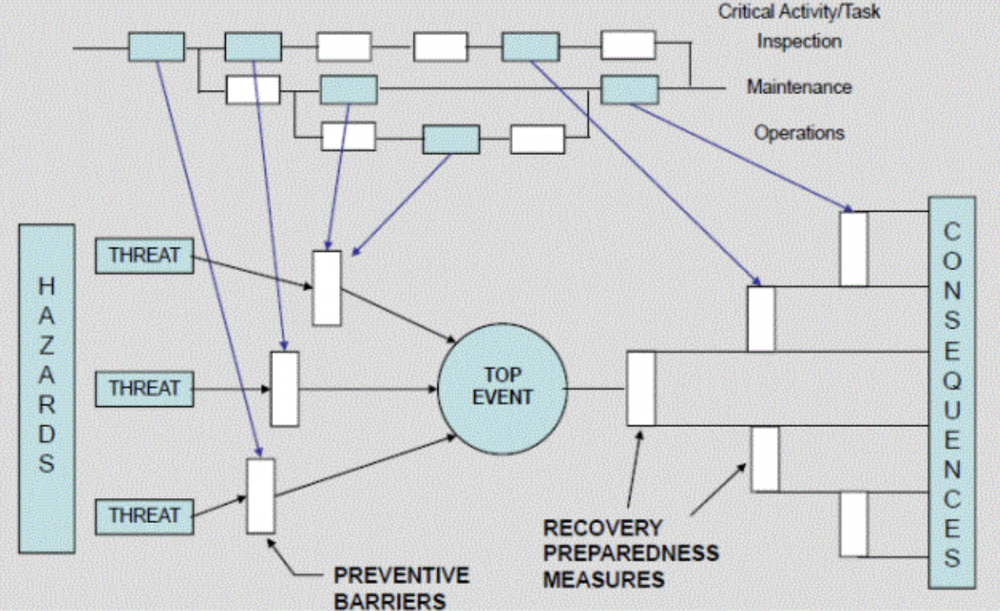

 Mohamed Asif Abdul Hameed replied to Vishwadeep Khatri's topic in We ask and you answer! The best answer wins!Synchronous (dependent) is sequential and happens one at a time, whereas in Asynchronous (independent) concurrent parallel operations are possible. In the below reference, total time taken to complete all 4 tasks in Asynchronous system is just 20 seconds compared to that of 45 seconds in the Synchronous sequential process execution. For instance, zoom meetings happens sequential, which is Synchronous, whereas email communication, online posts can be asynchronous, and be concurrent to keep the target audience engaged for different roles, functions, regions, and programs. As referred in the above example, request stacks in synchronous system, and typically referring from a web service request scenario, clients have to wait on the queue until the previous loop is executed and most of the time, what they see is a timeout response. Asynchronous system allows multi-tasking, has better resource utilization, with fewer wait times and is more adaptable and the leading contribution is the enhanced throughput that we get out of asynchronous systems, on the contrary synchronous system performs function one at a time and follows rigid sequence. Thus, it is advantageous to use the asynchronous system, especially in an agile, multi-request system environment, however, it is wise to use synchronous in reactive systems. So to conclude, It is better and suggested to evaluate and identify the dependencies in the processes to select the best optimal approach that works for the organization.
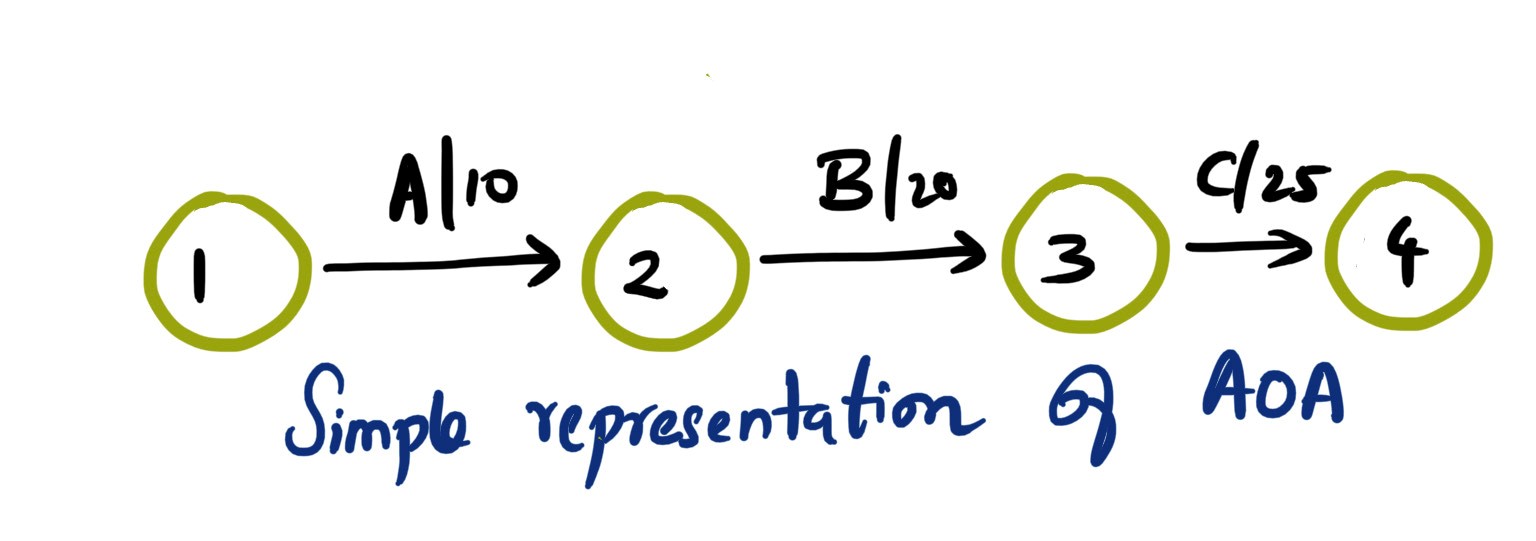
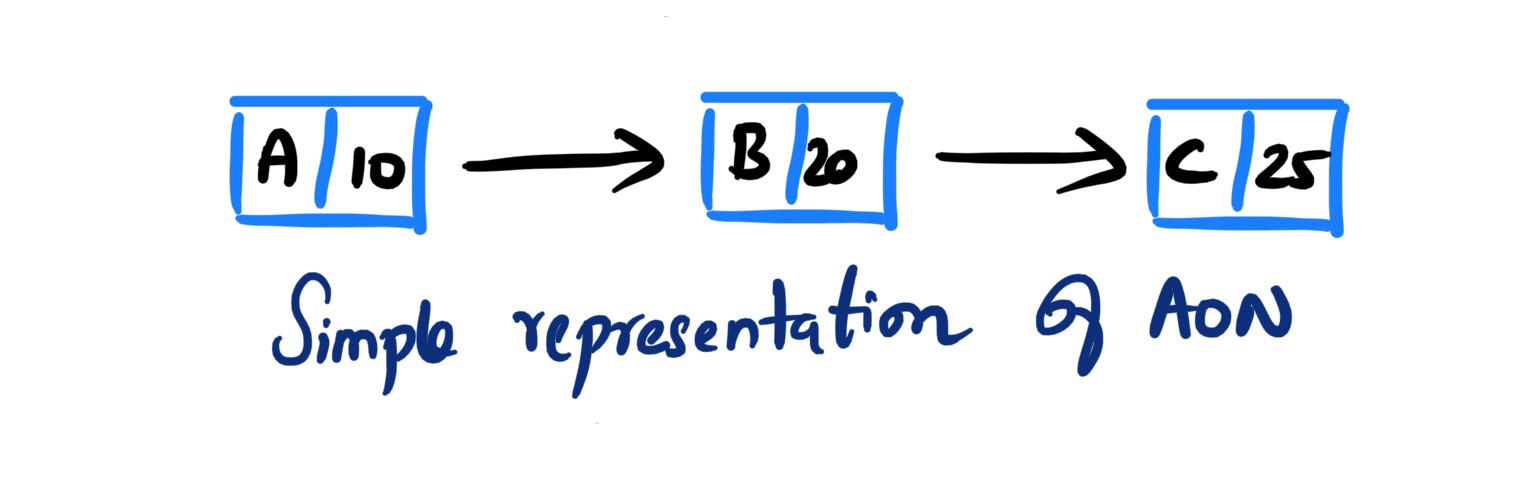
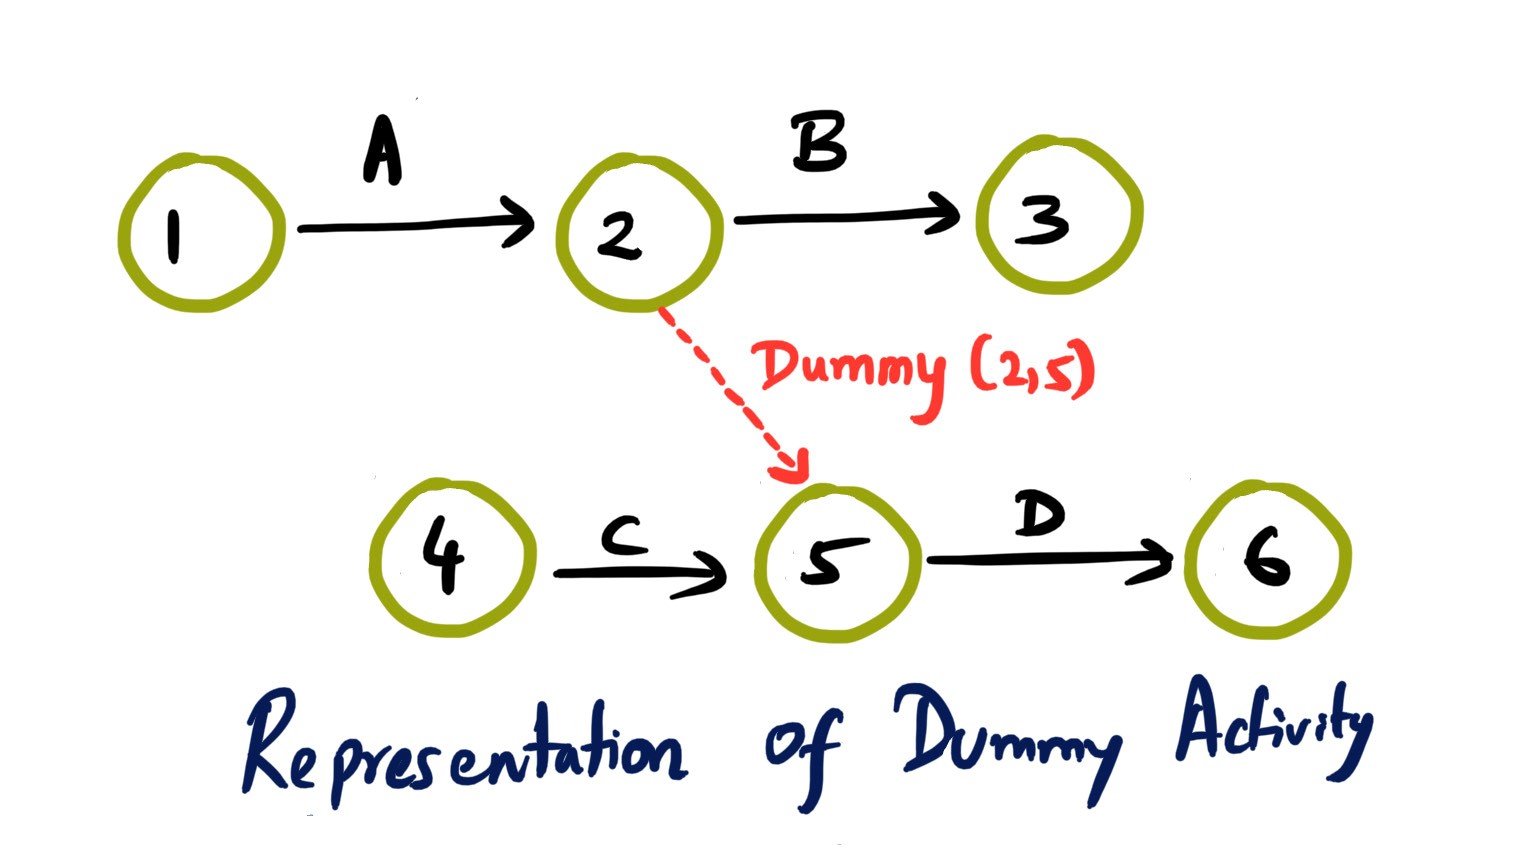
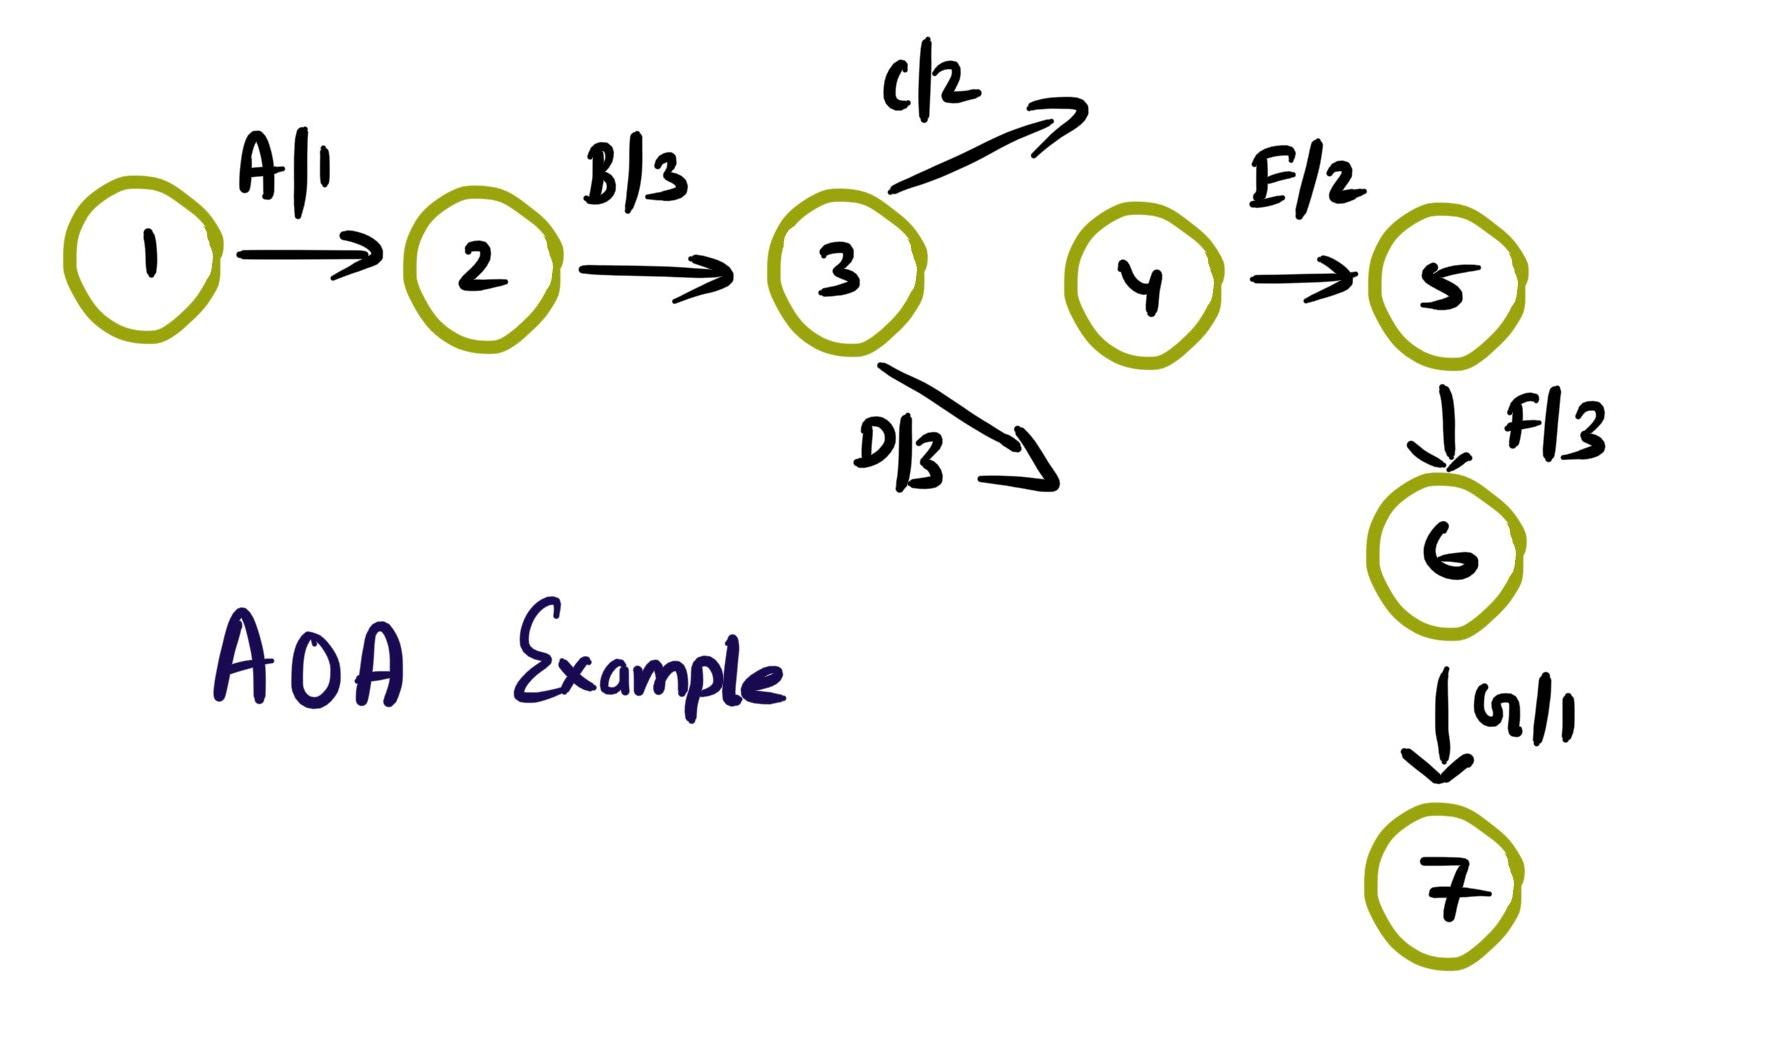
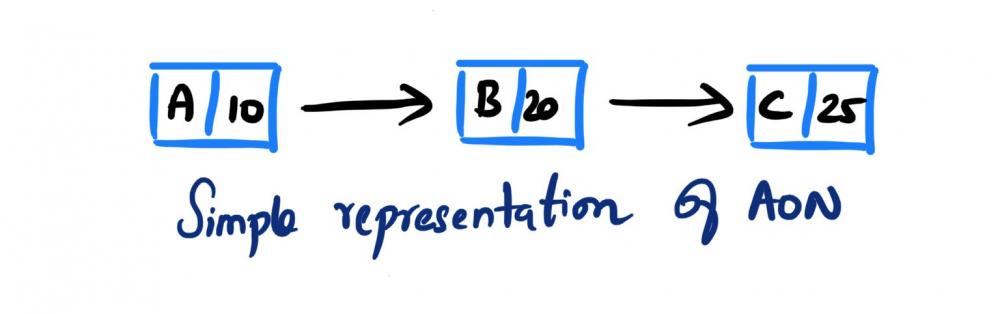
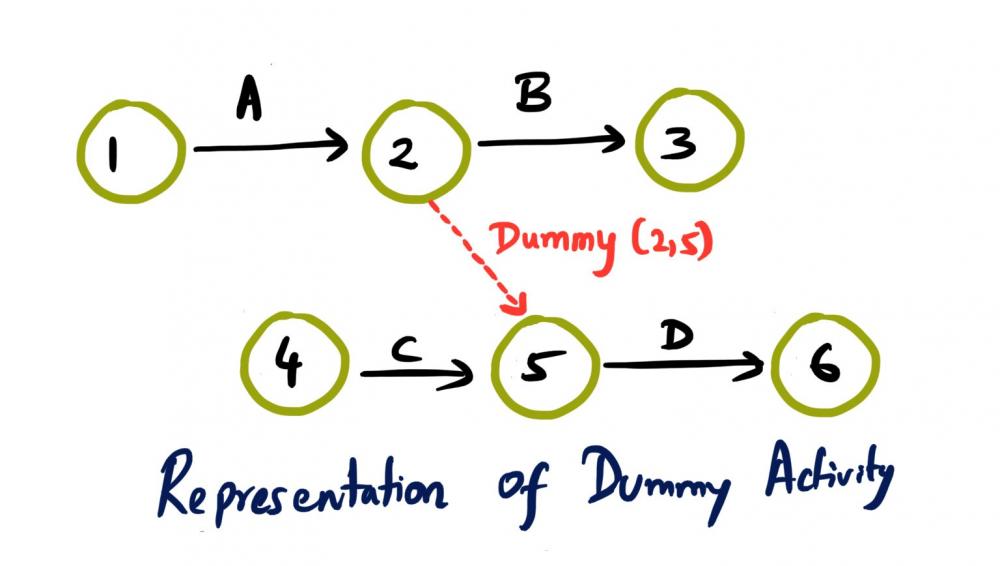
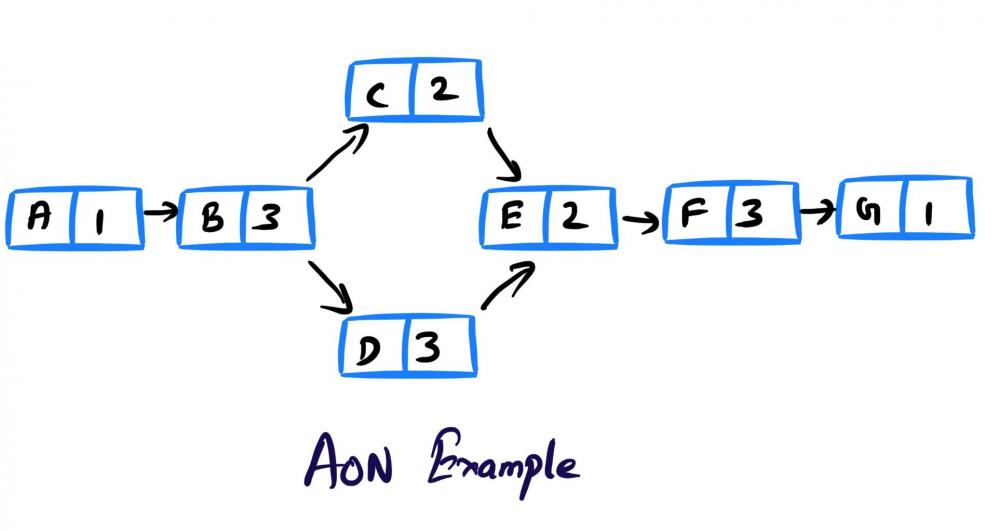
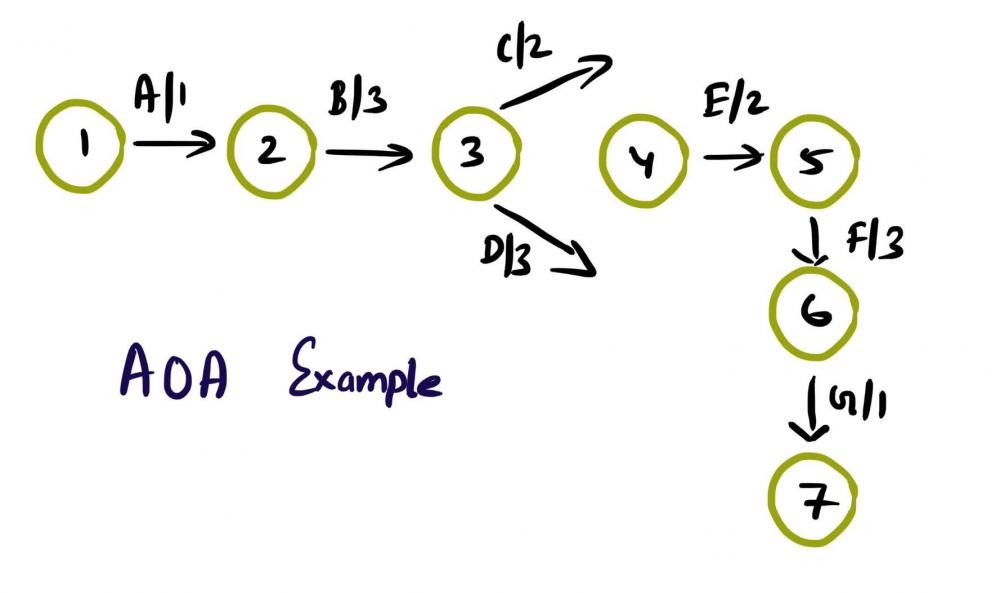
 Mohamed Asif Abdul Hameed replied to Vishwadeep Khatri's topic in We ask and you answer! The best answer wins!Activity on Arrow (AOA), as the name implies, these network diagrams denote each activity as an arrow. Here the nodes denote the start and end of an activity. Activity on Node (AON), this method is also referred as Precedence Diagram Method (PDM), and here the arrow represents the logical relationship amounts the activities and the nodes denote activities. Decision: Even though both methods accomplish same results, practitioners prefer AON over AOA, as it does not require the use of dummy activities. Dummy activity (connecting link) is an imaginary activity, which does not require any time not any resource, still used to identify the dependence among operation. Whilst we can maintain the network Logic and avoid opacity (difficulty in interpretation). In AON, as activities are represented by nodes and its interdependency can be directly denoted by connected arrows, accordingly there is no need of dummy activity. Considerations: AOA, can have several separate possible networks illustrating the same project, contra AON representations are unique AON diagrams are comparatively easier to create and interpret When it comes to amendments, design changes are easier in AON, then doing the same on AOA structure AON focuses on tasks, whilst AOA focuses on events Leaders every so often, get confused with AOA networks and prefer to see more of AON representations Lets consider the below example and design the respective AOA and AON structures. Choose Project, A, 1 Discovery, B, 3 Get Go ahead, C, 2 Data Collection, D, 3 Assemble team and Kickoff, E, 2 Finalize actionable, F, 3 Leadership Summary, G, 1 Although AON is advantageous, it becomes challenging under the below listed situations: Path tracking by activity number is hard When there are multiple dependencies, drawing and interpreting becomes difficult Ruling: Certain Planning and Optimization techniques precisely require AOA network structure, and some might require AON format. It is hard to prefer one, yet opting AOA over AON and conversely, is solely based on specific project requirement. Nevertheless, the advantages of AON become more apparent and takes the upper hand over AOA.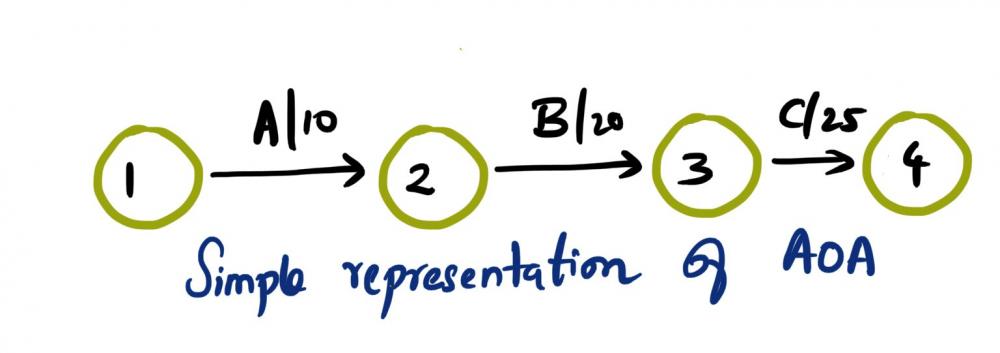
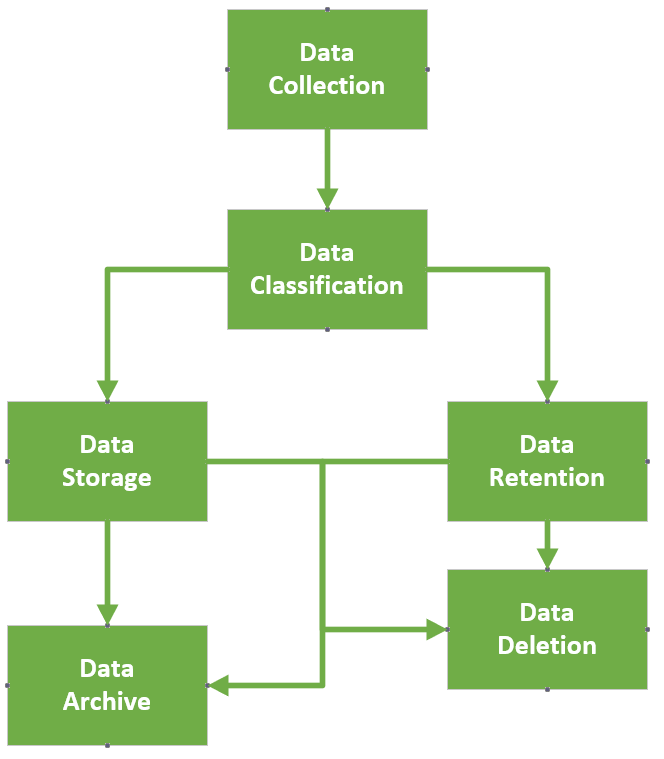
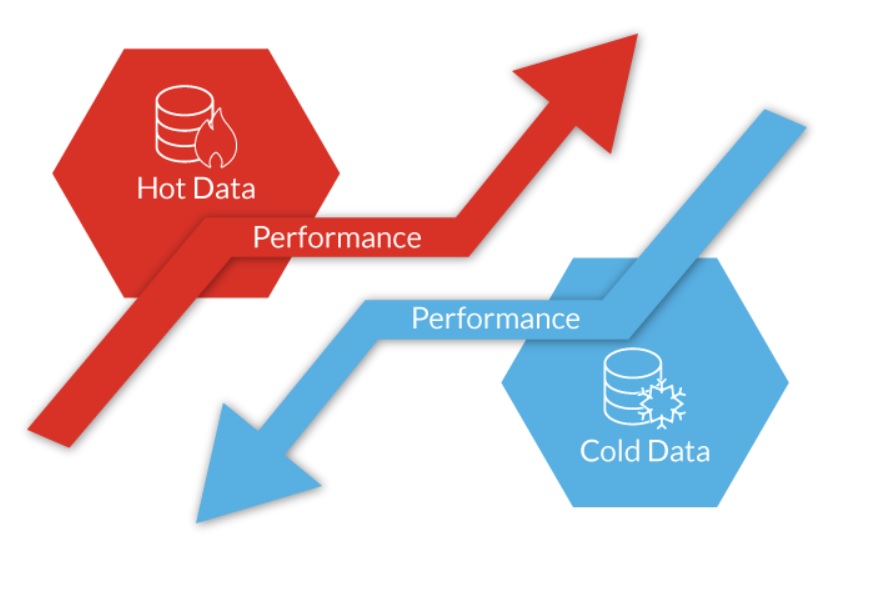
 Mohamed Asif Abdul Hameed replied to Vishwadeep Khatri's topic in We ask and you answer! The best answer wins!“Data is more valuable than Oil”, nevertheless are we leveraging it to the extreme capacity? The answer is simple, it is "No” and it simply becomes dark data! Gartner, coined this term ‘Dark data’ and defines it as “The information assets organizations collect, process, and store during regular business activities, but generally fail to use for their analytics, business relationships and direct monetizing” Dark data can be generated by organization’s systems, devices, and interactions and typically most of the time it is the CRM, ERP, SCADA, HTTP, IoT and even WIFI systems which collects the data. It can be stored physically or on the storage peripherals or in cloud. While most of the data is unstructured, some of the examples of Dark data includes that of below, but not limited to the list, Application logs Customer records Geolocation Survey data Financial statements Customer Address Contact details CCTV footage Emails Chat messages Medical records Zip files Archived web content Code snippets Biggest challenges with regards to dark data is with regards to: Security dangers (hacks) Compliance issues Data authenticity and High Storage cost Brand Reputation Opportunity Cost Risk associated with the dark data can be easily mitigated by adhering to audit and retention policies defined by the organization. However, some best practices can have high impact to manage the risk associated with the dark data. The below model typically shows how the data is collected, stored, retained and deleted, more from an analyze, categorize and classify approach. Model Explained: Starting from Data classification (Public, Internal, Restricted) While we classify, it is vital to bucketize based on few critical factors, viz., Critical data? Permanent document? Proprietary Intellectual Property? Document/data serves the current needs of the operations? Legal and regulatory requirement? (For instance, w.r.t HIPAA, 6 years minimum retention. In contrary, GDPR allow data storage for an extended period, however, solely should be used for the purpose of public interest, statistical analysis and for historical research only) Hot Data or Cold data? (hot data is accessed frequently and used for quick decision whereas cold data is old data and are not frequently used) Based on the classification, then deciding whether to store or delete. If we wanted to store what is the retention period and how it will be useful. When we follow this approach, along with Regular data Audit and internal Data Life Cycle Management (DLCM), we can make the maximum utilization of the data from the data pool. Ways to leverage Dark data: Text Mining / Word mining Data mining methods Voice to Text analytics Data analytics Prescriptive analytics Behavior analysis, which can be used to train AI models for prediction Big data analytics and visualization (SAP HANA) Data Forecasting Trend Analysis Investigate past complaints Google’s approach to data management: “Some data you can delete whenever you like, some data is deleted automatically, and some data we retain for longer periods of time when necessary. When you delete data, we follow a deletion policy to make sure that your data is safely and completely removed from our servers or retained only in anonymized form.” Apple’s approach to data storage: Apple uses personal data to power our services, to process your transactions, to communicate with you, for security and fraud prevention, and to comply with law. We may also use personal data for other purposes with your consent. Final say: Data violations have earned a lot of notice in recent years as businesses become more dependent on digital data, cloud computing, and remote working. As a result, compliance and regulations have emerged as a requirement for ensuring information security. Using data analytic application suites can manage unified unstructured data effectively and can provide intelligent identification of data sets in the organization which can be in line with the industry legal and regulatory requirements.

 Mohamed Asif Abdul Hameed replied to Vishwadeep Khatri's topic in We ask and you answer! The best answer wins!Berkson’s paradox is a special case of collider bias. In simple terms, this bias results from conditioning on a common effect of at least two causes. In more easy terms: This happens when 2 variables appear to be negatively correlated in the sample data yet they are actually positively correlated with regards to the overall population For instance, let’s consider, two ancestors namely, exposure (E) and disease (D) and a common descendent (C). Here conditioning on C leads to a distortion in the association between E and D. That is Berkson's fallacy. In the below example, if we condition on the collider ‘hospitalization’, we can notice a reversal in the association between Smoking and Covid This is very much similar to that of the Berkson's original work in 1946, where he observed a negative correlation between cholecystitis and diabetes in patients, in spite of diabetes being a risk factor for cholecystitis. One of the best methods to prevent the bias is to collect simple random samples from population and that itself will reduce the errors in data gathering. Ensuring to properly define the population and then examine statistically whether the sample is the unbiased representation of the population.