

Venugopal R
Members
-
Joined
-
Last visited
Everything posted by Venugopal R
-
Benchmark Six Sigma Expert View by Venugopal R Apart from the cost, sometimes it is impractical to have high number of samples to take a decision. There have been many situations where dependency on few samples was the only choice to take a decision. I would like to share one such case study, which happens to be one of my lingering experiences in solving a very serious field failure. This happened on an IT hardware product and the failure incidents became a threat for the product acceptance in the market. The severity of the effect of this failure could be classified 8 - 9. The problem occurred in around 2 to 3 percentage of the production volume and it could occur any time between the 1st day or 30th day of the product’s usage. This means that if I dispatched 30,000 units in a month, I could expect more than 750 failures within one month of usage of that batch, which was a disastrous situation considering the severity of the failure. The mandate was to get this problem fully resolved in no time, and say, maximum a week! This being a product reliability related failure with unknown cause, it was not easy to find any screening method to identify and contain the potential defectives in-house. Among the suspected causes were a few components that had undergone certain changes during the recent times. The changes included change of vendor and elimination of some components based on tests and validations. All changes had undergone necessary technical evaluation in house and by third party regulatory authorities before implementation. So, the variables that impact the failure incidence rates were 1. Component (type & presence), 2. No. of hours of operation 3. Volume of production 4. Possible interaction effects (on component combinations) Every component change had been individually evaluated and certified, and hence the technical team was not willing to accept a cause due to any component, from a design point of view. Without knowing the cause, if I had to contain the failure, the only way was to subject all the 30,000 units to a functional test for 30 days and then dispatch only the products that did not exhibit the failure. This was practically impossible. I had to come up with something better that this. This was a situation that demanded quick resolution of the problem that was plaguing the population but had to be resolved by decisions based on smaller samples. After quick deliberations with my teams, we came up with the thought of creating a customized reliability evaluation plan using 100 samples. Why 100? That was the testing facility limitation! The test was to subject the 100 units to an accelerated burn-in test for 24 hours under extreme conditions, that was approximated as equivalent to normal life period of 30 days. The combination of the components (type / presence) was applied using factorial principle. Considering 4 factors and 2 levels, we required 16 trial combinations with a limitation of doing only 6 samples for each combination at a time. To detect a failure occurrence rate of 2%, we had to repeat the entire cycle 8 to 10 times to witness simulation of the failure and to isolate the combinations that gave rise to the failure. Thus, the whole exercise lasted at least 10 days using “small” sample to help us identify and quarantine the cause, convince the stakeholders and successfully resolve the issue. This event was one such situation where there was no alternative than to depend on sample to unearth the cause and decide the appropriate action. It also proved that through thoughtful usage of samples, we can identify right actions successfully and quickly. A very careful and detailed planning, even during such a panicky situation was essential to get the best from 'small' samples. Though those were challenging times, I am glad that I have a case study to share with others who could face similar situations.
-
Benchmark Six Sigma Expert View by Venugopal R So long as we use the term “Control”, it implies that we expect variations from the process, and that we do not have perfect confidence in the process. Come to think about it, do we have any process in our day to day life that we can imagine without any controls? One simple example that often crosses my mind is “Can we ride a bicycle if the handle bar is kept straight and locked?” You may try it out! Every moment we are riding the bicycle the control on balance is provided by the small movement of the handle bar, even if we want to ride straight! We walk straight on a path because, there is a control mechanism through our eyes that keeps directing every step, with some reference. If we think carefully about any process, there are bound to be some built-in controls that make the process work the way it is intended. I am not going to discuss any preferred order about the type of controls since most of the excellence ambassadors will have their experienced views. I am limiting my discussion on some aspects relating to effectiveness of controls. Most of you will agree, controls may be broadly classified as Preventive, Detective and Corrective. Controls may also be classified as ‘Technical’ and ‘Statistical’. What could be factors that adversely impact the effectiveness of these controls? A few of my thoughts are as below: 1. Missing out in the ‘anticipatory list If a failure has not even been anticipated, (maybe it was missed out despite doing FMEA / maybe there was no history of past occurrence), then obviously no control will exist if such a failure occurs. The exhaustiveness of the list of anticipated failures is a factor and there is always the question “How do I know what I don’t know?” 2. Lack of control on the “Preventive Control” Once we term a control as “Preventive”, can we sit back trusting that nothing can go wrong? Every “Preventive control” will have to be assessed for its effectiveness from time to time. For example, a loan disbursement will not be allowed by the system, unless the security clearances are fulfilled. Or an elevator should not start if it is overloaded. Such controls will have to be identified and evaluated from time to time to pro-actively ensure their functioning. 3. Misuse of Preventive / Detection controls This is about having the knowledge of such controls and manipulating them. For example, disabling the Firewall system deliberately to allow certain downloads. Tampering with a smoke detection system (may be to enjoy a smoke!) 4. Not paying heed to the ‘warning’ based controls This could happen either due to lack of awareness and training, or ‘taking for granted’ syndrome, or missing out on the warning. If a ‘low oil’ symbol gets illuminated on your car dashboard, the driver should be educated to understand it and take action. (awareness) If a fire alarm sounds, people tend to take it as a false alarm and not rush out (taking for granted) During a vendor payment, an alert message pops up on the screen to verify if an abnormally high amount appears, but if it escapes the attention of the processor, an over payment might occur (missing out). I am sure that we can think of more factors and examples that influence the effectiveness of process controls. Thus, the pursuit for perfecting a process control system needs to be a continual effort and there would always be a room for improving.
-
Benchmark Six Sigma Expert View by Venugopal R Let me attempt to narrate the unfolding of my understanding of control plan over past 3 decades…. Maybe, my first introduction to the term “control plan” was through ISO 9000 standards released during the late eighties. However, I had worked with an auto ancillary prior to that, where we had a collaboration with a Japanese organization for setting up manufacturing of an auto component, that I believe was for the first time in India. As part of the technology transfer, one of the key documents that we received was a lengthy, multiple folded, handwritten, tabulated document with all the process steps outlined, the quality characteristic for each stage of the process, the specifications, the method for evaluating compliance to the characteristic, and the sampling recommendations. I am not sure whether this document was named as “control plan” at that time, but I always remember this document, during subsequent stages of my career when I formally got introduced to control plan and whenever I associate with control plan. This only proves that this tool, whatever it might have been named in those days, was part of the good Japanese production practices, from very early times. And, more importantly, it found its place among ‘most important’ documents required for a technology transfer. Subsequently, the automotive industry came up with a set of QS9000 standards, along with which emerged the APQP (Advanced Product Quality Planning) standard. The APQP provides a good framework that gives clarity about the creation of Control plan and its linkages and sequence with respect to other methodologies. The APQP goes through five phases after a pre-planning phase 1. Plan & Define 2. Product Design & Development 3. Process Design & Development 4. Product & Process Validation 5. Feedback assessment & corrective action The Product Design & Development section includes DFMEA and Design verification plans. The Process Design & Development phase includes PFMEA and the proto control plan formation begins here. The Process and Product validation phase includes the Evaluation Methods, MSA, setting up Statistical Process Controls, all of which are inputs into the control plan. The Production Control Plan is an output of the APQP at Phase 4. It is evident from this approach that 'control plan' needs to have plan for: Systemic controls (for instance effectiveness of mistake proofing systems needs to be validated from time to time) Process controls (for example, a thermostat-based temperature control needs to be validated periodically) Human based controls Reliability of measurement systems Reaction plans for any non-conformances If we need to have dependable control plans for all the above, the inputs for the control plan has to evolve from the above-mentioned phases of APQP. Some of you may wonder why control plan should be seen only from the context of a Quality System associated with auto industry. It is for the conceptual clarity that may be obtained from the framework of APQP and how the control plan gets derived. The same concept can be adopted for any industry, including Information Technology services. The control plan will remain as a live document that will keep getting updated in line with the levels of knowledge maturity. I conclude by saying that although the concept of control plan has existed even several decades ago, we have many avenues that have brought very refined clarity on the pre-requisites, building and executing a control plan effectively.
-
Benchmark Six Sigma Expert View by Venugopal R A few based on my experiences.... There have been times when I interacted with an organization about identifying Six Sigma projects, and they had some confusion, with the term ‘Projects’. They have been mostly associated with the term ‘Project’ from a context of business contract. Most us who are experienced in Six Sigma terminologies understand how the term ‘project’ needs to be interpreted based on context. However, I have learned that depending upon the audience we may have to be careful in ensuring whether the interpretation of the term ‘project’ is made as intended. Should we call it specifically as ‘Business Project’ and ‘Six Sigma Project’? On the other hand, the fundamental definition for ‘Project’ and the phases of project apply to both contexts quite well. The term project implies an undertaking to deliver an objective with a fixed start and end time. Coming to definition of ‘Process’, the understanding appears to be more uniform and unambiguous. I haven’t seen much confusions between the usage of Project and Process…. Hope the below statement is an example outlining the meaning of ‘Project’ and ‘Process’. “Most of the Six Sigma DMAIC ‘Projects’ aim to improve a ‘Process’ or set of ‘Processes’”. However, when we expect people to map the processes that they are involved in, many have some difficulty. In the Six Sigma world, we often use the SIPOC methodology to depict a high-level process. If we want to test ourselves about our own clarity with respect to a particular process, try building the SIPOC and see how well you are able to do it!
-
Benchmark Six Sigma Expert View by Venugopal R The damage or extent of damage due to a failure may be often saved or reduced if the failure is detected sufficiently early. Very common example is that if the smoke detector gives an alarm, then there is a high possibility that a fire that is about to spread could be attended and put out. It gives certain comfort when we are assured that we have adequate detection ability for certain potential failures. Historical data and experience that a particular type of failure has a very low frequency of occurrence is another information that could influence our comfort levels with respect to a potential failure. We do have better quantifiable methods available today to express the ‘capabilities’ of processes, if we have to. Even if the failure occurs the extent of consequential damage it could cause is yet another factor that decides the extent to which we may breathe easy. We recognize that the above 3 factors have been considered in the FMEA methodology in the form of Detection, Occurrence and Severity. Thus, the worst can happen if a failure capable of causing damage of high severity, occurs frequently and catches us by surprise. Even if any one of these factors are addressed favorably, we can prevent / save damages. With many knowledgeable members in this forum, the FMEA method, which is essentially a cross functional activity would not require any further detailing here. While FMECA is widely defined as an extension of FMEA and the criticality calculation is also defined by MIL1629A way back, it is still possible to raise questions on clarity and uniform understanding of the method. I am not getting into the details of the calculations for the ‘qualitative and quantitative’ methods to evaluate criticality that decides prioritizing the corrective actions for risk mitigation, which most of the forum members would have been exposed to. However, the emphasis on Criticality analysis is to improve the design and system reliability. Whereas the RPN number in FMEA gives a practical approach for prioritization, considering the detection capabilities as well. It is my belief that we would all be in agreement that FMECA is a step up from FMEA that drives us to keep improving design robustness, preventive controls and mistake proofing as much as possible and make it a continuous effort.
-
Benchmark Six Sigma Expert View by Venugopal R While most of the excellence ambassadors will be familiar to the concept of ‘point of Use Inventory’ as used in Lean, and the advantages to control the wastes, I am expressing some thoughts on certain practical challenges one would face when trying to transform an existing workplace to POUS approach. Undergoing the experience of executing a transformation of an existing conventional workplace to a POUS system, will provide relevant learning that will help to set up an operation as POUS right from beginning. One of the common challenges will be the workplace layout – whether the existing layout supports POUS?; or is it possible to modify the layout suitable with little effort? The geographical location of the part suppliers – are they located near of far? For suppliers who are located far or overseas, each consignment would be of a minimum lot size to make the transportation costs practicable. I have seen suppliers setting up exclusive operations near the customer organization as part of long term relationship. The question is… how far one could succeed with such major changes, and in what period of time? Many factors influence the possibility of overcoming the transportation / handling cost related challenges to make POUS a reality for most of the supplies. Another important factor is about the Quality of the supplies. In a POUS system, we will not have much opportunity to evaluate the Quality of incoming material before being used for production. We neither want to compromise on Quality nor want it to be a show stopper for POUS. Hence, assuring “Quality at source” by ensuring clear understanding of requirements and assuring adequate process capabilities become an essential pre-requisite. We would certainly have some more important factors to be addressed to ensure an effective POUS system, apart from the above. Thus the whole implementation may be viewed as a systematic Black Belt DMAIC project, when taken as a transformation initiative, or as a DFSS project when taken as an initial setup. There are clear output and input metrics to be identified, monitored and improved.
-
Benchmark Six Sigma Expert View by Venugopal R In Lean Six Sigma Approach, during the Analyze phase, we have an exercise to come up with Potential causes and similarly during the Improve phase, an exercise to come up with Possible solutions. Subjective methods such as 'Subjective Rating and Ranking, Cause and Effect matrix etc. are used for coming up with the potential causes. Likewise, for identifying possible solutions, Brainstorming and Creative thinking are applied. It is quite possible that during these exercises we would come across many ideas that might be ‘wild guesses’ based on the individual’s historical experiences and intuitions. Many a time such ideas and thoughts will trigger lateral thinking and shape up into ‘out of the box’ thinking. However, the Lean Six Sigma approach has got its own checkpoints to verify and validate both at the cause identification stage and at the solution identification stage to filter out such ideas. The second level of cause/solution identifications are based on statistical methods that will have to show significant response. Thus decisions involving major time, efforts, cost or customer risk, should not be taken just based on the ‘wild guess’ approach, but has to be ratified based on the statistical validations. On the other hand, there are situations where, decisions that were believed to be taken based on strong scientific thought process have been proven wrong once implemented, when proceeded without subjecting to a suitable statistical validations. Thus, I would conclude that ‘guess driven’ ideas may not be avoidable in Lean Six Sigma, however, expensive risks of wrong decisions getting implemented can be largely controlled by subjecting to appropriate validations with sound statistical basis.
-
Benchmark Six Sigma Expert View by Venugopal R Most of us would have understood about the three types of Variability…. viz. Instability, Variation and Off target. A control chart is a tool that helps to represent these variabilities, both statistically and in an easily understandable way. If all the points fall within the limits and the points are in compliance with the rules for all other ‘runs’ as applicable for a control chart, the process is considered stable. If the overall variation, represented by the distance between the UCL and the LCL is such that the variation of the population falls within the specified tolerances, the process is considered capable. Well.. when can we have a capable and stable process be rendered incapable? One such possibility is if we take an unwanted action of altering the settings of the process. But why should this happen? Those of us who are familiar with he “Type-1” error, would understand that there is a small risk of being misled by a control chart, that the process is not stable, when in truly is. Of course, such type-1 errors are small and are expected to occur very rarely, but it is a possibility where one can adversely tamper a process that truly has been capable and stable. However, if we stick to the control chart methodology, we will quickly discover that there has been a shift and would promptly restore it back. Imagine a situation where no control charting is done and the decision to alter the process is taken based on ad-hoc measurements. The chances of disturbing a process away from its stability and capability is certainly high in such situations. Another incident that comes to my mind is where the concept of ‘fits’ and ‘tolerances’ had not been applied effectively for the dimensions of two components that need to be fitted to each other. As per the definition of stability and capability, the processes of both the components complied, but when an extreme match between the components came up there were failures, due to improper fit. Here the assembly has been rendered incapable. Hence, apart from the process capability and stability of individual mating components, the study on fits and tolerances needs to be considered as well.
-
Expert comments column I remember a situation when we had shortage of particular cast component that was essential to complete the final product assembly. The concerned supplier suddenly has an equipment problem and was able to supply only a few numbers per hour. So, we had one officer take a car and travel to the supplier's site, a few hundred kilometers away, 2 to 3 times a day and fetch those small quantities of the casting to keep our assembly line running. This arrangement had to be carried out for a week, by which time the supplier got his machine and process fixed and was able to produce in bulk. The arrangement that we employed during that one week is certainly not an efficient way of transporting the material, but had to be done as a ‘Stop Gap’ arrangement. Thus the ‘Stop Gap’ arrangement is a conscious decision taken for the time-being to keep things going due to a temporary setback, even though it may not be a right or efficient method in the long run. I am now quoting an example of a Six Sigma project that was aiming for a cycle time reduction of an online processing work. While the charter was prepared in the Define phase, and we were about to get the metrics identified for ‘Measure phase’, it came to our notice that there was an automated ‘search’ tool, that had already been developed, but never used due to a snag in implementation. Usage of this tool will help us to achieve a part of our target, say around 25%. The project team was able to co-ordinate with the concerned tool developer and the users of the tool in operations, and get the snag resolved in a couple of day’s focused effort. This not only took us nearer to our targeted objective, but also helped in boosting the confidence of the project team and the sponsors. It also gave due credit to those who had developed the tool, but were unable to show the result. This is considered as a ‘Quick Win’ for the project, though the major improvements were yet to be done. The ‘Quick Win’ in the above example was an action that did not need time consuming efforts like detailed analysis and validations, but was a ‘low hanging fruit’ that could be implemented quickly and helped to attain a benefit, though, may be small.
-
Expert Comments by Venugopal This is an interesting topic, which each one of us would have encountered in one way or the other, many times in our careers, wherever we may be working. The world could not have come forward so much without creativity. Creativity is an inborn trait, with not only humans, but even among other living beings. It is my personal belief that everyone understands how to view creativity and productivity appropriately, but tend to get into debates or arguments depending on the positions they hold at that time. While a set of people, typically the ‘production work force’ focus on routine productivity, another group, typically ‘Production Engineering or Design Engineering’ focus on coming up with creative methods to improve / enhance productivity. Over time, we have seen the emergence of concepts like “Kaizen”, whose objective is to harness the creativity from the minds of the people who are engaged in the day to day production, chasing productivity targets. This is a good example that illustrates that while being productive, and being closest to the workplace, the minds have been active on building up creative ideas. Unless these thoughts are tapped and encouraged we miss good opportunities of enhancing productivity (and other improvements) at the work place. However the improvement through Kaizens have limitations and it is important to have dedicated experts to explore best practices and leverage other technological advancements and ergonomics for breakthrough improvements on productivity. On the whole, it is a combination of the Kaizens (continuous small improvements) and the re-engineering / innovations (continual thoughts that result in periodic breakthrough improvements) that bring the transformation over a period of time. So long as the ‘human’ minds are involved, creativity will co-exist with productivity. Maybe I would take a step forward and mention that even RPA methods keep endeavoring creativity through “Machine Learning” methods, while productivity is in progress.
-
Benchmark Six Sigma Expert View by Venugopal R BHAG is no doubt a vision for a long-term, usually ten-plus years. It is a transformation goal and aims to position the organization for a revolutionary change. The guideline for Black Belt projects is to have a SMART goal and Black Belt projects need to get completed at the maximum within a few month's time. The strategic element of Six Sigma calls for annual goal setting and deployment of goals to identify the need and opportunities to improve, re-design or newly design processes. The famous approaches viz. DMAIC, DMADV and DFSS are popular methodologies that guide the teams towards executing such projects. While deciding the annual goals for an organization, the senior leadership would consider the BHAG vision and ensure that the annual goals are aligned to steer the organization towards BHAG goals. It then translates to more specific objectives that could be chartered as BlackBelt projects. Thus the Black Belt projects would certainly serve as a vehicle to provide substantial traction to steer the organization towards the BHAG, provided the senior leadership makes use of the Six Sigma organization effectively. However, the Black Belt projects alone may not be sufficient to fulfill the aspiration of BHAG. It will certainly need emphasis on strategic fortitude using tools and methodologies applying creativity and and innovation as well.
-
Many of us will be familiar and are likely to have dealt with “Special processes” as defined by ISO 9001. To re-iterate the definition for ‘Special Process’…. They are processes whose outcome cannot be easily measured or evaluated and hence it is very important to ensure the compliance of the process parameters to provide an assurance that the output can be confidently relied upon. The most popular examples provided are Welding, soldering, painting etc. In my experience I have come across some specific examples – for instance the ‘burst strength' for an auto clutch facing will depend upon proper processing and curing of the friction material; this depends upon several process parameters ranging from the appropriate proportion of the pre-mix, the process parameters of the molding and baking process, the extent of force applied for the grinding and finishing operation. Other examples would include ‘Insulation breakdown resistance of wiring harness system’ used for appliances and automobiles. In the IT services industry, many processes are performed directly on the customer’s mainframe with no or very limited opportunity to do any verification or correction. For a banking industry, if the applicable discounts for a product are not withdrawn by the system after the intended period, it causes revenue losses for the bank, which many not be easily recovered. Usage of the right skills and check points is crucial to assure that poor quality does not hit the customer’s processes or the end customer. It is the responsibility of the producer to identify special processes, whether it is pointed out by the customer or not, and exercise and demonstrate appropriate pro-active controls. Coming to the ‘Special Requirements’ as defined by the Aerospace standards, they are bit different from the “Special processes” as defined in the ISO 9001 standards, in the sense that the Special Requirements as per the AS standards are identified by the customer as a product characteristic / performance parameter that have ‘high risk’ of not being met. Factors used in determination of special requirements could include process complexities, past experiences and limitations of industry process capabilities. Identification of special requirements, including the key characteristics and critical items is one of the defined outputs of the phase 2 of the Aerospace APQP. Some examples provided by IAQG guide for 9101 standards include new technology application, new work sharing, introduction of new processes or machines, new competencies requirements. The focus here is on the Product requirements and from the way the standard has defined it, it appears that one of the criteria considered for identifying ‘special requirements’ includes the fact that the product may be produced through a ‘special process'. In the context of this discussion, I would also like to mention about NADCAP (National Aerospace and Contractors Approval Program), which is an industry managed approach to conformity assessment of ‘Special processes’ related to Aerospace industry.
-
Reinventing the wheel can be an arduous task. It is basic common sense that we should try not to duplicate efforts, but build upon wisdom that already prevails. The distinctiveness with the Japanese companies is that they have demonstrated the art of picking up on an invention that already exists and take it to an unimaginable dimension. The transformation of the auto industry by Japanese 1980-90 period has awakened the US auto giants to revise their own standards on Automobiles. Similar is the case with many other products that the world has seen. It would not be out of place to mention the pioneering work by Indian Statistical Institute on Statistical Design of Experiments - many of those approaches have been practically applied on what came out as the very popularly accepted Taguchi methods. Indeed, a legacy has been left by Japanese in the ability to build and excel upon in many areas, be it Product, Process or Practices. Now let us see the Yokoten practice as applied within an organization. Yokoten, as many of you have figured out is commonly referred as lateral sharing of learning across organization. In many or our organizations, we continue to have pockets of good work going on, but with stealth publicity. People who have been in organization for long tenure would have seen the same or similar continuous improvement projects being repeated over time. We often talk about ‘sharing of best practices’, but from a yokoten point of view, shouldn’t we rather say “Building upon best practices”. In order to propagate the yokoten practices better in organizations, we need to consider multiple factors. Let’s discuss one such factor here. Usually when an improvement project is completed, there is a requirement to get the team to come out with ‘opportunities for replication’ and this gets presented and many a time, nothing much emerges out of it. The impression prevails that replication is a relatively simpler process and mostly, even if someone takes up sincerely, it is perceived as a low recognition effort. Instead, “building upon best practices” can be viewed as a creative ability and effort that carries equal importance, or maybe more in some cases. However the credit for the original effort will not diminish at all. Thomas Edison is still remembered as the inventor of the bulb, though in today’s world the bulb, from its original form has undergone significant transformations!
-
Benchmark Six Sigma's MBB Expert Response (not contesting) I have been fortunate to have had rich work experience with organizations imbibing Japanese and Western management styles. I would not want to come to any conclusion as to which is better…. I find positives in both approaches and finally, it is the effective blend of best practices, applied with cognizance that gives the result. Whether we talk Gemba or MBWA, it depends on the manner in which they are practised that would make a difference. Both mean that we need to visit the work place. Both mean that we need to interact with people who are closest to the production and who touch the products. Both mean that we need to focus on continuous improvement. I am not sure what thoughts many of you would get when you hear these terms. But let me express mine. When I hear Gemba, it denotes “Roll up your sleeves and gets down to the workplace”. If it is a manufacturing floor, go near the production area, the machines and the people who are at the work spot under consideration. If we are talking about sales, go to the show room or sales counters where actual handshake with customers is happening and participate in the sales process. If it is a case of IT services, go and sit down in front of the monitor, by the side of the processors who are processing the transactions or doing a testing etc. Getting a ‘hands-on’ feel of the work and empathising with the people engaged in the work to understand the ground reality is what Gemba is all about. Gemba visits may be done any time as required and need not be as per a scheduled time table. The MBWA gives me a feeling of getting an overall view about what goes on in the actual workplaces. They are more structured and planned visits by senior leaders, mostly accompanied by the concerned area supervisors. Here the senior leaders may do an assessment of the processes as per a systematic schedule/checklist or it could be an ad-hoc assessment. Unlike Gemba, MBWA doesn’t give a feel of ‘rolling up sleeves’ and working, but more of ‘higher level’ observations, assessments and understanding. Observations are made on the spot and the issues are heard and seen at the workplaces and questions are asked on the spot to people who are closest to the work spot. Senior leaders visiting the workplace instils seriousness and sense of importance in the minds of the people at the workplace; be it a shop floor, sales and service counter, call centre or IT services. Which is better, Gemba or MBWA? Considering the above discussion and understanding, both need to be practised. There is a need for structured MBWA as well as Gemba visits by senior leaders. Both have common benefits as well as specific benefits.
-
It depends on what position you are aiming for. If you are aiming for a LSS trainer role, it would be important to have a reasonable grasp of the underlying statistical principles, if not the the actual formula. For other roles, where you may have to lead a LSS project, in whatever else may be your area of competency, you can either rely on the statistical software and take the help of an LSS BB or MBB, where you need help. One of the main reasons why these applied subjects did not (and maybe still do not) get enough of buy-in was that many used to get put-off on the stat part. In the earlier days one had to use tables and calculators to do the workings, but now, thanks to the advanced software packages available, we are able to perform that part with ease. So, if we keep harping too much on the theoretical part, we may once again kindle the discouragement. We need to be careful and practical in this approach.
-
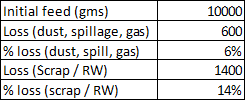
Rolled Throughput Yield (RTY) is calculated by multiplying the yields for each process. Let me illustrate an application of this metric using an example. XYZ company manufactures friction material that goes into auto disc brake pads. The processes under consideration start with the Mix, which is subjected to pre-form process, and then compression molding and then grind finish. Let's assume that the standard weight of mix required for each pad is 100 gms. If 10000 gms of mix is fed into the processes, the yield for each of the 3 processes, Preform, Comp. molding and Finishing are tabulated as below: The yield for each process is calculated in the last column, and the resulting RTY is 0.8, which means that when quantity of mix equivalent for 100 pads was fed into the system, we ended up getting only 80 pads. The loss of yield can be categorized into 2 categories. 1. Due to the losses due to spillage, gaseous waste, finishing dust (SGF) 2. Due to rejections that were either scrapped or reworked. (SRW) The RTY brings out the practical yield from the process at large. If we take a six sigma project to improve the RTY (say from 0.8 to 0.9), it will lead to the revelation and analysis of the 'Hidden Factory' in terms of Scrap and Rework handling that is going on in between the processes. Further probing would lead to a question about how much of SGF wastage can be reduced. It is likely that the factories will have practices by which Reworked material for a particular process will be fed into the next process. Similarly the wastage due to spillage may be retrieved and re-routed to the preform process. The grind dust may be collected and recycled at permitted proportions into the molding process. Assume around 2% of the SGF and 8% of the SRW are re-introduced into the process, the resulting yield (if we didn't consider RTY), would have worked out as 90%, and we would have missed out on exposing and quantifying the "Hidden Factory" and the opportunity for improvement

-
Decision based on test Reality Ho is True Ho is False Accept Ho Correct Decision (1 – alpha) Confidence Level Type II error (Beta) Reject Ho Type I error (alpha) Correct Decision (1 – Beta) Power of the Test If we want the test to pick up a significant effect, it means that whenever H1 is true, it should accept that there is significant effect. In other words, it means that whenever H0 is false, it should accept that there is significant effect. Again, in other words, it means that whenever H0 is false, it should reject H0. This is represented by (1-Beta). As seen from the above table, this is defined as the power of the test. Thus, if we want to increase the assurance that the test will pick up significant effect, it is the power of the test that needs to be increased. Hypothesis testing.
-
Range, no doubt is the simplest measure for dispersion. Range, however can mislead us when there are outlier in the sample, since only 2 extreme values are used for calculating range. We need not go into the advantages of using standard deviation, since most of us would know it. However, in situations where we deal with small and equal sample sizes, the range will be a very ideal measure. One of the best examples that we have is the usage of range in an Xbar - R chart. Here, the samples are taken in the form of rational sub-groups. Each sub-group consists of a small, say around 4 nos,, but equal sample size. Such sample sizes will be too small for computing standard deviations. The concept of rational sub-grouping and very less time gap between the samples, reduces the possibility of outliers. However, even if we have outliers, those range values will stand out in the control chart and they will be removed during the 'homogenization' exercise. Hence range as a measure of variation can be used for such cases.
-
One of the most important thing that one would like to infer from a descriptive statistics output for any data is how much does the data distribution comply or deviate from a normal distribution. Skewness and Kurtosis are measures that quantify such deviation, often referred to as measures for 'shape' related parameters. These measures will be particularly useful while comparing 2 distributions, and decide on the extent of normality - For eg. the delivery time for a product when compared between two delivery outlets. Data may be distributed either spread out more on left or on the right or uniformly spread. For a normal distribution, the data will be spread uniformly about a central point, and not skewed. When the data is scattered uniformly at the central point, it called as Normal Distribution. Here median, mode and mean are at the same point and the skewness is zero. When skewness is negative, it means that the data is left skewed. If it is positive, then the data is said to be right skewed, as illustrated below. While the graphical representation provides a very quick and easily understandable comparison of the skewness or bias on the data distribution, the skewness measure helps in quantifying the same. This will be particularly important for decision making while comparing distributions which appear similar, but have smaller differences in skew that may not show up well on the graph. In economics, the skewness measure is often used to study income distributions that are skewed to the right or to the left. Data distributions based on life times of certain products, like a bulb or other electrical devices, are right skewed. The smallest lifetime may be zero, whereas the long lasting products will provide the positive skewness. Kurtosis is often referred to as a measure of the 'pointedness' of the peak of the distribution. It is also referred as measure of the 'weight of the tails' of distibution. However, I will attempt to make the understanding of Kurtosis better in as simple terms as possible. It is known that while Normal distributions are symmetrical in nature, not all symmetrical distributions are Normal. A perfect normal distribution will have a Kurtosis represented as β2–3 = 0. A positive kurtosis, known as Leptokurtic will have β2–3 > 0; a negative kurtosis, known as Platykurtic will have β2–3 < 0. To illustrate with an example, most of us are familiar with 't' distribution, which will may appear seemingly similar to Normal distribution, but it will be differentiated by a β2–3 that will be greater than zero. Though Kurtosis is mostly referred to with respect to the "peaked-ness" and "tail heaviness", it is really dependent on the extent of mass that moves to or from the 'center' of the distribution as compared with a normal distribution with same mean and variance. One of the main uses of Kurtosis is to use it as underlying factor for testing Normality, since many of the statistical techniques depend on the normality of distribution.
-
I wouldn't want to go back to the points that have already been covered by various Excellence Ambassadors for the previous question relating to the limitations of FMEA. Here i will limit my discussion to the limitations in the usage of RPN. 1. The most known aspect while using RPN number is that even if we may rank the priorities based on descending order of the RPN, the severity has to be given very serious attention. Lets examine the below 2 scenarios: Severity 10 refers to Hazardous effect without warning Severity 4 refers to low effect such as fit / finish issues that may not impact functionality or safety. Occurrence 3 refers to low frequency such as 1 in 10000 Occurrence 7 refers to high frequency such as 1 in 100 Detection 3 refers to controls having good chance of detection Detection 8 refers to controls having poor chance of detection In the above case, prioritizing scenario 2 over 1, just based on RPN number may be disastrous. 2. Often, it would be difficult to obtain the reasonably correct rating numbers for occurrence. Especially when we are dealing with new product / processes, relevance of arriving at occurrence ratings based on existing processes may have limitations. Another risk would be that the occurrence frequencies would have been based on the data for a particular period, but in reality the occurrence frequency for a particular cause could change and alter our risk prediction and priority. 3. Where detections have a human dependency there is a possibility that when the occurrence for a particular cause becomes very low, there would be chance for reduced human alertness and actual detection could be lower, though a low score might have been assigned to it.

-
Avoid branding program with “Lean Six Sigma” tag at start. Understand biggest Leadership pains. Always, bound to have requirements for improving effectiveness / efficiencies of processes. Take such pain area (or improvement area), and initiate through regular procedures in organization viz. Change request, or CAPA processes, which normally flow through relevant cross functional stakeholders. No SME should feel as an added activity. Once succeeded let leadership feel a fact-based success story encouraging them to give you the next one. Step-up usage of LSS tools / practices as required and pursue to result in a seamless buy-in of the program.
-
Working with sample means When we work with sample means, the data from any distribution, even discrete are subjected to the properties of normal distribution, as governed by the central limit theorem. The application of this concept enables the usage of normal distribution laws for tools such as control charts. Ordinal data Many a time when we use ordinal data on a likert scale with ratings 1 to 5. When we average such recordings for a particular parameter from various respondents, it will get converted into a metric that can be seen on a continuous scale. Histogram Every time we plot a histogram even for data of discrete nature, (for example no. of corrections in a document per day), with large amount of data, it tends to exhibit the behavior of continuous data, say normal distribution. FMEA ratings When we use the ratings in FMEA for severity, occurrence and detection, we assign discrete rankings between 1 and 10, but once converted to RPN, it becomes more continual in nature, though it may remain a whole number. Failure data / distributions Another situation I can think of is about failure data. Individual failure data are count of occurrences, obviously discrete to start with. However, when we convert it to failure rate and plot distributions against time, they are treated as continuous distributions such as exponential, Weibull etc.
-
My previous post discussed about situation1 for non correlation between Intenal Q score and VOC score. Let's look at another situation Situation2 Lack of correlation as the internal Q score shows poorer results than the VOC score. Before we conclude whether the internal score serves any purpose or not, below are some of the questions that need to be asked: 1. Is the VOC score structured and being reported as per an agreed procedure? 2. is there a possibility that despite having a dip in Quality, the VOC is silent on certain issues, but there is a risk of silent drift by the customer? 3. Has a detailed analysis been done on the key findings by the internal measurement, and an assessment done on the relevance of the findings from the customer point of view? 4. If sampling procedures are used, are the MOE (Margin of Errors) comparable for the methods employed internal and external? 5. Is it possible that there may be certain reliability related issues, that probably might show up on VOC score only after a period of time? 6. Some times it is a common practice to keep the internal measurements more stringent than what the customer would do, for higher sensitivity. This could affect the correlation. 7. The internal measurement might possibly take into account issues that impact customer as well as issues that may not impact the customer, but important from an internal process efficiency point of view. After considering the above discussed couple of situations of non - correlation, even if there is a positive correlation, there may be certain questions that may be worth looking into. Depending on the interest of the debating participants, I will dwell into that area. Thanks..
-
Let's consider specific cases of non correlation between Internal Quality score and VOC score. Siituation 1 if the VOC score is showing poorer Quality than the internal score, it is certainly cause for concern. It serves a purpose to examine some of the below questions.. 1. Is the the detection capability of Internal measurement adequate? 2. Could it be a result of a damage that has occurred subsequent to the internal measurement? 3. Is there a difference in the understanding / interpretation of the Quality standard? 4. Has a new problem cropped up that was never been part of the existing Quality standard? 5. If some sampling methodology is being used for the score determination, are the margin of errors for internal and VOC comparable? 6. Is it a subjective / aesthetic preference related issue, which could vary from customer to customer? 7. Is it some assignable spike due to a specific problem concentrated on few products in a particular batch? We will discuss another non-correlating situation in my next post.
-
Looking at some of the responses, I would like to reiterate the question of this debate. The question is not about whether correlation is required or desirable. The question is "Given a situation where the internal service quality score fails to show a positive correlation with the VOC score, does it serve the purpose or not?" Or to express the question in other words "If the Internal Quality score does not positively correlate with the VOC score, is it to be discarded as not serving any purpose?" My answer has been "It need not be discarded for all such situations" In other words, "Yes, it would still be serving the purpose, depending upon the situation"
