

Venugopal R
Members
-
Joined
-
Last visited
Everything posted by Venugopal R
-
Benchmark Six Sigma Expert View by Venugopal R While Pareto chart depicts a set of factors in the descending order of their frequencies of occurrences, Paynther chart divides each bar of the Pareto into further sub-groups. The sub-groups thus split-up should be comparable across the bars of the Pareto. Paynther charts are popularly known for combining run charts along with a Pareto for tracking the trend of each sub-group item across a period of time. However, we may find the Paynther chart useful to depict comparisons of sub-groups other than time as well. For instance if we have a Pareto for the number of units of a product sold across various metros, we may construct a Paynther chart by sub-grouping each bar for the product-types. The Paynther chart represents the split-up details of each bar of the Pareto in the same order. From the charts above, it may be seen from the Pareto chart that overall sales for Metro4 is lower than Metro1, but the sale of Product B is more in Metro4 compared to Metro1. Similarly, other inferences may be derived. It helps to prepare the overall Pareto chart first and then create the Paynther chart for the chosen subgroups. The Paynther chart helps to drill down to next level of detail from a Pareto chart and would be very useful for root cause analysis. Other examples where we can apply the combination of Pareto and Paynther charts would be: 1. Defect types across months 2. Productivity of set of services across multiple sites 3. Purchase volumes of a product across by different age groups The Paynther chart may also be adapted to track the impact of actions on specific issues – for example, to track the improvement of specific product failures based on corrective actions implemented. For this, Paynther chart will be constructed with the sub groups following a chronological sequence.


-
Benchmark Six Sigma Expert View by Venugopal R VUCA is an acronym coined by American military for addressing certain extreme war time situations. The fast-paced world has led to corporate leaders finding VUCA applicable to many corporate situations. I would like to share my thoughts and experiences as below. Example1 One of the common VUCA situation in the corporate world is during mergers and acquisitions. Volatility can be expected with several changes happening simultaneously. viz. New senior leadership formation, Organization reshuffle, New Clients, Products & Services, New geographies, New Processes and Operating platforms and so on. Uncertainty will prevail among employees, shareholders and other stakeholders. Long term customers and suppliers could get perturbed and could be left wondering about whether they would be impacted by the change. Complexity may arise out of need for integrating different workflows, processes and platforms. Synergizing operations, sites, technologies and functions would also present complexities. Ambiguity crops up due to possibilities of multiple interpretations of same messages, policies and procedures and reporting structures. Another area of ambiguity that is likely to hover for some time could be the name of the combined organization. Example2 Another situation that comes to my mind is during the time when the city was affected by severe floods. We saw volatility in the form of our normal life getting disrupted overnight and the damages spurting up in various forms. Our office sites became inaccessible, all communications were disrupted, all modes of power failed, employees got stranded, some critical equipment got submerged and so on. We were uncertain about how long it would take to get back to normalcy. We did not know how much worth of damages have happened and what more may happened. We did not know about the safety of employees and had no ways of communication. We did not know how much our customers would have got impacted due to delivery issues and how they would look upon us. What were the complexities that we confronted? Our BCP / DRM strategies swung into action. We had to divert our work to other sites that were not affected and to sites overseas. This resulted in employing of different resources to handle new work, with their limited familiarity and training. Damage to critical equipment that was part of the back up process resulted in data not being accessible to provide support to the remote locations. Since the entire city was impacted, rescue and draining equipment were of high demand and not easily available. Many employees had emergencies at their home as well and balancing of priorities between saving home and office was challenging. Arranging logistics to safely move employees, who were available to workable locations from their homes and providing them food proved complex in such a disastrous situation. Ambiguity prevailed with multiple inputs and information coming in about the status of the conditions of or sites and homes of employees. It was difficult to get to agreement on priorities with the limited resources available. Providing any sort of commitment to clients about returning to normalcy was very difficult with inconsistent and ambiguous inputs. Example3 Moving to another scenario, we had once faced a situation when there was a mass exodus of employees from a particular division, most of them being lured by a competitor in the city who suddenly setup an operation for the same services. Volatility was seen as the speed at which we were losing employees. With more people leaving and rumors spreading, it became contagious and in a very short time, more than 80% of the employees in that division had disappeared. Uncertainty was further fueled by the volatility, with rumors spreading about possible closure of division and many employees were in a dilemma whether to continue or to quit. The management was uncertain about how much of loss that would be caused and whether we would be able to retain the customers. Complexities included inducting employees from other divisions and to frantically look for hiring new employees, getting them trained and exposed to the client requirements and processes without disrupting deliveries and accuracy levels. Ambiguous inputs were received in terms of the number of employees being lost and what may be potentially lost. The cause for getting led into such a situation was being presented and interpreted by various people in different ways, whether it is the company, the competition or the customer who is responsible for causing the exodus. Dealing with VUCA Coming to discuss about the Business Excellence practices that could help during VUCA situations, we may look at each of the 4 components of VUCA. However some of the practices would help across VUCA. One of the essential practices is to have a good Business Continuity Plan and Disaster Recovery Management plans. This will be useful for unexpected situations that may emerge due to natural and other causes. Volatility coupled with uncertainty can result in ‘Not knowing the unknown’ and hence a risky situation. Anticipate potential failures and get prepared for worst situation. PFMEA might help us to assess each potential risk and classify their priorities and help building our preparedness. Proactive Multiskilling and multi-tasking of resources would help in situations where we have heavy fluctuations in product sales or on employee turnover. Complexities can arise out of interconnection between processes and activities and interdependence of multiple decision factors. Entity relationship diagrams will help to define and depict relationships between multiple entities. We may use SIPOC for high level depiction of a process in a complex situation and if we are able to obtain sufficient data, we may use multiple regression models. Ambiguities arise because we have a room for multiple interpretations of the same data coupled with insufficient data. One of the approaches in statistical decisioning is by attaching a confidence level for any inference. Thus even though we are unable to decide something with 100% certainty, we are able to take a practically applicable interpretation by attaching a quantified risk. The risk levels could decrease with improved quantum of inputs and over time.
-
Benchmark Six Sigma Expert View by Venugopal R The term ‘Regress’ means ‘to return to a former or less developed state’. Regression testing is the terminology used in software testing to test whether there is any change in the software functionalities that used to be performing well, before introducing a change. Those of us who have been associated with software quality directly or indirectly are likely to have experienced loss or deterioration of existing functions of a software after being subjected to some change, be it a bug fix or an up-gradation. Looking back, similar situation prevails in manufacturing and other products as well. I had once got the AC condenser replaced in my car after which the AC was functioning perfectly. However, after a day, I realized that some of my dashboard indicators, that used to work properly, had stopped working. Most of you would have faced similar issues. Though the term ‘Regression testing’ is associated with software testing the need for similar testing has been prevalent in all fields. As LSS professionals, we are often torn between choosing between “Effectiveness and Speed”. How do we know whether any of previous functionalities would be adversely impacted by a change in a software? How do we decide what functionality could have got impacted and how much variability needs to be considered for evaluation? Since we do not know the ‘unknown’, the blind decision could be to test everything i.e. Retest all. While this could be very expensive and time consuming, it still may not guarantee that it will identify any regression issues that may exist. For instance, not all test cases that were prepared earlier may be re-usable. Some would have become ‘obsolete’. Moreover, it could be possible that those test cases had been developed without considering any interactive impact of the new change. Hence even if we can afford to go for a ‘Retest all’, it may not provide us the required protection. SW developing organizations and divisions strive to find those potential components and areas that are most vulnerable for being impacted by the change and ensure effective evaluation of those relevant functionalities – coupled with contingency plans. Based on my experiences, I share a few thoughts below and look forward to see many more from other professionals. Test automation Test automation is a very fundamental approach that may be adopted. This is useful especially when we re-run same test cases involving multiple scenarios. There are numerous tools available, depending upon the need.. like Selenium, Ranorex, QTP, to name a few. Keep client in the loop Where the SW product is for a client organization, and the change is requested by the customer, it is a common practice to keep the customers involved during the development and UAT planning and execution for the change. Many clients with long term tie-up, insist that for all changes, even when not initiated by client, they need to be kept involved throughout the change process. It may so happen that certain tests would pass in the developer’s environment but may fail within the customer’s environment. Keep ‘Roll Back’ options Despite best attention, in the event of any unexpected regression issue that crops up only after going live, the developer should have ensured to have the option to 'switch back' to the previous version until the issue is fixed. However, this may not be practically possible for all cases – for instance, if the change is linked with a change that is done at the client side as well. Prioritising Test Cases Selecting the test cases and having the confidence of not missing out on an important one is a very tricky decision and should not be done without cross functional involvement. A good understanding of test cases that detect frequent defects, functionalities that have high user visibility and sensitivity, test cases related to core functionalities, Integration test cases are important inputs for the deciding the priorities. FMEA will be a useful tool to structure, document and prioritize the profusion of knowledge and experience. Test Driven Development It is a legacy approach to subject previous set of test cases as part of ‘regression testing’. However as discussed earlier, it may not be adequately effective always. Parallel efforts to develop appropriate tests along with the code development for the change would help in identifying relevant test cases. Integrate regression testing with exploratory testing used in Agile development. Mitigation options other than tests Having in the development approach, keeping in mind that changes could be expected. With more focus on ‘Agile’ development, customers want to keep the options for change requests very open. System architecture may focus on building more smaller, independent components. This will make the effect of changes more isolated than the case of common coding and hence the test cases could be focused and limited. Version and Change controls Well defined and complied version and change controls will help to ensure that the access to changes in codes are well controlled, authorized and undergo required levels of approvals… thus preventing the possibilities of impairing unwanted sections inadvertently or due to ignorance. The success of optimizing the efforts and resources for Regression testing is achieved with a combination of Cross Functional Involvement, Software Quality Management Systems, and Proactive developmental prudence.
-
Benchmark Six Sigma Expert View by Venugopal R Genchi Gembutsu translates into “Go and See”. It is a term that has emerged from the Toyota Production System. Japanese leaders like Taiichi Ohno insisted that engineers need to visit Gemba and observe to see how value is created and how waste gets generated. The context in these situations was a manufacturing shop floor, or an actual usage of and expectations from a product by the end customer. In many of the emerged businesses like software development, IT services and e-commerce, we may not have a comparable ‘shop-floor’ atmosphere. However, we have customers, customer expectations, customer usage related experiences, competitive offerings etc. Similarly, we have design teams, operations teams, customer relations teams etc. Any software being developed is meant to interface with a process of human to serve some purpose. Many times, we see that there is a ‘requirement’ document that is created by the user (could be a internal or external) based on which the development commences. The developed software product seldom comes right the first time and will require more iterations of rework until it meets the user’s requirements. Applying the principle underlying ‘Genchi Gembustsu’ is very important to reduce such wastage of effort and resources. For example, imagine a software development exercise for creating a web interface for potential customers who want to approach a bank for any product. The developer would have to feel the requirements by Becoming a potential customer himself / herself Obtain first hand inputs from a representative sample of potential customers Study the similar facilities provided by competitors in the market Visit the recipients of these inputs (could be the sales team or contact center) and understand the how best the inputs should be received by them for further actions. Possible areas for ambiguous interpretations and to improve the user-friendliness Adaptability of the portal with multiple applications and mobile devices. Ability to reach through popular social medias. Areas where flexibility of coding is important, considering possibilities of ongoing modifications and up gradations. The above are just examples to illustrate the possibilities. With adequate involvement of right teams and brainstorming, one could arrive at the points as most appropriate for the situation. Taking example of an e-commerce platform, the most obvious Gembas will be the ‘end-user’ and all the locations where the customer requests and inputs are made use of.. viz. the teams involved in processing of order, logistics, payment and delivery. As discussed in above examples, customized list of check points has to be evolved. Direct knowledge and feel of the inbound and outbound users will also help in developing appropriate ‘test cases’ for effective and efficient UATs.
-
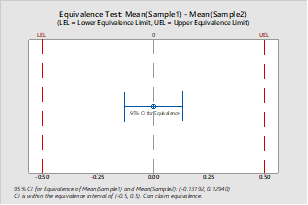
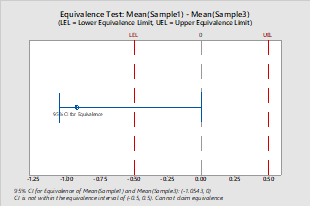
Benchmark Six Sigma Expert View by Venugopal R One of the important prerequisites to answer this question is to have a good grasp about the concepts, methods and interpretation of tests of hypotheses. My discussion below is based on the assumption that the readers are reasonably conversant with TOH. Hypothesis testing is a popular and well known method among Lean Six Sigma practitioners. The fundamental rule that is applied for hypothesis testing is that a null hypothesis, or a 'hypothesis of no difference’ is compared against an alternate hypothesis to examine whether sufficient evidence exists to reject the null hypothesis. For instance, if we want to compare whether the mean value between two sets of data, for example, the weights of sachets of medicinal solution packed by two different methods. In this case: HO: Mean weights of sachets by method 1 = Mean weights of sachets by method 2 HA: Mean weights of sachets by method 1 ≠ Mean weights of sachets by method 2 If we run a two sample test, depending on the p value, we would either reject HO or ‘fail’ to reject HO. While inferring the TOH results, the important point to note is that even when we fail to reject HO, it does not necessarily mean that HO is true. It is just that we do not have sufficient evidence to prove that HO can be rejected and does not conclude equivalence. Equivalence tests allow us to conclude equivalence within a confidence interval. For an example like the one above, for equivalence tests, we need to specify the extent of difference between the group averages that is considered important. Ideal difference is zero; so we have to specify the interval that spans on either side of zero. Then, the differences that fall within the range are considered insignificant and equivalence may be concluded. The largest difference that is permissible by the specified interval is known as ‘Equivalence Interval’. The Hypothesis statements for the equivalence test will be: HO: The difference of mean between groups is outside the equivalence interval HA: The difference of mean between groups is inside the equivalence interval Please see typical graphical illustrations that are obtained while performing equivalence test using Minitab – for situations where equivalence can be claimed and cannot be claimed Equivalence tests are known as “Opposite of hypothesis testing” because of the fact that conventional hypothesis tests look for evidence to prove differences or ‘non-equivalence’, where as Equivalence tests look for evidence to prove ‘Equivalence’. When our aim is to look for equivalence between groups or with respect to a standard, the ‘Equivalence tests are more advantageous.
-
Benchmark Six Sigma Expert View by Venugopal R Any sampling method that is used to evolve conclusions for a population is bound to have errors. However, it is not practical to assess entire populations in many situations and one has to rely on sampling methods. Hence it is important to understand about the errors that could arise while using a sample and we take decisions based on the knowledge about sampling errors. Biased & Unbiased sampling errors Biased sampling errors occur when a sample is drawn from a large base, and there is a likelihood that certain types of members are not included in the population, or disproportionately included. For instance, in a bank, in order to understand reasons for delayed payments for of loan installments, we take a sample of defaulters who are employed with various companies. This could be a biased sampling since we are getting the causes only from ‘salaried’ people. Defaulters who are not salaried (say businessmen) may have different causes. Biased errors can happen when the measuring instrument used for measuring the sample has a bias. For example, if samples are weighed using a weighting machine with bias, we get biased errors. Despite taking necessary precautions to minimize bias, sampling can still have errors due to chance variation and they are unbiased sampling errors. As we know for variable data, by the principle of central limit theorem, the variance of samples will be equal to variance of the population divided by n. In general, if we keep increasing the sample size, the sample characteristics will tend towards the population characteristics and hence lower the errors. Sampling Techniques There are various methods within sampling that may be chosen for a given situation to limit the errors due to sampling bias. Given below are a few of them. Use discretion while using ‘Non-Probability samples’, which do not make use of a ‘frame’. Such samples are likely to be subjected to unknown bias and are advisable to be used only for rough estimates. For Probability samples, decide the best ‘frame’ for sampling, such that the units within the frame best represent the population. Simple random sampling The random sampling method has a frame with every item numbered from 1 to N, where N is the population size. Random numbers are used to select n samples. Statistically, random samples do not have bias on mean value. The sampling error can be evaluated and kept within limits by controlling the sample size. Stratified sampling If we can divide the population into portions based on some common characteristic within each portion, then a ‘Stratified sample’ can be used. Here the frame is divided into portions or strata and simple random sampling applied for each stratum. The results may be combined finally. Stratified sampling will help to reduce the sample size and hence the costs, compared to simple random sampling without compromising the bias. For example, if we need to pick samples of products produced at different sites, assuming that within each site the samples exhibit homogeneity of characteristics, we may use the stratified sampling technique. Systematic sampling Another method is the ‘systematic sampling’. Here the population inside the frame is divided into number of groups depending upon the sample size and a sample is picked at equal intervals. Such method could be useful while taking samples from a running production or for a customer feedback in a supermarket and other such situations. However, if there is some sequential pattern involved in the characteristic, this method will induce bias. Factors to determine sample size One more useful information - While doing comparative tests like tests of hypothesis, a lower sample will play safe will tend to keep the H0 as true. In some of the statistical softwares, you can provide inputs on the delta that you consider important, apart from the confidence level and power of the test to determine the minimum sample size.
-
Benchmark Six Sigma Expert View by Venugopal R We have come across many leaders commenting that ‘Six Sigma’ is not successful. It is likely to be unsuccessful if ‘Six Sigma’ is considered only as a set of improvement projects. Six Sigma is no different from any other TQM program, but has its own unique rigor by its uniquely defined approaches. If those approaches are not adopted holistically, we may not be able to harness the power of the program. One such inbuilt approach is the “Toll Gate Review”. Before even coming to the question of the quality of Toll Gate reviews, it has to be ascertained whether Toll Gate reviews are being conducted at all! Earlier in this forum there was a question on the objectives of Toll Gate reviews; - when it should be carried out, who should be the necessary participants and who should be the ‘if needed’ participants. I believe that you would have refreshed yourselves with the answers to those questions, so that we can take the topic further on. Now assuming that we have taken care of the schedules and presence of right participants for the Toll Gate reviews we will discuss about the administration of the review. 1. Have a clear agenda specific to the review. Do not go just with a generic agenda. Each review should have specific purposes. The co-ordinator of the Tollgate review will have to prepare the agenda in advance in collaboration with the key participants of the review, especially the project leaders. There would be points that need leadership clarification, support, guidance or approval. The agenda has to be circulated in advance – at least a day before the review. 2. Selective continuity from previous reviews Actions that emerged during previous review should have progressed or been completed as per their schedules. However if certain actions need further discussion in the forum, they must be selectively included in the agenda by the discretion of the review co-ordinator. 3. Pre-planned presentation structure The review co-ordinator should begin by providing a snapshot of the overall status of the project and touch upon selected highlights. This will be followed by the presentation of individual project leaders. Usage of a standard presentation template is recommended – however the leaders may supplement with customized slides as required to express their points effectively. The time slots for each presenter including the discussion time should be pre-planned. If the time is overshooting due to prolonged discussions, the co-ordinator should intervene and plan offline continuation of such discussions with the concerned stakeholders, so that the time slots of other presenters are not compromised. 4. Appreciation for progress and good work It is important to acknowledge and appreciate the actions completed on time and any other good initiatives. It is recommended to commence the review with such a positive vibration and then move on to rest of the agenda. 5. Keep the project charters for ready reference anytime Sometimes, while discussing a project, ideas keep coming to the mind and it could so happen that the senior members may voluntarily or involuntarily keep adding to the scope or altering the objective. The review co-ordinator should step-in and support the leader, by referring to the approved charter if a major deviation from the original objective or scope is being pressed upon. Only when the situation really warrants, should any change be done on the objective / scope – and then it should be assessed how realistic the project schedule remains or needs to be revised as well. 6. Direct the questions to respective project leaders or stakeholders We often see that the co-ordinator keeps answering most of the questions and also the questions are directed to the co-ordinator. It is important that the questions are directed to the respective leaders or stakeholders who are process owners or closely related to the area of the questions, and they need to answer. The co-ordinator can certainly facilitate the discussion, but should maintain his / her limits. 7. Sponsor support plays a major role One of the problems that we come across is the inadequate involvement of the sponsors (or champions) of the projects. Very often the project leader is grilled with questions which sometimes may not be answerable within his/ her level of authority in the organization. A quick review and sync up on the points between the sponsor and the leader, before coming for the Toll Gate review will help. Yet worse would be a situation where we see the Sponsor questioning the leader during a Toll Gate review. It is also important that the leader should not put the sponsor in an embarrassing situation by letting him / her being caught off guard. 8. Do not allow the review to drift It is quite possible that since the Toll gate review provides a forum with most of the senior leaders together, the discussion could stray off from its intended agenda to other topics. The co-ordinator should be empowered to steer the discussion to be restored back on track. 9. Minute the meeting actions and discussions – follow up As far as possible get the points / actions discussed be captured as minutes of meeting and read it out to the participants before dissolving the meeting. What happens outside between the Toll gate review meetings also plays a major role for the success of the meetings. Following up on actions, identifying challenges or hurdles, ensuring any agreed offline discussions happen are some of the important tasks for the review co-ordinator between the review meetings.
-
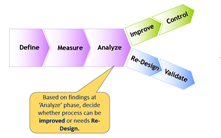
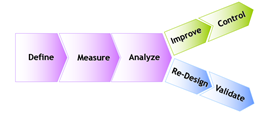
Benchmark Six Sigma Expert View by Venugopal R We all would have learned about DMAIC and DMADV during our Six Sigma courses and many of us have used these approaches in our projects. Hence there may not be a need for any introductory explanation for these acronyms. However, I wish to provide my view point based on my experiences through handling projects under various circumstances. DMAIC (Define, Measure, Analyse, Improve, Control) is more commonly seen as the methodology used in most Six Sigma Projects. The usage of DMADV (Define, Measure, Analyse, Design, Validate) is usually seen less often. In general, it has been explained that DMAIC is used for ‘Improving’ a process and DMADV is used when a process needs to be designed. Projects are taken up to address some pain points or to improvement opportunities. Do we know every time we take up a project, whether a process has to be improved or designed? If no process exists, then of course, we will have to design a process; however if there is an existing process, we may have to either improve it or re-design it. Some times only after completing the Analyse phase, we would be able to take a decision whether it is worth improving the existing process or it needs to be re-designed. In the above situation the DMA phases are common and our decision to improve or (re)Design the process is taken only after doing some analysis. For example, we have a problem relating to Supplier Quality and we find that parts supplied by certified suppliers are defective. We go through the Define and Measure phase and collect sufficient and relevant data. Once we analyse the data, and if we find our problem to be confined to very few suppliers or most of the issues are relating to one or two parameters of the process, then we may decide that the existing supplier selection and certification process is by-and-large successful, but needs improvement only on a few areas and parameters. On the other hand, if after our Analyse phase we are convinced that majority of the suppliers certified through the process have issues or we see issues across many parameters, then we may conclude that it may not be worthwhile fixing the existing process, but rather go for re-designing the process. In such a case, if we may want to trace back on our DMA phases and to re-define our objective and goals. If we are using DMA as part of DMADV, some of the tools would be same as we would have used in DMAIC, but the intent may be different. For example, Process FMEA may be a common tool. For DMAIC we might use it for specific steps of the process that are identified for improvement, whereas in DMADV, we would use it for the entire process. There would be some tools that may be more applicable in DMADV, such as Customer surveys and QFD. It may also be noted that mostly, when we are clear about our need to design a process, we may straight away go for DFSS (Design For Six Sigma). IDOV (Identify, Design, Optimize, Verify) is one of the popular approaches for DFSS.
-
Benchmark Six Sigma Expert View by Venugopal R Among the factors that hinder the progress and success of a project, the inadequate involvement of stakeholders is quite common. The reasons for not involving stakeholders are many. Sometimes enough efforts aren’t taken to identify the stakeholders. Some times the team takes a ‘cautious’ approach and keeps postponing the involvement of certain stakeholders, saying that it is better to involve them after showing some success on the project. Sometimes the team fears that certain stakeholders, if involved in the beginning could put too many questions and retard the project. However, with the experience with many projects, successful or otherwise, it is seen that the risk of not involving the right stakeholders is much higher than any perceived risk by involving them. The very first step is to identify the stakeholders relevant to the project. 1. Involve key leaders during project identification There are some stakeholders who will be part of even identifying the project. Identifying potential stakeholders across functions, who could be leaders of key functions and involving them to rate and prioritize the list of projects is a good beginning to build ownership. A tool such as Pareto Priority Index would help bring objectivity. 2. Project Chartering Once project is identified, certain stake holders associated with the project will be obvious while preparing the project charter itself. For instance, a project that has to improve a business process will identify the concerned process owner(s). The requirement of Subject Matter Experts, who need not be full time members of the project would emerge. While estimating the financial worthiness of the project, it will be important to involve appropriate staff from Finance function. 3. SIPOC While preparing the high level SIPOC, it is possible to identify stakeholders who may be suppliers or customers to certain process steps or could be even enablers. For example, a project involving a process improvement in Data aggregation services that may call for mass testing will require high bandwidth management. Hence the early involvement of IT support function may be essential to avoid an otherwise potential hurdle in due course. 4. Stake holder Impact All stake holders would not be equally impacted by the project. It is very important to understand the stakeholders on whom the impact is high and winning their confidence would help in obtaining their support on the project. On the other hand, there will be stakeholders on whom the impact is low, but their support, expertise or authority are required during certain stages of the project. The leader has to keep in mind that these stake holders are always kept in the loop with necessary involvement. Preparing a table laying out the extent of stakeholder impact will be useful tool for their involvement planning 5. Stakeholder Involvement planning While, not involving a stakeholder adequately can cause issues while the project progresses, over involvement of a stakeholder is also not desirable. Over involvement could result in grabbing too much of the stakeholder’s time and later lead to withdrawal tendencies. Sometimes it could result in too much influence of a stakeholder into the project. Hence it helps to plan in advance, to identify which stakeholder(s) should be involved at various process steps and also the degree of involvement – could be low, medium of high. A process map with extended columns to include the stakeholder’s involvement and degree of involvement will not only help in planning but also will remain as a reference document during the course of the project. This may be referred as Stakeholders Involvement plan 6. Stakeholder communication plan At each stage of the project plan the communication to stake holders – what should be communicated, at what point of time, extent of communication. Any good communication matrix will be helpful. There could be certain projects that involves customer value-add. In such projects including the customer as stakeholder for the project and necessary planning for involvement and communication apply. Interestingly I remember leading a customer value-add project where one of our competitors was a stakeholder! 7. During Project involvement of stake holders Though the above discussion covers some practices the early involvement of stakeholders in a project, we will also touch up on the selective involvement in further areas: a) For Identifying root causes b) For identifying / selection of final solutions and actions c) Obtaining stakeholder buy-in on solutions d) Sharing of results with stakeholders e) Appreciating and thanking stakeholders
-
Benchmark Six Sigma Expert View by Venugopal R The is no organization that does not want improvement, right? While all organizations do want improvements, the world has been evolving and inventing various management methodologies for bringing improvements to business. Some of the popular examples are PDCA, 8D, and DMAIC. The logical sequence of all these methods are comparable. So long as you follow the underlying expectations of each phase using any of these methods in the right sequence, it will work. The question being discussed can be interpreted in two ways – “Why are some Leadership not supporting DMAIC ?” or “Why are some Leadership not supporting any of these systematic approaches ?” The answer to first version could be due to specific reasons. For instance, an organization that has been very sincerely following the Japanese methods of management would have very well imbibed a continuous improvement culture in their organization and may not feel the necessity to have a branded Six Sigma program (under which DMAIC resides). However, if we carefully examine their approach, it probably satisfies the expectations of DMAIC. This is indeed a positive situation, where DMAIC is not followed literally, but is followed in spirit. The second version is where the Leadership does not seem to have any resistance particularly towards DMAIC, but have problems in supporting any such systematic sequence of approaching a business problem / opportunity. We will discuss it keeping DMAIC as reference. As many of you will be aware, improvement opportunities are classified into 4 categories viz. 1) Cause known, Solution known 2) Cause known, Solution unknown 3) Cause unknown, Solution known 4) Both cause and solution unknown Point 1 and 2 may not require a full DMAIC cycle. However, even for points 3 and 4, sometimes, experienced leaders might feel that they know the cause and solution and tend to by-pass the full DMAIC cycle and force the company directly into the Improve phase –' just implement a solution that is considered right'. Later, if the understanding of the leaders proves wrong, then you will be forced to go back and try alternate solutions. To do a ‘Define’ phase properly, there could be a need to gather data. The problem statement which is part of the Define phase, requires not only a description of the problem, but also some quantification, that too for a certain period of time. Where historical data is not readily available, efforts need to be put in to collect sufficient information to express the problem statement with numbers for magnitude, duration and Impact. Sometimes, there will be a resistance to get this done, supported by a feel as if ‘we know it all, so why not move ahead without wasting time and effort on defining known problem ?’ Another point that is often not completed in Define phase is the projection of Financial benefits, since this would require involving a Finance personnel and getting their sign off. Measure phase requires efforts for not just building the baseline data, but also to initiate a ‘Dashboard’ for the project metrics. This dashboard needs to be updated continually till end of project and beyond. Another associated activity is the Measurements Systems Analysis, the importance of which may not be understood by some. Complying to MSA requirements, especially for attribute metrics requires good amount of discipline and management support. By the time a project reaches the ‘Measure phase’ it is not uncommon to see some improvements on the ‘Y’ metrics. This happens due to the awareness generated by the project definition and the data by the dashboards. However, such improvements may be considered as ‘Quick wins’ and may not sustain unless a complete analysis is done on the influencing factors and ensuring the right control measures. The improvements at this stage sometimes sets complacency and the momentum to proceed with DMAIC may get reduced. For a project that moves to Analyse phase, one of the activities that is often resisted is the need to validate the causes. The tendency to ‘assume’ the causes some times deprives some of the primary causes to be evaluated using recommended tools. This results in by-passing DMAIC. Reasons could be due to the time and cost involved in carrying out certain validations. Sometimes it may also happen that while one team is trying to systematically approach using the DMAIC method, a parallel team may work on the same problem and may hastily come up with recommended solutions, which could tempt the Leadership to support them, especially if there is an urgency to implement a solution. For various reasons, if the DMAIC cycle prolongs too long, there is likelihood of losing interest in the method and tendency to proceed and ‘try out’ some solutions. The DMAIC approach, like many others is meant to be driven by a team with a qualified leader. However, sometimes, the responsibility of driving it will rest on an individual, with inadequate team support. This can also result in break-down of the approach. As per the original philosophy of Six Sigma, DMAIC is the tactical part of a larger governance program, which also has a Strategic and Cultural component. But many organizations no longer drive the Lean Six Sigma program with a holistic view. Even the series of in-house program that will impart awareness to all levels of employees, including an exclusive 'Champions Program' are not availed by many organizations. Instead they tend to directly hire qualified Blackbelts and Greenbelts. This would have eroded the awareness levels across organization and limited to a few individuals. This subject seems to require long discussion and there would be more points to discuss. However, I am limiting my response here and sitting back to read the view points from others.
-
Benchmark Six Sigma Expert View by Venugopal R Most large organizations in the B2C sector perform customer satisfaction surveys. Various methods are employed, be it CSAT surveys or the recently popularized NPS. One of the issues about such surveys is that the possibility of variation in the measurement is very high. Unfortunately, the surveys are quite time consuming and expensive, that we may not be able to perform a classical R&R. Hence it might be quite difficult to decide whether any change in the scores between two surveys are due to random variation or genuine change towards the better or worse. Based on my experience with B2C organizations, while we need to consider the customer satisfaction scores seriously, it is more important to delve into specific details viz. Product characteristics, Quality, Service support, Value for money etc. It is also important to be clear why the satisfaction survey is undertaken. Is it for studying the areas of customer dissatisfaction? Or is it for improving the already positive satisfaction scores? Or is it to see whether we can differentiate our product compared to competition and delight customers? Or, it could be a combination of all of the above. While I look forward to read multiple ways of making the CS scores useful, I am providing a thought of keeping in mind the Kano Model and use it as a basis for structuring, evaluating and interpreting the customer satisfaction scores, especially in a B2C situation, where the variation of inputs is expected to be higher. Plan and classify the survey elements as best as possible into the 3 categories per Kano model viz. Threshold or basic, Performance and Excitement features with appropriate sub-stratification. The percentage of positive, negative and neutral responses need to be compared with previous surveys to assess improvement in each of the categories. This will also help to prioritize the efforts on improvement actions. Obviously, the threshold factors need immediate attention to reduce the negative scoring, though we may not expect them to go very positive. We will also be able to give a balanced attention to the other categories as well and monitor the progress on each category.

-
Benchmark Six Sigma Expert View by Venugopal R While the respondents can approach this question from various angles, let me ride upon the principle of control chart to address the discussion on outlier. The control chart is a wonderful tool that helps us in monitoring process stability. To build the limits of the control chart we usually take data points from a process that is considered statistically stable – and the plotted data will determine its own control limits. While the control limits are formed, we would expect all the data points to be contained within the limits – any point that fall outside indicates a high likelihood that it does not belong to the population and is considered as a outlier. Many of you will be aware that there is a practice known as ‘control chart homogenization’, where we remove the outliers and re-calculate the control limits. In the case of charts such as X-bar R charts, where range charts are available, the outliers need to be removed from range chart first and then check whether the data gets homogenized. From the above practice, we can see that for making the data “statistically pure”, we have to ignore the outliers and recalculate. (Here too, we cannot keep removing the outliers beyond a certain point!). The objective here is to establish the mean value and control limits that are representative to the population and may be used for future process monitoring. However, if we are viewing the control chart for improving the process, the first step is to examine the stability of the process. More the outliers, more the instability. Then, the outlying data points need to be analysed to understand their cause, even if there are outliers on the ‘favorable side’ of a control chart. The ‘abnormal’ conditions that caused an outlier could also be a measurement error, that needs to be identified and corrected. For example, if we are studying the pattern of the quantum of fuel being purchased per day for cars from a fuel outlet and we start collecting data for a 3 month period. In between, if there was an announcement for fuel price increase, we will can certainly expect and high outlier point on the day prior to the hike and subsequently a dip, or low outlier immediately after the hike was announced. Such outliers with known reasons may be ignored for our study. To summarize.. In general, outliers are important information that help us identify a problem, (or sometimes a very favourable condition) and need to be examined in detail. Where our interest is to understand the statistical distribution of a set of data (either to set a baseline, or to validate an improvement), we may not want to get biased due to few stray outliers – hence we may exclude them from our calculation with discretion, though we may still analyse them. While monitoring a process, If we know the exact reason of particular outliers and such reasons being very extra-ordinary and usually not in our control, we may exclude them from to prevent mis-representation of a normal situation.
-
Benchmark Six Sigma Expert View by Venugopal R As most of you must be aware, the Net Promoter Score (NPS) gives an indication of how well the customers of a business are likely to recommend a product or service to their friends, colleagues or relatives. Those customers, who are highly likely to continue to avail the product or services and also recommend to their friends positively are called “Promoters”. Those customers who are unlikely to avail the product or services and would spread negative publicity are called “Detractors”. We may have some customers who fall in between i.e. they are neither Promoter or Detractor, but are people who behave neutrally. They are neither very excited about the product or Service, nor are they very unhappy. The actual NPS score is calculated by subtracting the % of detractors from the % of promoters. NPS score = (% of Promoters) – (% of detractors) Obviously, once we know the % of the discrete categories viz. Promoters and Detractors, we can calculate the NPS scores. However, the process for obtaining this discrete data is through a survey of a sample of customers. During the survey, only one question is asked “On a scale of 0 to 10, how likely are you to recommend this company’s product or service to your friends, colleagues or relatives?” Those who give a score of 9 or 10 are classified as “Promoters”. Those who give a score of 6 or less are classified as “Detractors”. Those who give a score of 7 or 8 are classified as “Passives” or “Neutral”. We can see that the purpose of using the ordinal scale is to gather the data objectively from a pool of customers. However, the way the NPS is defined, we need to identify the “Promoters” and “Detractors”. Hence the need to classify the ordinal data into discrete categories. The NPS score will not be influenced by the individual scores within Promoters or Detractors. One may also wonder how the line is drawn on the ordinal scale to define the Promoters, Detractors and Passives. It may so happen that even customers who gave score of 7 and 8 could be promoters. Also, when we classify one who gave a score of 6 as detractors, isn’t there a possibility that someone who gave 7 could also be a detractor rather than being passive. Or, looking at it the other way, even a person who gave a score of 6, need not be a detractor. Bain and Company have done several researches on this topic and the customer behaviors and it has been decided that the scores of 9 and 10 represent customers who are extremely likely to recommend whereas the scores of 6 and below represents extreme unlikeliness - and these guidelines are being used as a standard for deciding the Promoters and Detractors - and to be applied on the defined calculation for NPS.

-
Benchmark Six Sigma Expert View by Venugopal R One of the very important goals of every business is to expand the customer base and to excel in customer services. However, there could be numerous situations where a business finds itself unable to accept certain customers. Often, this inability to accept a customer could be temporary and may get reversed when the situation turns favorable. Below are some situations when, it may not be possible to accept an approaching customer: 1. Inadequate price offered by customer 2. Insufficient bandwidth to accommodate the customer 3. Lack of competency / capability to serve customer’s requirement 4. Customer not satisfying security requirements 5. Merit based acceptance 6. Customer supplied part not meeting requirements 7. Rejection due to unacceptable data inputs 8. Upholding professional ethics 9. Competitor to existing customer 1. Inadequate Price offered by customer This would probably be one of the common reasons for rejecting a customer. Over time, the price would be determined by a competitive market. However, businesses who have earned reputation for higher quality, delivery and service will expect premium price for their products / services. 2. Insufficient bandwidth to accommodate the customer When the supply is not sufficient to meet the demand, customer rejections happen. A very popular example would be to turn away a passenger because the flight is fully booked. You would be aware that some airline do ‘overbooking’ with the anticipation that there would be some last minute cancellations, but then there is a limit beyond which you will have to regret customers, who might be lost to competition or may come back subsequently 3. Lack of competency / capability to serve customer’s requirement It is important for any business to understand needs and expectations customer – and evaluate whether the business has capability and competency to meet those expectations. I once witnessed a motorcycle service center who had clearly displayed the brands that they would service, and turning away one customer whose product was not one among the displayed list, though they would certainly have had the necessary tools and expertise. This occurred to me as an example where the service provider did not want to perform outside his circle of capability and competency, for which they are reputed. 4. Not satisfying security or ‘worthiness’ requirements These situations are common with bank customers who seek loans or credit cards. Banks will have a defined criteria to evaluate the risks and credit worthiness to approve a customer or not. An air passenger may also be rejected, if there are security concerns. These are situations, where accepting a wrong customer can put the other customers or the business into jeopardy. 5. Accepting based on certain merits / qualifications The parent of a student would be a customer for an educational institution. The institution is going to accept the student only based on the students past academic records and / or an entrance test. Students who do not satisfy these requirements will not be admitted and amounts to ‘customer rejection’ 6. Acceptance based on Customer supplied part This is similar to the situation as per point no.5, but applicable in an industrial situation where a ‘customer supplied’ part has to be utilized for delivering the product / service. This is a situation where the customer is also a ‘supplier’ and if the ‘supplied part’ may not meet the requirements for manufacture-ability 7. Rejection due to unacceptable data An advocate may sometimes reject a case from a plaintiff, if the evidences available are insufficient or not convincing enough. 8. Upholding professional ethics Where there is risk of violating statutory or legal requirements, customers may not be accepted. A goods forwarding company may refuse to provide services to a client, who is not willing to follow the customs and import regulations as applicable. 9. Competition to existing customers For certain contractual agreements, there could be a requirement that services by a service provider be dedicated to a client. It could either be as a captive supplier or with a restrictive clause to prevent providing parallel services to a competing customer. This could result in rejecting such customers to comply to the contractual requirements. While a few situations have been discussed above, I look forward to read the varied experiences from the other responses. While writing this, the thought that occurs to me is that, out of the above situations, there are some where the business can work on actions that would enable them to overcome the situations and make the customers acceptable to that extent.
-
Benchmark Six Sigma Expert View by Venugopal R Process FMEA is usually done to evaluate the potential failure modes in a process that is newly developed or has undergone some modifications. For determining the probability of occurrence, the process capabilities and historical data from similar processes are taken as inputs and the ‘Occurrence ratings’ determined using the rating guidelines. The ‘Detection’ ratings are determined based on the existence and effectiveness of “Current Process Controls” that are meant to prevent the defect from going undetected. Strictly speaking, the idea of ‘Current Process Controls’ is to improve the detection and prevent the ‘occurred’ defects from escaping unnoticed and reach the internal or external customer. There are certain situations where the ‘detection’ is not practically easy. Some of you would recall the term ‘Special Processes’ introduced by the ISO 9000 standards. The quality characteristics of such processes cannot be fully assessed after the process is completed. One of the examples that I have experienced is that of ‘soldered joints’ on a PCB. Sometimes we may need elaborate testing or even destructive tests to fully evaluate such special characteristics. For these characteristics, by their inherent nature, the detection will be poor or the ‘Detection rating’ will be high in the FMEA. Here, it is extremely important that the ‘Occurrence’ possibilities are kept very low and hence a low Occurrence rating is essential. Coming more specifically to our question as to whether Process Controls help in affecting not just ‘Detection rating’, but can they also influence the ‘Occurrence rating’, I would like to take a look at the guidelines given for detection rating as per AIAG or any other major standard. For a Detection rating of 2, it says “Error detection in station (automatic gauging with automatic stop feature). For Detection rating of 1, it says “Discrepant parts cannot be made because item has been error proofed by process / product design”. Thus, if a particular failure mode gets 1 or 2 as detection rating, as per the above guidelines, it means that the occurrence of the defect has been eliminated! So, doesn’t it appear that due to effective process control, not only the detection rating has been made favorable, but also the occurrence rating? However, there’s one thing that I would like to add. In the above situation, we are highly dependent on some mistake proofing technique, that is very often dependent on technological methods. I would be concerned that one fine day the ‘mistake proofing’ shouldn’t fail to work, for which a ‘control’ to assure the continued effectiveness of the mistake-proofing would be essential. For example, while doing payment processing, one of the critical failures was a mistake in the cheque amount, which resulted in cheques being returned. An automated mistake proofing was successfully introduced for digital comparison of the cheque amount with the invoice amount using a script. However, a periodic validation to keep a watch that the script remains 'active and effective' is a necessary control to be introduced.
-
Benchmark Six Sigma Expert View by Venugopal R People who are not trained or exposed to the principles of Control charts often find it difficult to understand the significance of the Control limits and their interpretation. A good understanding of control charts starts with understanding data types. Then one has to understand some probability theory. Then the principle of Normal distribution. Good clarity on Special and Common causes. Then preferably an insight into Central Limit Theorem. Such a foundation prepares a person to have a good grasp of the underlying principles of Control Charts, their different types and application of each type of chart and so on. Even with all this understanding, usually the control charts are used for the observing any points falling outside the control limits, though there are 8 rules defined to observe statistical instability. There still remains the confusion in the minds of some as to how the Control limits differ from the specification limits and some are not comfortable with out including the specification limits also on the control charts. The run charts are much simpler and their understanding and interpretation do not require the extent of subject knowledge as above. Run charts do not have ‘Control limits’ much to the relief of those who had discomfort with control limits of control charts. Those who use Minitab to create run charts would have seen the chart has p values pertaining to the types of instability viz. Mixtures, Clusters, Oscillations and Trends. I am not explaining these terms here, since I am sure many respondents will do a good job there. However, if we go through the rules to detect instability as per the control chart, we can see that not only the four terms that are used for run charts are well covered by those rules, but additional ones as well. One may choose to use Run charts or Control charts depending upon the situation and the ease of comprehension by stakeholders involved. In many instances, some of the instability observations will be quite evident on a run chart and one may proceed by taking decisions for improvement.
-
Benchmark Six Sigma Expert View by Venugopal R The terms ‘Verification’ and ‘Validation’ have been popularized in Quality Management systems from the days of introduction of the ISO 9000 standards. However they have been indistinct for many people, and continues to be so even today. This may be because if one refers a normal English dictionary, these terms could appear as synonym to each other. In the industrial world, be it manufacturing, services or IT, any Product, Process or Design has to be defined using specifications. The evaluations that help us to ascertain that the Product, Process of Design meet the ‘specified’ requirements is termed as ‘Verification’. However, once we create a Product, Design, or a Process as per the specifications, we still need to ensure that it is capable of performing under real time circumstances, also referred to as field performance. The assessment process to ensure the performance under actual conditions under which it is intended to perform is termed as ‘Validation’ As mentioned, these terms can apply to Design, Product or Process. Let us discuss each with example. Imagine a packaging company was entrusted with the task of developing a special packing for packing a complex and sensitive medical equipment that has to be transported to a long distance. The packaging company can come up with a design and perform ‘verification’ on the design to ensure whether all the requirements have been adequately captured by the design. The company may then proceed to ‘validate’ the design by creating prototypes and ensuring that the intended purpose is served when the design is put to real use. Feedback from the design validation is used to carry out necessary corrections on the design. In a similar manner, when a process is setup, say for assembly of a TV, there will be a process lay out, specification of the equipment, resource requirements and so on. It will have to be ‘verified’ whether the process has been set-up as per the specified requirements. However, we need to perform trial runs of the process and ‘validate’ whether the entire assembling process performs to deliver the desired outputs. Hopefully, now it will be clear how the verification and validation apply to a Product. A product, once build gets ‘verified’ using certain evaluations and tests to ensure whether it complies to Product specification and regulatory requirements. For example a manufactured refrigerator undergoes various verification such as visual, measurements, electrical tests etc. However, it will further have to be validated for its performance under actual usage conditions. Accelerated tests are used by simulating field conditions. Other validation methods include subjecting products to actual field conditions using monitored trials. Moving to software, let’s take an example of a software used for credit administration in a bank. The software developer subjects it to code verification and also perform verification tests using specified test cases. However, installing the software in the actual workplace and getting it used by the employees who execute the process, and seeing whether it performs as required by the business is the actual ‘validation’ for the software. In brief, verification is always necessary before we get into validation. What could have been identified through verification, should ideally not get identified during validation, since the correction process will prove costlier.
-
Benchmark Six Sigma Expert View by Venugopal R ‘Priority Consciousness’ is one of the key topics discussed in Management. Sometimes we do hear people saying the ‘Everything is equally important’.. however, in reality it becomes difficult and even inefficient if we do not prioritize our tasks. Principle of Pareto Analysis would not require any explanation for most members in this forum. Pareto principle, though named after the Italian economist Vilfredo Pareto, was popularized and adopted in the field of Quality Management by Joseph Juran. All the seven Quality tools are excellent methods to provide guidance to problem solving, but teams have to apply their minds, process knowledge and situational requirements for the best decisions. This applies for the usage of Pareto analysis as well. There could be many ways by which the Pareto analysis may not be done to get its best benefits, and some misuse as well. 1. Not considering severity We may use Pareto analysis to classify the defects of a product based on the frequency of occurrence for a period of time… for example, take the case of an electrical home appliance. Top most occurring defect could be a scratch on the panel, and the least occurring could be an insulation breakdown. Obviously, if the priorities are judged based on frequency of occurrence alone, without considering severity, it could be disastrous! It will be a good practice to perform FMEA as well, so that the priorities are not decided just based on the occurrences alone. 2. Using Pareto charts only as a presentation tool Pareto charts are meant to be tools used as part of causal analysis, but they also serve as good presentation method. If we draw up the pareto charts just for project presentation, and do not build them during the appropriate phase of the problem solving, it is a misuse. 3. Labeling ‘stratification’ as ‘cause’ Pareto analysis can be used for stratification of data as well as for causal analysis. For example, the sales figures of a particular product across 12 cities can be depicted using a pareto, as a stratification exercise. However, if you drill down to 10 reasons for poor sales and depict them using pareto for each city, then you are using the tool for causal analysis. Sometimes, the failure to differentiate between the two, could result in labelling ‘stratifications’ as ‘causes’ 4. Improper Grouping The purpose of pareto is to identify a pattern of “Vital few and Trivial many”. If one type of grouping is resulting in a flat pareto, you may have to try some other type of grouping. For example, if you are working on improving the productivity of processing invoices and you develop a pareto of the productivity by grouping them vendor wise… assume you get quite a flat pareto. This does not allow you to differentiate productivity levels across vendors, so, you may try to group the data based on types of invoices, irrespective of vendors and develop a pareto. Similarly, different types of grouping need to be tried to identify a pattern of ‘vital few’. 5. Making ‘Others’ too tall Lack of adequate grouping can result in a very tall ‘others’ bar. We have seen pareto charts where the ‘others’ bar come up as the tallest! Certainly, the thoughts and efforts for grouping have not been adequate. 6. Missing out on ‘Quick wins’ Many times, an occurrence with lower frequency could have an easy solution, with less efforts. You should not just keep putting efforts only as per the pareto sequence, failing to notice the quick wins. Pareto analysis finds application in all phases of DMAIC phase. However, this tool has to be applied with some logical thinking and subject matter knowledge. It is a tool that helps in giving a broad level of prioritization, which has to be used along with other considerations.
-
Benchmark Six Sigma Expert View by Venugopal R How does a Six Sigma Project differ from a regular improvement initiative? While many improvements do happen continually in any organization, an improvement that is led through a Six Sigma DMAIC approach aims to improve the process. Based on the condition of the process, it may be decided after the ‘Analyze’ phase, whether we need to ‘Improve’ the process or ‘re-Design’ the process. On many instances, the project is identified and the charter created, but when we ask a question… “What process are we trying to improve?”, the team gets into a debate. Some of the issues faced at this juncture are: The team is not very clear about the process that is associated with the objective Team members come up with multiple processes and go into a discussion Team feels that a process does not exist at all What should be considered as the start and end points of the process, as relevant to the project? Team hesitant to discuss the process since they do not have direct control on many of the process steps. Once the team is facilitated to work on the ‘As-Is’ process mapping, they will be forced to clarify all the above points. A few guidelines that would help while mapping he ‘As-Is’ Process are: 1. Identify the relevant process or processes This is possible only if we have some team members who are reasonably familiar and experienced in the processes associated with the objective. For instance, if your objective is to improve the response to ‘customer inquiries’, we need to be clear about all the channels through which customers make inquiries and in turn identify the relevant processes. 2. Work back from the point of final objective. The final objective for a given project will be dependent on several outputs from previous activities. Working back will help in identifying the intermediate outputs and the corresponding process steps from which they emerge. For example, if the objective is to improve the conversion rate of hiring, the ‘as-is’ recruitment process has to be mapped. While the ‘Hired resource’ is the final output, the intermediate outputs may include the screened resources, shortlisted profiles, the job profile document from the requester etc. It may be noted that some of the intermediate outputs become the ‘inputs’ for the subsequent process step. 3. Decide the scope (start and end points) of the process Once we have identified the process and its steps at large, we need to be clear about the scope within which the project is defined. For instance, if we are trying to improve the ‘effectiveness of training’ programs, we may take the start point as the ‘Request for training’ and end point as ‘Qualified resource’. However, it is also possible to take the start point from ‘Training need identification’ to ‘On job performance of trained resources’. Both are different bands of scope that could be relevant depending on the need of the organization. However, the scope has to be specified clearly in the beginning and the ‘as-is mapping’ should be done appropriately. 4. Start with a high level ‘SIPOC’ It is a good practice to initially develop a high level ‘SIPOC’ consisting of 6 to 8 process steps. On these process steps you may identify the final and intermediate outputs, also known as KPOV (Key Process Output Variables) 5. Fine tune the SIPOC with the KPOV chart Some leaders mention their primary metrics relating to main objective and sub-objectives and secondary metrics on the project charter, whereas some others use a KPOV chart to depict the Big Ys, Small ys, Contradicting Factors and Boundary conditions. It is quite possible that while developing the KPOV charts, more clarity would emerge on the relevant intermediate outputs and you may go back and modify the SIPOC accordingly. 6. Do detailed mapping for select process steps. From the SIPOC, you will be able to identify those intermediate outputs that are considered relevant for the project under study and you may give preference to those process steps and do a detailed process mapping for them. Otherwise, doing a detailed process mapping for all the steps could be consuming high time and effort. 7. Include relevant metrics The very purpose of the As-Is Process mapping is to assess the baseline. Hence, for all the relevant KPOVs and KPIVs, indicate the metrics (targeted and actual). In case there are variables without metrics, this is the time to decide on their quantification and measurement methods. Make use of the As-Is Process map while you move on with your subsequent phases of the project. This will ensure that the exercises that you perform during the Measure and Analyse phase are relating to the process steps outlined in your As-Is Map. Where needed keep fine-tuning the as-is map for any information that you might not have added in the beginning.
-
Benchmark Six Sigma Expert View by Venugopal R Drum, Buffer and Rope is a phase used in ‘Theory of Constraints’. It refers one of the methods for ‘synchronous’ flow in a production line. The Drum refers to a workstation that could be a constraint or bottleneck. For instance if we have a production line, where we have 3 workstations, A, B and C of which 2 of them (say A and C) are capable of producing at the rate of 120 units per hour and one workstation (say B), can produce only 100 units per hour, then the overall production rate for the line is 100 units per hour. Here, the production rate of the entire line is determined by workstation B, which is the constraint, or known as ‘DRUM’. We can afford some slackness for workstations A and C without impacting the overall production rate, but no slackness is affordable for station B as it will directly impact the production rate of the production line. Since the workstation B is a constraint, it is important to place some ‘Buffer’ stock of the material being fed into it, so that there is no chance of this workstation to run out of stock. This precautionary inventory before the DRUM is know as the BUFFER. The buffer does not mean that more material will be produced than required, but it is an inventory in terms of time. This means that the buffer stock is an advance quantity of input material that will be made available to workstation B, even as it starts producing the first unit. If the buffer inventory level decreases or increases, the communication that is provided to the previous process(es) is know as the ‘ROPE’. The ROPE ensures that the system is always maintained with a required level of inventory, neither excess not short. The DBR approach helps to plan the production schedules based on the output requirements. The quantity to be produced is determined by the market / client requirement. The maximum production rate that the production line can produce is determined by the DRUM workstation. The starting time for each workstation can be worked backward from the output requirement, taking into account the production rate of each workstation and the buffer requirements. The representation shown above is a simple one for purpose of easy understanding. We can also apply the DBR on multiple lines leading to a final assembly line. Once we address a DRUM workstation with buffer, it is quite possible that we may have the possibility of another potential constraint to emerge. This would call for buffer requirements for other workstations as well. The entire network of the process flow can be mapped with this concept and the timings and buffer requirements be worked out. The DBR approach helps as a planning tool and provides inputs to Kanban dashboard for regulating the production flow, scheduling the timing for workstations and to prevent inventory build-up.

-
Benchmark Six Sigma Expert View by Venugopal R As most of you would have gathered, Bessel’s correction refers to using n-1 while computing standard deviation from a sample. The answer to this question can lead to an in-depth statistical discussion. However, let me try to make it simpler by elucidating the below two points of view. It is assumed that the readers are familiar with the equation used to compute standard deviation and the term ‘degrees of freedom’. Readers are also advised to do more thinking and work out some examples to gain more clarity. Whenever we take samples from a large population, the sample means can vary, whereas there can be only one population mean. Many times, the population mean will not be known, and hence we have to use the sample mean from each sample value (xi – xbar) in the calculation for sample standard deviation. You can observe that if you substitute the sample mean (xbar) with any other value, you will get a larger standard deviation. So, assuming we know the population standard deviation and we substitute it for the sample mean, we would be getting a larger value for the standard deviation, (unless of course the population mean happens to be exactly equal to the sample mean!) This implies that the sample standard deviation calculated using the sample mean will always be lower than the true standard deviation based on population mean. We may correct this bias by reducing the numerator in the equation for standard deviation; Bessel’s correction reduces the denominator by using n-1 instead of n. Another related aspect is about the ‘degree of freedom’. When we have ‘n’ samples, for a given mean value, except for one sample, all others have the freedom to assume different values and still achieve the same mean. In other words, n-1 samples have the freedom to vary and hence the degrees of freedom is n-1. When we calculate the ‘expected’ value of the standard deviation, we need to divide the summation of the square of differences from mean by n-1, instead of n. When the sample size becomes larger, the difference in the standard deviations computed based on n and n-1 will narrow down. The Bessel’s correction is applied to reduce the bias on the standard deviation calculation for a sample.
-
Benchmark Six Sigma Expert View by Venugopal R If we look at various Business Excellence models that emerged from different parts of the world, we will be able to see that all these models have modules addressing Financial, Customer, Operational and very importantly ‘Employee Engagement’ requirements. For instance, the Malcolm Baldrige Excellence systems address ‘Leadership System’ that includes Organizational performance. It has customer management system, Operations focus system and Workforce Engagement and Knowledge Management Systems. Of course, there are other modules as well, however, I am picking these topics in relevance to those addressed as part of the ‘Balanced Scorecard System’ Organizations that practice Six Sigma as an enterprise program, will have to address the Strategic, Tactical and Cultural elements. In the strategic element, the key focal areas are consented, which would certainly include the goals with respect to Financials and Customer focus. These goals are further deployed into Operational goals and converted as projects. While undertaking these projects, the requirements relating to knowledge and organisational capabilities get surfaced and addressed. The cultural element focuses on various human aspects relating to Change Management, motivation and inspiring innovations. The balance scorecard framework which covers Financial, Customer, Internal business processes and Organizational capacity is a very useful methodology that integrates into any such excellence programs. Just like any other Companywide program, the Balance Scorecard must be viewed not just a scorecard, but a program that integrates and involves the entire organization to get oriented towards the overall vision and mission. Ultimately, the financial goals matter most; however the focus needs to be on understanding the enablers to achieve it. Even during Balance Scorecard implementation, we do come across undue focus being given on Financial objectives, which is against the very intent of the Balance Score Card System (BSCS). Incidentally, one of the challenges that I had faced while driving six sigma programs is that many project charters were turned down because the projected benefits could not be expressed monetarily. Then a scheme was introduced that will permit such projects as ‘Yellow Belt’ projects with intangible benefits, and if in due course, the team is able to figure out the financials, the project would be considered for being upgraded as 'Green Belt'. This not only encouraged to initiate more projects, but it was also seen that for many such projects, the teams were able to express the benefits tangibly by the time they reached the Improve phase! Thus one has to find ways of integrating 'non-monitory' objectives that deserve attention. Not preparing a BSCS mapping is another pitfall. The mapping is a good representation of how the broad initiatives under each element of BSCS relate and link up to the overall business goals. Choice of KPIs is an important area – we should not over do the KPIs at the same time not miss out the key ones. There are bound to be numerous metrics, that could relate to certain key performance indicators. Adequate ground work, deliberation and cross functional consensus are required to decide the most important and workable ones. All KPIs need to worded, defined and quantified in such a way that they focus on the outcome and not on the initiative. For example, ‘Setting up a Service Incidence redressal system’ is a good initiative but an example of a good KPI would be to “Reduce the cycle time for closure of Service Incidences from current 72 hours to 24 hours”. Not having periodical reviews, say, once a quarter of the organization goals will be another pitfall. The conditions of the market, business and other factors do keep changing and it is likely that the relevance of certain goals could have changed over a period of time. A periodic review and relevance check of the goals with appropriate corrections, if applicable will be important to ensure the validity of the KPIs.
-
Benchmark Six Sigma Expert View by Venugopal R One of the key sayings that most of us would have heard while talking about Consumer Orientation is “Shed Product-Out philosophy” and “Adopt Market-In philosophy”. We come across numerous explanations about the “Push” and “Pull” strategies. I am sure that most of the excellence ambassadors will do a good job of explaining these flow systems with examples. Let me try to express my views briefly based on my experiences. An auto components company who have ‘Original Equipment’ manufacturers as their clients, has to align its production flow based on the clear orders from clients. This, of course is the case when your brand is already established and you are one of the ‘approved’ suppliers for the client. Evidently it is more of ‘pull’ strategy. Imagine that you are a new entrant to the market or you are working to obtain orders from a new customer. The ‘Push’ is needed to sell your brand and credibility and also hasten to provide a pro-active pilot sample to attract the customer’s attention positively. You may want your product to be tried out and to obtain specific feedback based on the client’s expectations and accordingly customize the product. For the same company, the products may be sold for ‘replacement’ in the open market. Imagine it is a fast-consuming product like tires, batteries or brake pads. Such products need to find their place in the shelves of the dealers for ready availability. The customers usually require such products immediately and they are not going to place an order for them and wait! The brand awareness creation, product promotion and product availability are critical here. Now this will appear to encourage a ‘push’ system in the flow. However, it could be a combination of ‘push’ and ‘pull’. The ‘pull’ for the organization could be based on data about market behavior, the consumption patterns, and the re-order levels from dealers. Let’s look at a banking scenario. The dynamics could be bit different for issues like inventory, storage, WIP etc. If a bank wants to attract more customers, they should not only have their ‘products’ ready, but also invest in adequate campaigning and promotion programs to draw customers. If you do the ‘concept’ selling for a product, but fail to make the product available before your competition does, you are actually creating more customers for your competition! You would have experienced every time you talk to the call center of your bank for any purpose, after attending to your query, they are quite likely to make you feel important and tell you that ‘you have been identified as one of our elite customers and we have a special offer for you’. And it will usually be an offer for providing you a loan or a credit card! Obviously, they have a target to ‘push’ a product! Even the bank is going to cut your card, only after you submit your application, which happens to be a ‘pull’ trigger here! Which is better – Push or Pull? Looks like both have their merits depending upon the situation and other conditions, and maybe sometimes they appear to co-exist. Some of the senior members in the forum may recall around 3 decades ago, how we had to place an order and wait for several months for buying a vehicle or to get a telephone connection. We see how all this is transformed in today’s world. How do we relate this to Push / Pull strategy and why? I leave it to be given some thought!
-
Benchmark Six Sigma Expert View by Venugopal R Deciding and defining the “Opportunities” has been a highly debated topic while practicing DPMO. Let me share a couple of related points that I have come across. Let’s take an example of insurance claim forms being processed. Assume that the form has 20 fields of information. Let’s say each field represents an opportunity for a defect. When 100 such forms are processed, the total number of defect opportunities are 2000. Now if we detect 50 defects after processing 100 forms, the defect per opportunity is the total number of defects divided by the total number of opportunities = 50 / 2000. The DPMO will be 50 / 2000 * 1000000 = 25000. For the same example, if someone wants to consider the defect opportunities for each field as ‘wrong entry’ and ‘no entry’, this would mean that the number of opportunities in 100 forms will be 20 * 2 * 100 = 4000. The DPMO in this case will work out to 12500. Without a clear and common understanding and agreement on the definition of ‘Opportunities’, the DPMO data could be misleading and also prone for manipulations of the sigma values. It is important to define and have a uniform agreement on the applicable ‘Opportunities’, so that the baseline of comparison remains relevant. Another point of importance is that many a time, customers prefer ‘Defective’ based metrics. viz. % of parts that did not conform, Proportion of forms that are error free, etc. In such situations, for a same level of Quality, the Defective based metric will appear to be very stringent compared to the DPMO based metric, since the denominator of the latter could be very large.
-
Benchmark Six Sigma Expert View by Venugopal R Most of the Excellence Ambassadors will be quite familiar with Kano Model and I expect to see very good responses. However, for many organizations, Kano model remains as a concept than being converted as modus that is exercised regularly. I am outlining the key steps for building the Kano plot. One of the simplest ways is to of depicting the features of a product or service as a ‘scatter plot’ on the Kano template. It is important to indicate the date of preparation of this Kano scatter plot. While preparing this plot, the process of judging the location of each feature is very important and should be as objective as possible, and as seen from the shoes of the customers. The key steps in this process would be: a) Decision on the features to be evaluated– decide the scope of your study b) Identification of source of inputs (select customers) – decide to pick your customers within certain limit, for e.g. a particularly demographic or a representing a section of the target market c) Structured method of gathering data – Questionnaire based survey; possibility of mock demonstration of features d) Analysis of the findings; Plan suitable sampling to capture possible variation on the response to same features and to decide its positioning on the Kano plot. The entire process of the exercise has to be well documented, so that the process can be repeated at later point of time to understand the shift on responses from ‘Performance to Threshold’ and ‘Excitement to Performance’
