
Topics
-
Fifty-five women engineering students completed an AI bootcamp focused on rural Karnataka. Participants developed AI-based solutions after visiting villages and conducting field interviews. The She Innovates bootcamp partnered with several organizations to achieve its goals. This initiative aims to boost women's participation in AI and entrepreneurship. It encourages AI applications for rural development and community-focused sectors. View the full article
-
Besi's quarterly orders more than doubled, fueled by AI and hybrid bonding technology. The company saw increased customer adoption of its advanced chip packaging solutions. Demand for AI applications continues to drive growth in data centers. Besi anticipates revenue growth between ten and fifteen percent. This strong performance aligns with other semiconductor sector reports. View the full article


Leaderboard
-
Mohamed Asif Abdul Hameed
Fraternity Members1Points78Posts -
Vinod GC
Lean Six Sigma Black Belt1Points26Posts -
Rupinder N
Members1Points178Posts -
Abhishek Chaudhary
Lean Six Sigma Black Belt1Points16Posts


Popular Content
Showing content with the highest reputation on 08/10/2021 in all areas
-
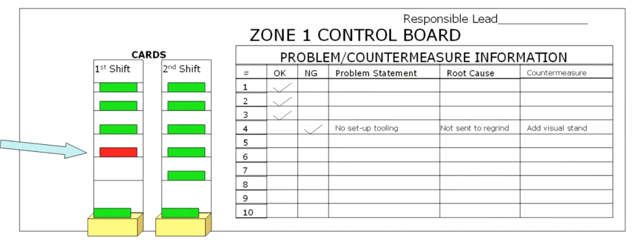
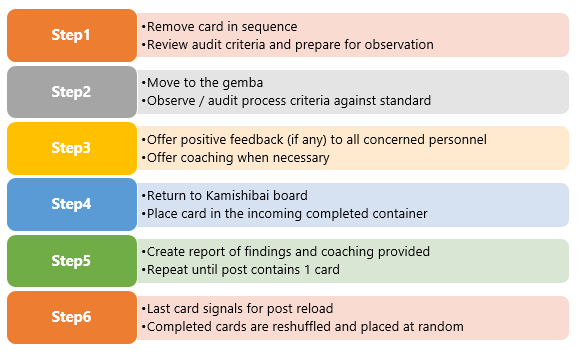
1 pointKamishibai is a Japanese word translated in English as ‘paper drama’. The concept originated in the eighth century in Japan when Buddhist monks used ‘picture scrolls’ for describing the history of earlier monasteries. This popularised in 1930’s post-war as a form of storytelling using picture scrolls to convey stories with moral lessons to the audience where most of them were illiterates. Kamishibai Board in Lean Manufacturing: Toyota capitalised on the concept of “Kamishibai”, customised it to put to use as a visual control board detailing process audit schedule and parameters to perform periodical audits within their manufacturing process primarily to ensure safety, cleanliness of workplace (5S) and quality checks compliance. The concept was integrated to the Toyota Production system. This visual control method helped to ensure that audits are performed consistently. Generally, the kamishibai boards are placed close to the workplace in the vicinity of the process under the scope of audit. Visual indicators (Red / Green colours) provide the status of the audit, whether they are complete / incomplete and also if there are any violations to the standard work. Kamishibai board collaborates well with the “genchi gembutsu” principle to make the gemba walks structured and effective defining strong visual controls and clear standards. Kamishibai standardises the process of audit itself to reduce variability in the outcomes of the audits done by different people. The audit cards specify details of 5W+1H (who, what, where, when, why & how) to reduce variability in the audit process. Key Objectives: Here are few key objectives the Kamashibai board concept aims for. · Establish standard audit method to detect variations against a known standard · Shared responsibility and commitment · Expose abnormalities / variations against the set standards · Prompt timely correction of root cause(s) of the abnormality · Create a healthy environment to challenge the current conditions · Create an environment of continuous improvement Components of the Kamahibai board: 1. Flip over cards – one side red and other side green colour with same instructions 2. Standard work instructions – Instructions to perform the audit at the prescribed location (5W+1H) including criteria developed from known standard conditions 3. Standard schedule – a schedule containing a balanced (WHO conducts audit, WHEN is the audit done and WHERE should be the audit done) shared responsibility and commitment. 4. Output of audit – visual record of findings, root cause and counter measures. 5. Incoming completed – a box to collect all completed incoming audit cards. Steps followed: Kamishibai boards in service industry: Audit requirements prevail commonly even in service industries and hence the kamishibai board / method can be applied effectively. An interesting example of using the kamishibai cards in services was found at MU Health Care, USA. One of the units at MU health care, uses this concept to do a safety audit on one high risk patient every shift. Learning about this initiative, the oncology department uses this concept to identify and remove obstacles causing patients to fall. The team came up with an acronym TUMBLES which stands for Toilet, Urine, Medication, Beds, Linens, Exercise Equipment and Shoes to describe the risk factors and created audit checklists focussing on them. The audit was carried out following the steps which eventually led to a 50% reduction in the fall rate. This program was so successful that other units started adopting the concept to put them to use focussing on specific goals.
 1 point
 -
1 pointKamishibai board is a visual control center in the workplace which is used for performing audits especially in a manufacturing process. A number of cards are placed on a board and ensures that the safety and cleanliness of workplace is maintained and that quality checks are being performed to ensure adherence to laid down processes. The Name Kamishbai has its origin to Japaneese traditional storyetelling practice where Children are taught to build up a mini-theatre and show the pictures as they tell the story as we see the storytelling supported by a storyboard in cards in Kamishibai concept / board. Kamishibai Cards look like the Kanban board in the manufacturing processes and Toyota is widely using this concept to do their daily / weekly / monthly audits of the processes. Toyota used this term 1st un 2006 at a seminar where emphasis was to how better track the day to day activities and guide people if something deviates from the planned output. Usage of Kamishibai boards found in tacking many processes / activities in manufacturing plant like production, maintenance, sourcing and procurement etc. Why Kamishibai is used ? Objective of using Kamishibai is not a fault finding process. The proper use of a Kamishibai is to train the mind and eyes of the involved person’s to see problems (deviations from the standard output), identify improvements even though these are small, and teach others also to see and solve these kind of problems. In Kamishibai framework, diligently completing the audits is also as critical to success of it as the result of the audit itself. The purpose is not to find the mistakes, however the problems should certainly be made visible. The purpose is to get into the habit of checking the important activities each day. The Kamishibai card is printed on both sides where one side is green and other side is red. To help the people who may be color blind, a symbol should be added to identify go (O) and no-go (X) conditions. How Kamishibai helps the Manufacturing ? Using the Kamishibai board, one can easily track and improve the daily / weekly / monthly conformance to the laid down standards. Like a supervisor for maintenance can use this method to track the critical maintenance activities checkpoints in daily / weekly / monthly basis and bring the problems to surface using this method. These boards are located very near to actual workplace. Kamishibai board is used during the Gemba walk by the leaders and this add more effectiveness and structure to the Gemba walks which may be aimless otherwise. Kamishibai systems specify the 5W1H (who, what, where, when, why and how) for confirming process standards. How Kamishibai can be helpful in Service Sector ? I can think of various standard processes which can be tracked, visualized and improved using the Kamishibai board : 1. Audits Planning and Tracking Process – Daily / Weekly / Monthly tracking of critical deliverables. 2. Administration - Daily / Weekly / Monthly tracking of transport, maintenance etc. E.g. Transport team may use it to day to day critical activities as below : 1. HR team may use Kamishibai dashboard in Recruitment function to track the candidate fitment for required profile. 2. SCM / Procurement team may use it for tracking the materials receipt / responsibility and their conformance to standards. 3. Internal IT teams may use this method to track incoming / outgoing / WIP faulty systems on day to day or shift to shift basis. 4. Software development may use the same to track day to day activities related to daily submissions to client / increment / work quantum they have to complete and same way critical deliverables for the month / week / quarter. Some of Famous Companies using Kamishibai : So if we see since Kamishibai is an effective tracking and improving tool, it can be used across sectors / industries for tracking day to day activities and to surface out the problems and improve the same by taking the counter actions on the same. The usage of this tool is independent of nature of sector (Manufacturing / Sector) as we saw.


 1 point
 -
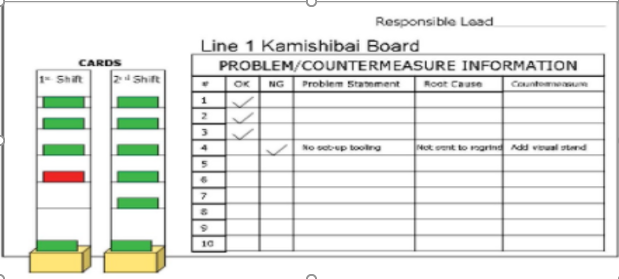
1 pointKamishibai Board is a tool for visualization of management system and standards. It was originated in 12th century in japan where people will show story telling of Buddhist moral through paper theater for people to self audit themselves so that they can check & compare if they are living the right way or not. Generally audits or checks are done on daily, weekly, monthly or quarterly basis. So Kamishibai board visualizes the steps that need to be taken for the audit and NCRs that are pending. That is how it standardizes the audit process and eliminates the need of specialized expertise. It contains 5W1H information (Who, What, When, Where, Why & How information) on the board. This information is written on the card which are placed on the board. It is useful for Gemba visits. Anyone can come, pick the card and check the system. The NCRs are issued and countermeasures are also mentioned. This board is located where it is visible to process owner and can be easily accessed. As is the case with most manufacturing originated tools this can be used in service industry as well and vice versa. A good example would be Car service centers where you can generally see Kamishibai Boards. It is used for auditing the basic checks on daily basis and even used for higher up audits. Another example would be Call centers where it can used to check the canteen facility. the quality of hygiene. Same can be displayed near work station. I am attaching a basic example of Kamishibai Board.
 1 point
 -
1 pointWe use run chart to see if there is any sign of special cause variation in our process data. It is graphical representation of the process performance plotted over time (hourly for Continuous Flow processing and most commonly in days or in months) Most importantly, What is Run? It is 1+ consecutive data points on the same side of Median (Either above median or below median) Variations can be common cause or special cause. Point to note: Common cause variation is outcome in an Stable process that is predictable & Special cause variations is outcome in an Unstable process that is not predictable By using run chart, we will be able to find the trend and pattern in the process data set Common patterns of non-randomness include: Mixture Patterns Cluster Patterns Oscillating Patterns & Trend Patterns When we run control chart on Minitab, it detects whether above mentioned patterns are existing in the data Sample data – Considered gold price/10 grams for the last 55 months Classification: Public In the above chart we can witness, clustering and trends. Cluster Pattern: In general, it is set of points in one area of the chart, above or below the median line. Thumb rule for cluster, 6+ continuous nearby points above/below the median line We can also check out the P value to see if there is potential cluster in the data Specifically, when P value is < 0.05, we could say possibly the data could indicate cluster. In reference to the above Run chart, Approximate p-value for clustering is 0.000 which is less than 0.05, so reject null hypothesis. Cluster can show sign of potential sampling or measurement issues. Trend Pattern: It is sustained drift in the data set; either upward trend or downward trend; Thumb rule to conclude trend is 6+ consecutive points either higher than previous data in one continuous period or the other way, that is 6+ consecutive points lower than previous data points. In the referred above chart we could observe an upward trend and P-value is also less than 0.05 to conclude potential trend. Now as we know about Cluster and Trend, lets note the below points: Opposite of Cluster is Mixture & Opposite of Trend is Oscillation Oscillation: When the process is not stable, we get data points spread above and below the median line, looks like oscillation. Thumb Rule: 14+ points in one continuous period increasing and then decreasing cyclically For P value < 0.05, possible oscillation can be observed. Classification: Public Mixture: When there are no points near the center line, with 14+ points upward and downward, increasing and decreasing over the median line and P value <0.05, we can have potential mixture in the data set. Run Chart & Control Chart In Control chart, along with the center line we have the upper and lower control limits. Another major difference is in Control chart - Center line is median and in Run chart - Center line is Mean; Run chart does not give any detail on the statistical control limits. We can see control chart as an Enhancement to Run Chart. In control chart, we will be able to check the stability - whether the process mean and variation are stable; check whether any out of control. We can check normality - data is normal or non normal; But it does not provide view on patterns. When we use control chart from assistant view in Minitab we get below output view: Stability Report Classification: Public It gives commonly used patterns for reference, however does not highlight the pattern in the output. Control charts will be useful over an Run chart, when the focus in on the variation and to identify potential deviation. However, downside of control charts is that it could have below limitations and can cause unnecessary wastage of time. False Alarms Incorrect Assumptions Incorrect Control Limits Both - Run chart and Control charts has its own advantages and used for different purpose [Run - Trend & Patterns; Control - Stability] and are useful based on the required objective, situation and analysis.


 1 point
 -
1 pointThe chosen best answer is that of Prashanth as it lists most often used control methods, though I would change the order slightly: As mentioned by Venugopal, risk studies such a FMEA are the starting point to instituting any controls. Of course, FMEA is also repeated at some frequency and that can be considered as a control, too. I would re-order the list as: 1. Mistake Proofing - Poke Yoke 2. Statistical Process Controls 3. Response and Reaction Plans - this assuming that the error is being detected and corrected before it becomes a defect. 4. Inspection and Audits 5. Process documentation 6. Process Ownership1 point


This leaderboard is set to Kolkata/GMT+05:30