

Vinod GC
Lean Six Sigma Black Belt
-
Joined
-
Last visited
Everything posted by Vinod GC
-
A prompt + flow-based solution implemented in a FM company is designed to refer to all regulatory and compliance policies maintained within its knowledge base. Agents are prompted to identify and flag any deviations which could be reviewed and resolved prior to execution. Compliance risks in Facilities Management domain AI could help prevent 1. Health & Safety regulations non-compliance · Failure to reference safety work practices and mandate work permit requirements E.g. “There is no need for a work permit as the nature of work is minor” · Notify about gaps or omissions in risk assessments and incident submissions. E.g. “Lack of documented evidence for executed LOTO (lockout-tagout) procedures”. 2. Personal (client) data breaches · Exposing personal details of clients in reports / messages without their consent E.g. “We have completed the first cycle of HVAC PPM at Burj Khalifa” · Sharing an employee’s health related information with others by mistake E.g. In a weekly report, “Employee Mr. Subash, has been suffering from chronic bronchitis” 3. Service level agreements delusion · Unrealistic commitments to clients E.g. “We target a 100% success rate in resolving issues on the first visit.” · Lack of clear and accurate updates on tenant escalations E.g. “Marking incomplete escalations as completed to achieve compliance” 4. Contract non-compliance against Labor law · Unauthorized role assignment E.g. “An employee assigned to take on an elevated role (without remunerational compensation) which contradicts the contract” · Unavailability of overtime and payment records E.g. “Unavailability of overtime records for an employee worked more than regulated hours” 5. Unprofessional language · Defensive response to client escalation E.g. “This has happened due to incorrect use of your tenants” · Assigning fault to specific personnel or vendors without constructive context. E.g. “Delay in fixing the problem happened as the vendor did not supply material on time” How AI agents could offer feedback in a helpful, non-intrusive way 1. Real-time suggestions AI agents can highlight (change color or underline) compliance risks in real-time enabling the user to make corrections. E.g. Highlighting a risky statement such as “bypass the LOTO procedure” and suggest mandating compliance with LOTO procedures. 2. Send feedback via suitable interfaces Agents can be made to collaborate with the integrated system interfaces to highlight / flag non-compliance. E.g. Highlight inadequate documentation such as risk assessment prior to execution of work orders in CAFM (Computer Aided Facility Management) system. 3. Proactive risk identification and elimination Before the completion and execution of a task, the agent can perform a quick check to identify potential risks and communicate suggestions. E.g. Prior to submission of a work contract, AI scans the document and identifies an out-of-scope clause and suggest “the nature of work defined under section5, point 3 is out of scope, please ensure to review and edit”. 4. Conversation and tone optimization The agent could identify inappropriate tones related to the context and target recipients and suggest adjustments to optimize matching the context and situation. E.g. “The tone of your message may upset the client; would you like to rephrase and make it more suitable for the context?” 5. Metrics based feedback Displays a visual indicator to indicate compliance scores such as confidence score to give an idea to the user. E.g. When the agent finds any area of risk or non-compliance it displays a low confidence score like 65%, which gives an indication for user intervention. The score shall be tied up to highlight the areas behind low score. There could be several possible means using which AI agents could provide feedback. That way the agent works as a silent vigilant partner and builds trust by preventing compliance errors, safety and security breaches which could have a huge cost and reputational impact.
-
Prompt + Flow based AI solution can be beneficial in identifying and reporting recurring hidden patterns in cross functional processes. Below described are the inputs required and a probable system design that could identify and present hidden patterns. Inputs required: 1. User inputs : Issue description, escalation messages, audit observations, discussion summaries etc. 2. System data: Data source, system logs, timestamps. 3. Historical data: Previous issues, escalations and their resolution records with satisfaction / resolution ratings. 4. Objective: Defined AI solutions purpose and role. System workflow: 1. Data ingestion: Extract key information from the unstructured input data ingested. Tag / categorize the extracted key information. Extract sentiments, related departments and impacted processes. 2. Pattern detection: Group similar issues using semantics in NLP (use key words such as delays, errors, expensive etc.).C compares historical data, identify patterns, trends (time series analysis), correlations, cross functional linkages and its impact. Generate various hypotheses and assess validity. 3. Impact analysis: Estimates the quantitative / qualitative impact against key metrics. 4. Summarization: Generate concise summaries using fragmented inputs from previous step. 5. Reporting: The summaries can be circulated to a closed group using automated reports, dashboards for structured visualization which enables quick decision making. Example: Let us consider a scenario where HR, Finance, Operations, and Tech Support are involved and see how the system identifies patterns. 1. Data ingestion: HR – Increasing employee attrition related to performance Finance – Cost of poor quality (COPQ) has been increasing over a period of time. Operations – Penalties due to delayed shipments Tech Support – Decreasing network availability 2. Pattern detection: System identifies keywords such as attrition, increasing cost, delayed shipments, network availability. Identifies patterns such as, Network unavailability >>> performance issues >>> shipment delays. Shipment delays >>> penalties >>> high COPQ. In summary, network unavailability has affected operational work that has led to employees’ underperformance. This increased shipment delays which spiked penalties and COPQ. 3. Impact analysis: COPQ increased by 30% during shipment delay periods. Penalties average $250K per month. 60% of performance warnings were during network unavailability. 4. Summarization & Reporting: Root cause: Network instability causes shipment delays, impacting employee performance and high costs. Recommendation: Upgrade network bandwidth and establish business continuity protocols. Reports: Correlation plots (COPQ vs Shipment delays)
-
Scenario: High level façade cleaning is a very critical job and requires careful risk assessment and method statement prior to execution. Skilled technicians visit work site prior and prepare RAMS (Risk and Method Statement) manually which is tedious and time consuming. A Prompt and flow-based AI assistant can dynamically these documents, guided by structured prompts and conditional flows based on the location, building structure, access methods, elevation, surface material, weather and other regulatory compliance needs. Orchestration of prompt and flow logic: High level flow diagram: Initiation -> Details gathering prompt -> Risk identification sequence -> Risk & Method statement builder -> Output generator Detailed flow: 1. Initiator Objective: Define scope of work and trigger AI workflow AI Action: Capture work related data, identify and load the contextual flow, create session for saving details and future access. 2. Prompt1: Gathering details (site & access) Objective: Collect work details including limitations and constraints. AI Action: Understand and classify related work-zone hazard and define variables. 3. Prompt2: Identification of risks Objective: Identify all risks and prepare mitigation measures. AI Action: Generate and list risks identified based on user inputs. Generate mitigation measures based on pre-trained logic. Provide room for human validation and inputs. 4. Prompt3: Risk & method statement building Objective: Build comprehensive risk mitigation and methods plan AI Action: Build the method statement in the pre-trained flow. Embed safety and regulatory protocols. 5. Prompt4: Report generation (RAMS) Objective: Generate and output RAMS AI Action: Assemble the final report in the required format. Route the document for review, validation and approvals. Why does this application stand out? Increase efficiency: The amount of manual time-consuming efforts can be minimized, and the output can be obtained in minutes. Eliminate errors: Well-defined agents can produce high quality and well-defined reports eliminating risk of errors. Enhance safety: All aspects of work-related risks are systematically identified, eliminating risks and enhancing work safety. Saves cost: Regulatory non-compliances and other risks could lead to imposition of fines and business risks which can be eliminated. Less skill: Preparation of RAMS could be done with less experienced personnel; however, the quality of input is critical.
-
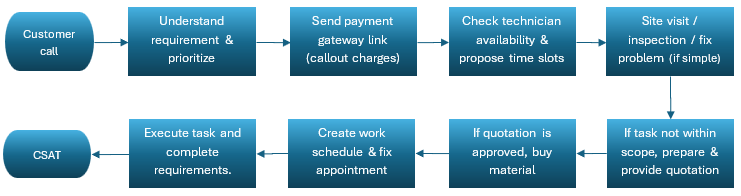
A Facilities Management (FM) company into B2C business caters to requests from customers related to facility maintenance including Plumbing, Carpentry, Civil, HVAC, MEP, Housekeeping, Pest Control and Façade cleaning works. The company has a call center with human agents to attend customer calls / messages, understand the nature of the request, evaluate priority, check technicians’ availability, initiate advance payment and schedules for site visit. The workflow continues until the customer request is resolved and customer satisfaction survey is triggered and logged. Below mentioned is a high-level process flow. The company has the following challenges: 1. Low customer satisfaction ratings due to a. High call waiting time (time taken by human agents to respond to calls / messages) b. High response time (time taken to visit site and address the problem) c. Communication (language barriers) 2. Low human agents’ utilization (volume of requests has seasonality, agents are idle during lean period) 3. Technicians’ utilization (due to improper scheduling and optimization) Obviously, these challenges impact the company’s financials. The company decided to make improvements in the process using suitable AI solutions thereby addressing the afore-mentioned challenges. Important aspects to consider choosing a suitable solution include the cost of implementation, speed of implementation and scalability. These AI solution options are evaluated: 1. Conventional AI 2. Fine-tuned LLM 3. Training a new AI model from scratch 4. Flow & Prompt based design Choosing the AI Solution: I would decide to use “Fine-tuned LLM” as it best fits the objectives and requirements. The reasons why this option is considered are because: 1. It reduces implementation costs as only fine tuning is required to do specific tasks. 2. Deployment will be faster as only fine tuning is required. 3. Fine-tuning requires high quality data which the company has collected and stored in the past years. 4. The pre-trained LLM already brings in vast capabilities that the company could leverage. 5. Specialized resources are not required for deployment 6. Can handle domain specific process very well Why other options were not considered: Conventional AI: Suitable for simple tasks but has limited scalability options. Training a new model from scratch: Tedious and time consuming requiring specialized resources. Flow & Prompt based design: LLM capability limitations. Could provide inconsistent outputs to ambiguous queries. Best for scenarios with data limitations. However, this could have been another option considered.
-
This table compares a few aspects of the four distinct AI solution building approaches. Aspect AI Solutions Approach Conventional AI Fine-tuning LLM Training new AI model Flow & prompt engineering Characteristics Rely on basic techniques such as regression, decision trees, CART or rule-based logic. Requires structured data and programming. Use a pre-trained LLM to finetune using domain specific dataset to adapt to a particular task. Uses methods such as PEFT, Prompt tuning, RLHF etc. Build a custom model from scratch using large volumes of raw data without relying on any existing LLM. Provide structured, contextualized prompt instructions to existing LLMs using few-shot prompting, chain of thought reasoning methods. Advantages Good transparency and explainability. Lower cost due to low computing requirements. Provides precise outputs. Reduced cost as only fine-tuning is required. Benefitted by the LLM vast capabilities. Faster deployment as not required to build. Complete control over the architecture. Not influenced by existing LLM limitations. Can be customized for highly specialized tasks. No training or fine-tuning is required. Faster deployment. Cost effective. Flexible adapting to new tasks. Limitations Limited scalability options. Cannot function well with unstructured data. Extensive feature engineering. Requires high quality data for fine-tuning. High computing capability. Carries risk of over-fitting and bias. Large dataset requirements. Tedious and time-consuming development. High chance of failure. LLM capabilities limit performance. Inconsistent output to ambiguous queries. Best suited for Simple and well-defined tasks. Applications with structured data. Applications with high regulatory compliance. Domain specific applications. High quality domain specific data. Organizations with non-specialized resources. Specialized needs not served by existing models. Organizations with specialized resources. Less critical applications. Faster development and deployment. Scenarios with data limitations.
-
The narrow / weak AI technology that we currently use has numerous technical limitations preventing full reliability on AI systems. Let us assume that five years from now these limitations are addressed due to evolving technology. In that case, if we could design an ideal AI agent for the BPO environment, there are few capabilities the agent would have. Ideal agent capabilities: 1. End to end process management: The agent would manage the entire process (not only routine tasks) eliminating the need for human intervention. The agent would gain cross functional knowledge through self-learning and its enhanced unstructured data handling capabilities. It would also be able to integrate across systems seamlessly without the need for API’s or other integration mechanisms. 2. Self-directed process improvement: Agents will have the ability to identify process inefficiencies / variations, underlying root causes and propose validated improvement recommendations. Eventually they incorporate those recommendations and finetune demonstrating continuous improvement capabilities. 3. Emotional intelligence: Natural language processing (NLP) could have superior emotions handling capabilities that could enable agents to listen and respond like a skilled human. It will provide emotionally tailored responses displaying happiness, empathy etc. 4. Superior Personalization: Agents shall have the ability to remember historical (over longer periods) conversations and personalize their responses proactively. 5. Seamless collaboration: Agents will be able to participate in team meetings along with humans, ask a human agent questions, listen to the conversations, summarize key takeaways and change behaviors / performance as required. There will be seamless collaboration between the human and AI agents. Probably these capabilities are currently being experimented or at a fictional stage, however this could become a reality sooner or later. Risk Guard: Under such circumstances, one of the risks that I would want to guard against would be the risk of human skill erosion. With AI taking over human responsibilities, there comes the risk of fading problem solving, critical thinking, creativity and other skills. On conflicting situations that demand these skills, human intervention must still be sought.
-
Ethical Dilemma Situation: A Customer Service BPO has its existing customers categorized as VVIP, VIP, Important, Regular and Blacklisted. They use an AI agent which is modelled to prioritize incoming calls / text messages of VVIP and VIP customer category and record their queries / complaints while other category customers are subject to long waiting queues. Dilemma: VVIP / VIP: This category is kept happy with an intent to maximize revenues and achieve SLA KPI’s. Others: Unethical as they are subject to long waiting periods even if the nature of the call could be to address an emergency. As the AI agent follows the applied logic of prioritization, such dilemma situations could arise leading to dissatisfied customer base, reputational damage to the company or even legal disputes. Approach for guided decision: 1. Define ethical principles in KB Create a list of ethical principles aligned to the organizational objectives, add to the internal knowledge base and train the AI model to adhere to the principles. This will make the agent strike a balance between guiding principles and rigid rules. 2. Weighted priority: Build in weightages of priorities between customer category and query urgency. This will help allocate a reasonable balance between category and urgency. 3. Human in the loop (HITL) system: In case of conflicting situations which the agent is not able to handle, create a mechanism to escalate to human agents for intervention and decision making. The AI agent must be capable of learning and improving referring to the human decision. 4. Compliance audits: Conduct periodic compliance audits to review the agent’s decision compliance in accordance with the guiding principles. Drawing the line: What should AI do? Preliminary prioritization, escalate in case of conflict, follow guiding principles, provide explanation for decision and continuously learn & improve. What should AI not do? Decision in conflicting situations, override guiding principles.
-
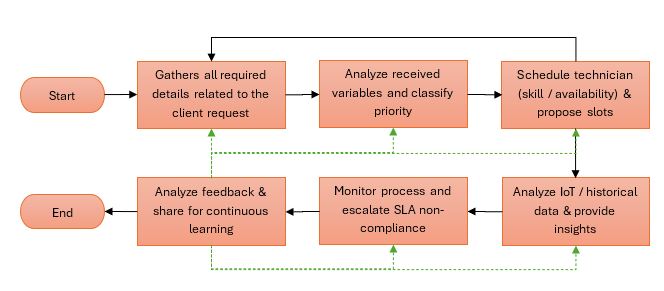
For this discussion, let us consider the automated process of maintenance request management in a Facilities Management (FM) company which caters to B2B and B2C clients. This process is automated involving multi-agent AI collaboration. Described below, the AI agents that shall be used and their roles. I. Agents & Roles: 1. Agent A (Conversational AI) - This agent interacts with the client (through omni channel platforms including, web portal, mobile app, chatbots, WhatsApp or voice), gathers all required (defined) variables, understands and categorizes the request. 2. Agent B (Classification & Prioritization AI) - The role of this agent is to analyze the request considering all input variables and classify the urgency level (Critical / High / Moderate / Low) of the request. 3. Agent C (Scheduling & Optimizing AI) - Based on the urgency level classified by Agent B, this agent optimizes, and schedules technicians based on their availability, skill and location and communicates available slots back to the client through Agent A. 4. Agent D (Analyzer AI) - This agent checks, if the asset mentioned in the client request has IoT sensors, gathers log data, fetches historical maintenance records and analyzes them to validate the fault described by the client and possibly identify its root cause(s). The agent also provides fault & potential remedy insights to the technician prior to the site visit. 5. Agent E (SLA Compliance AI) - The role of this agent is to monitor and track the workflow and escalate risks and potential SLA non-compliances proactively. 6. Agent F (Feedback AI) - This agent captures client / technician feedback, collates overall workflow performance and feedback insights for other agents to learn and improve their performance continuously. II. High-level Workflow: III. Potential challenges in coordination between agents: a. Conflicts: Agent C (Scheduling & Optimizing AI) could schedule over / underestimated duration prior to Agent D (Analyzer AI) validating the complaint and finding the root causes. Likewise, Agent B (Classification & Prioritization AI) could misclassify the priority prior to validation by Agent D (Analyzer AI). b. Time Delays: If all technicians are busy and the company doesn't have adequate resources, Agent C (Scheduling & Optimizing AI) could fail to schedule allocation of technician for a critical job leading in delays to addressing the priority. c. Data Consistency: Formats of varied input data used across the Agents must be normalized, else might lead to misinterpretation leading to incorrect agent outputs. d. Error Dissemination: Logical error caused by the agent at any stage in the workflow could have a cascading effect on subsequent decisions and actions. e. Explainability: Both the agents D (Analyzer AI) and E (SLA Compliance AI) must have the capability to explain the rationale behind their findings about the root cause(s) and non-compliance(s) respectively. IV. Strategies for smooth AI agents' collaboration: a. Central Orchestrator AI Introduce a central workflow manager agent to ensure the workflow progresses in the right sequence with adequate information to resolve conflicts. This will help avoid time delays and avoid conflicts. b. Shared Memory Build a central repository that stores real-time data along the workflow. This helps break data silos. c. Explainability Agents must have the ability to record the rationale behind each action / decision. Based on the flow of work the agent must have the ability to provide real-time alerts such as "the work is delayed due to the complexity of the problem" etc. d. Fallback Protocol Define clear fallback protocols such as escalation mechanisms to alert delays, disputes, SLA noncompliance and unresolved issues. e. Secure design: Firmly controls the exchange of various information from knowledge base(s) and between agents. Map exchange of required information across agents. Doing this shall eliminate conflicting decisions. There could be more strategies applied depending on the type of applications, architecture and technology used, considering their limitations and the application purpose.
-
Mentioned below is the break-up of the question for our discussion. 1. Describe a scenario where AI accountability can be a concern. 2. What responsibilities can be assigned to AI agent and stakeholders. 3. Design safeguard mechanisms to ensure transparency and traceability. 1. Scenario where AI accountability can be a concern: A Community Management company has developed and deployed an AI agent to manage their incoming maintenance requests from tenants across different sites by asking & recording required details, prioritizing requests, creating work orders and assigning available technician. The agent uses historical training data to identify the impact and priority. On a typical day, a tenant encounters electrical sparks in the electrical panel due to water dripping from the AC. The tenant follows the protocol, contacts and provides all details asked for by the AI agent. This is obviously a matter of danger. AI processes the recorded details and classifies this as “low priority” and schedules the workorder for the next day. Here the agent failed to sense the urgency of matter and act accordingly, which is a matter of grave concern. Who shall be blamed for this failure? How can be build responsibilities? 2. Responsibilities that can be assigned to AI agent and stakeholders: a. AI agent: It is not a legal being and hence cannot be made accountable for any of its outputs or results. b. Data scientist: Ensure to provide clean, contextual, clean, unbiased and adequate data for training the model. This is crucial to determine the accuracy of the model. Accountable for model performance. c. AI developer: Identify the right technology, platform, build risk-aware models and integrate fail-safe, traceability and explainability features. Assess the relevant model performance assessment metric such as sensitivity / specificity etc. Ultimately responsible for logic / code related flaws and failures. d. Operations team: Continuously monitor the system’s performance until satisfactory levels of performance are achieved. Intervene and override model outputs when the model provides incorrect outputs. Provide feedback to finetune the system to continuously improve its performance. e. Compliance & Audit team: Responsible for assessing all risks with its counteractions. Define acceptable levels of performance. Periodically audit to identify bias, flaws and security breaches. f. Core committee (Governance Team): Provide strategic directions and take ownership of AI initiatives and outcomes. Manage escalations and legal conflicts arising due to AI related crisis. 3. Design safeguard mechanisms to ensure transparency and traceability: Deploying AI agents replacing humans could affect quality and compliance of service. How can we build transparent and traceable systems? a. Transparency: i. Build Explainable AI: The AI agent must have the capability to explain the rationale behind the decision using simple language. ii. Realtime risk scoring: Display the risk score in real-time to the tenant and technician that AI computes based on the keywords in the problem description. This will help them refine their words to increase the risk score. iii. Safety layer & Human-in-the-loop (HITL): Add a safety layer to the model defining key words such as leak, spark, fire etc. where the AI agent can bypass and notify a human when the defined keywords are detected. b. Traceability: i. Detailed Decision logs: Maintain details logs of all version changes, access, feedback loops, communications, actions, decisions and decision overrides. ii. End to end tracking: Create unique records for each cycle, starting from tenant inputs, AI actions / decision, technician assignment and workorder closure with CSAT scores. This will help trace the workflow and perform forensics. Conclusion: The above case demonstrates the necessity of establishing clear responsibilities for stakeholders involved in the AI deployment. By building robust traceability and transparency in AI systems, organizations can ensure that the outcomes are both understood and accounted for. Ultimately, the Governance Team shall take responsibility for the outcomes and take appropriate measures to build a robust and successful journey.
-
What is trust and why is it crucial in organizational setting: Trust can be defined as a strong belief in the character, capability, or truth of a person or something. In other words, trust is a byproduct of reliable consistent and transparent behavior of someone or something overtime. Trust is one of the essential characteristics of a person within any setting, that determines dependability which influences success. Likewise, gaining trust with the introduction of AI agents within organizations is paramount to its success. Scenario: Let us imagine the Facilities Management (FM) company introduces an AI agent to help its management by analyzing technicians’ performance data and developing performance evaluation reports. The objective is to minimize manual administrative efforts and produce fast and reliable reports. This is a very sensitive area and hence producing a more consistent, accurate, transparent and unbiased report is paramount to gaining trust from the management and technicians that shall determine success of the rollout. Strategies for creating AI agents that inspire trust: Clear understanding of the use case (business requirement) and selecting the appropriate AI application / platform incorporating the following capabilities is a core necessity. 1. Incremental progress Start small by identifying and implementing small portions of evaluation and progress steadily by incrementing scope. This helps to focus and edify the agent to increase accuracy and build trust overtime. 2. Intent clarity During the initial setup, clearly defining the intent of the application using prompt engineering concepts will eliminate ambiguity. This will lead to the agent providing relevant and contextual insights eliminating errors during the initial stages and moving forward. 3. Data reliability Ensure to provide and use quality data to train the AI system and develop. Inclusivity of all possible scenarios will help eliminate bias in the system output. 4. Explainability Develop system capability to be able to clearly explain the inputs, logical steps and the rationale behind the insights. This will help eliminate the black box effect in the AI system. 5. Traceability Establish AI system performance metrics record logs and action steps to understand where and how the system went wrong. Continuous performance monitoring shall help us understand how the system is performing and maturing over time. 6. Accountability Decide and communicate through policies, key responsibilities and accountabilities for the inputs, rules, insights and the ones responsible for the overall system performance. 7. Feedback looping Build capabilities in the system to be able to accept feedback from users, experts and developers for the systems ongoing learning and fine tuning. Effective feedback loops place a significant role in the progressive performance of the AI system. 8. Security All data used to train, develop and deploy the system must be secure and private to avoid the spread of sensitive information. Following and adhering to these strategies shall be beneficial to building trust over the system and for successful deployment and application.
-
Other than an organisations resources, process and other internal factors, there are several macro-economic factors that can have a significant impact on its performance. They must be analysed carefully to understand its impact on the organization’s performance. A tool used to evaluate macro-economic factors related to a certain situation is the PEST analysis. PEST stands for Political, Economic, Social and Technological. PEST analysis is a method of assessing the impact of these four macro-economic factors in an organization in a particular situation in the long-term. This tool is used in alliance with other tools such as SWOT analysis to identify and distinguish the impact of internal and external factors. PEST Analysis Factors: Political – Legal factors and government regulations such as political stability, trade regulations, labour laws, government policies, tax guidelines are evaluated. Economic – Inflation rates, interests, growth plans related to economy, employment etc and its impact on the business are evaluated through this factor. Social – Through this factor, lifestyle changes, educational revolutions, customer demographical statistics, area dependent cultural limitations are assessed. Technological – The positive and negative impact of technology in a business’s product and service based on the global rollout of advanced technologies, digitization, etc are assessed through this factor. Example of PEST Analysis: PEST Analysis of a Hospitability Business (House Renting) P Political E Economic S Social T Technological Threat: · Conflicts between local housing laws and regulations and the business model · Fluctuating tax regulations around the globe · Wars and conflicts in certain countries in which the company operates Threat: · Well established hotel chains recognized the threat the company poses to their market share · Competitors copying the business model very easily · Increase in demand for housing locally with low number of service providers offering housing to travellers Threat: · Lifestyle trends decreased amount of travel · Travellers causing bad publicity and jeopardizing the image of the business or irresponsible behaviour hosts · Media highlighting the internal issues of businesses Opportunity: · Slowdown in the economy causing travellers not to opt for expensive hotel chains to save money Opportunity: · Lifestyle trends increased amount of travel Opportunity: · Increasing amounts of internet access by users to shop for hotels and lodging · Access to IT systems allowing more efficient data collection and extensive market research to address other threats / weaknesses

-
SQDC is acronym for Safety, Quality, Delivery and Cost. SQDC board is a daily process management tool used to provide insights swiftly and visually on how the process is operating based on the 4 vital criteria: Safety, Quality, Delivery and Cost. It is a great tool that facilitates management walk-around reviews (Gemba) at the workplace. The concept was originally developed by the British automobile sector. Generical workplace communication board will have too many charts and information for anyone visiting the place to review and understand the performance against key metrics. The SQDC board with colour coding of actual performance against the targets (Red / Green) gives a quick insight instantaneously. Implementing SQDC board: 1. Define key metrics for each criterion: 2. Display blank SQDC template at the beginning of the defined period: 3. At the end of the day / week / month (as defined), colour the respective template with GREEN (achieved target) or RED (did not achieve target) At the end of the period, the team leader can quickly assess the frequency of problems, and develop actions plans to resolve those issues. In case if the entire template is found to be GREEN consistently, then the metric must be modified to raise the benchmark. Alternatively, if the template is all RED, then it may be possible that the target for that metric is extremely challenging or there could be other issues that need to be addressed.


-
Bowling chart is a fairly simple template used to visually monitor the actual performance against the targets / goals of established key performance indicators (KPI) or policy deployment objectives. However, its application is not limited to only these areas. It appears similar to a bowling scorecard and hence derived its term. The charts limitation is in its inability to show trends. Creating the chart is very easy as the KPI’s / objectives are listed in a column, the timeline (usually a 12-month period) on the row with the targets mentioned. As and when the actual performance is updated, appropriate colour coding (traffic light colours) is used to make it visual. Sample bowling chart: Tracking KPI’s for Policy Deployment using Bowling Chart: Policy deployment a.k.a Hoshin kanri / Hoshing planning is used for organizational goal setting that depends on inputs from everyone across different levels (strategic / tactical / operational) who are involved in achieving those goals. The process has to undergo the following steps: 1. Identify the vision and KPI’s 2. Outline breakthrough objectives (goals) 3. Establish schedules for achieving the goals 4. Initiate and continue the catch ball process to get inputs from different levels 5. Set-up review cycles: This is a very crucial step in the policy deployment process where the progress is reviewed periodically and required course corrections are made. Bowling chart can be a very effective tool to track the progress periodically and highlight problems and opportunities. 6. Take necessary actions 7. Annual review to make adjustments for the next year Benefits of using a Bowling Chart in policy deployment: The benefits of using Bowling Chart in the process of policy deployment within your organization are: · It allows you to identify and focus on the areas in the plan that are underperforming · It enables consistency in the definition of KPIs and metrics · Define frequency of data collection to inform better decision making · Bring different areas of business together as each business owner must manage his / her part in the bowling chart

-
There are many tools that we can use to make critical decisions. Reasoning is one among the several tools that often appears naturally which includes inductive, deductive, and abductive methods. Deductive Reasoning: Deductive reasoning a.k.a deductive logic a.k.a top-down reasoning is a process of arriving at a logical conclusion based on the statements (premise) that are generally assumed to be true. Deductive reasoning Starts with a general rule (a premise) that we know to be true. From that general rule, we make a true conclusion about something specific. In other words, it is a logical reasoning process from known facts to conclusions. Example: All men are mortal. Jim is a man. Therefore, Jim is mortal. Here if the first two statements (premise) are true then the conclusion must be true as well. Inductive Reasoning: Inductive reasoning approach is right the opposite of deductive reasoning. Here generalized information is gathered first from specific scenarios to come to a conclusion. In other words, in this approach, you gather data, and then determine what logical conclusions or theories could be derived from that data. Example: All senior supervisors in my company have university degrees. Therefore, you must have a university degree to become a senior supervisor. Difference between deductive and inductive reasoning: Deductive Reasoning Inductive Reasoning Direction Top-down Bottom-up Premise Specified as facts or general principles (it is warm in the summer in Chennai) Based on observations of specific cases (All crows Jim has seen are black) Conclusion Conclusion is more special than the information the premise provides. Conclusions are reached by applying logical rules to the premises directly. Conclusion is more general than the information provided by the premise. Conclusion is reached by generalizing the information of premises. Validity If the premises are true, the conclusion has to be (MUST) be true. If the premises are true, then the conclusion is probably true. Usage More difficult to use (mainly in logical problems). Requires facts which are definitely true. Used often in everyday life (fast and easy). Evidence is used instead of provided facts. Use of deductive and inductive reasoning in lean six sigma world: Though lean six sigma approach relies on various tools for systematic problem solving, the art of critical / scientific thinking is imperative to its success. Tools cannot by any means substitute reasoning characteristic. Both the methods can be applied effectively in problem solving. The theory of inventive problem solving (TRIZ), enables one to take a logical, structured and systematic approach in evaluating a problem, identifying contradictions and arriving at innovative solutions. Addressing contradictions requires deductive / inductive reasoning. Sometimes, we move from a specific problem to a generic problem which is inductive in nature and from the generic problem to generic solution and return to a specific solution which is deductive in nature.


-
I. Introduction: SWOT analysis is a very simple, yet powerful framework / tool used to evaluate an organizations Strengths, Weakness, Opportunities and Threats. SWOT evaluates, internal / external factors along with current and future potential. This framework was invented by Albert Humphrey a management consultant, in the 1960’s at the Stanford Research Institute. II. SWOT explained: a) Strengths (Internal, Positive): Describes the company’s strengths which separates if from its competition that can be used to maximise the identified opportunities. Examples could be, the brand value, customer base, technology and so on. · Things the company does well · Qualities that separate the company from its competition · Internal resources such as skilled / knowledgeable workforce · Tangible assets like propriety technology, intellectual property etc. b) Weaknesses (Internal, Negative): Any internal factor that prevents an organization from performing at its best which needs improvement to remain competitive. Examples are, bad debt, supply chain issues, lack of funds etc. · Things the organization lacks · Stuff the competitors does better · Limitations on resources · Uncertain USP (unique selling proposition) c) Opportunities (External, Positive): These are external factors that are favourable which could give a competitive advantage. Examples include, tariff cuts, increasing market share, new markets etc. · Underserved markets for certain products · Fewer competition in the area · Emerging need for product / services · Media coverage d) Threats (External, Negative): External factors that have the potential to harm a company. Examples are natural calamities, inflation etc. · Emerging competition · Unstable regulatory policies · Negative media coverage · Changing consumer attitudes III. Steps to conduct a SWOT analysis: IV. A sample SWOT analysis for a restaurant: V. Advantages and Disadvantages of SWOT: Advantages Disadvantages Helps condense large amount of data into manageable chunks Sometimes leads to oversimplification Single tool can describe four critical areas It is not always objective Wide application – can be used by any organization No limits in place (relevance) Simple / low cost Unknown factors may influence outcomes Terms used could be vague, or even meaningless No obligation to verify VI. Application in Business Excellence initiatives: Effective and efficient businesses processes are required for companies to stay competitive. The current digital era is demanding organizations to re-design and improve processes with agility and help achieve the strategic objectives. SWOT analysis framework can be used to understand the AS-IS state by studying the strengths and weaknesses that are internal to any business / process and develop the TO-BE state by developing strategies capitalizing on the opportunities and overcoming threats which are external. When the outcome is combined with other tools, SWOT can help in identifying transactional and transformational improvement projects aligned to goals the organization. SWOT can also help identify the strengths of the people, process, and products relative to the improvement initiative which could be tangible and intangible factors. Likewise, the weakness factors of people, process, and product that prevent from delivering value could be identified. Opportunities can be considered as the targeted improvements which could be internal or external. Threats can be looked upon as the effect or consequences if people, process, or product is not improved.


-
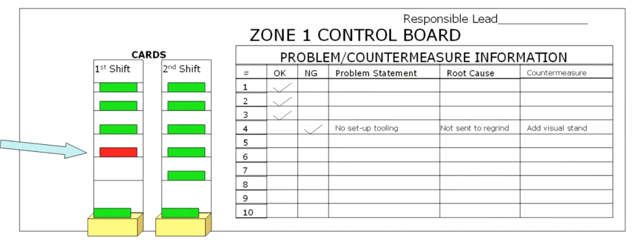
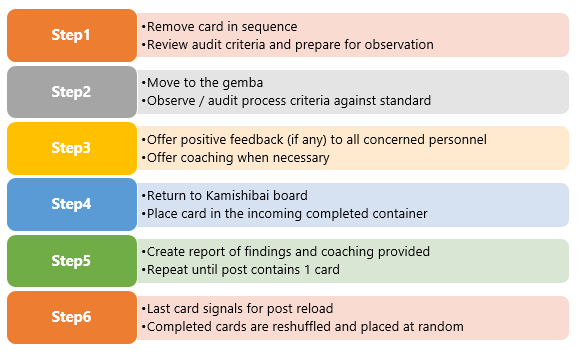
Kamishibai is a Japanese word translated in English as ‘paper drama’. The concept originated in the eighth century in Japan when Buddhist monks used ‘picture scrolls’ for describing the history of earlier monasteries. This popularised in 1930’s post-war as a form of storytelling using picture scrolls to convey stories with moral lessons to the audience where most of them were illiterates. Kamishibai Board in Lean Manufacturing: Toyota capitalised on the concept of “Kamishibai”, customised it to put to use as a visual control board detailing process audit schedule and parameters to perform periodical audits within their manufacturing process primarily to ensure safety, cleanliness of workplace (5S) and quality checks compliance. The concept was integrated to the Toyota Production system. This visual control method helped to ensure that audits are performed consistently. Generally, the kamishibai boards are placed close to the workplace in the vicinity of the process under the scope of audit. Visual indicators (Red / Green colours) provide the status of the audit, whether they are complete / incomplete and also if there are any violations to the standard work. Kamishibai board collaborates well with the “genchi gembutsu” principle to make the gemba walks structured and effective defining strong visual controls and clear standards. Kamishibai standardises the process of audit itself to reduce variability in the outcomes of the audits done by different people. The audit cards specify details of 5W+1H (who, what, where, when, why & how) to reduce variability in the audit process. Key Objectives: Here are few key objectives the Kamashibai board concept aims for. · Establish standard audit method to detect variations against a known standard · Shared responsibility and commitment · Expose abnormalities / variations against the set standards · Prompt timely correction of root cause(s) of the abnormality · Create a healthy environment to challenge the current conditions · Create an environment of continuous improvement Components of the Kamahibai board: 1. Flip over cards – one side red and other side green colour with same instructions 2. Standard work instructions – Instructions to perform the audit at the prescribed location (5W+1H) including criteria developed from known standard conditions 3. Standard schedule – a schedule containing a balanced (WHO conducts audit, WHEN is the audit done and WHERE should be the audit done) shared responsibility and commitment. 4. Output of audit – visual record of findings, root cause and counter measures. 5. Incoming completed – a box to collect all completed incoming audit cards. Steps followed: Kamishibai boards in service industry: Audit requirements prevail commonly even in service industries and hence the kamishibai board / method can be applied effectively. An interesting example of using the kamishibai cards in services was found at MU Health Care, USA. One of the units at MU health care, uses this concept to do a safety audit on one high risk patient every shift. Learning about this initiative, the oncology department uses this concept to identify and remove obstacles causing patients to fall. The team came up with an acronym TUMBLES which stands for Toilet, Urine, Medication, Beds, Linens, Exercise Equipment and Shoes to describe the risk factors and created audit checklists focussing on them. The audit was carried out following the steps which eventually led to a 50% reduction in the fall rate. This program was so successful that other units started adopting the concept to put them to use focussing on specific goals.


-
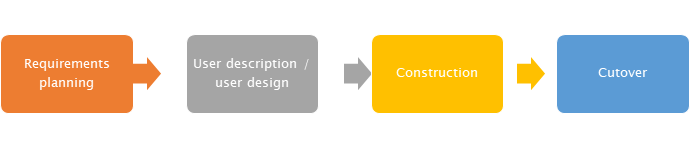
Rapid application development abbreviated as RAD, is an agile software development methodology popularly followed in software development. This model was originally conceived in the 1980’s. A significant benefit of using this methodology is to get a faster project turnaround which makes it an appealing choice for companies and software developers working in a fast-paced environment. Typically, any software development project that can be divided into small modules, and which can be assigned to different developers from different teams can be developed using the RAD model. At the high level, RAD model contains 4 distinct phases namely; I. Requirements planning: Generically software development starts with a detailed planning phase spending a large amount of time with the users. However, RAD starts by defining a very brief set of requirements, as the methodology allows any change in the requirements during any stage in the development cycle. II. User description / user design: This is the important phase that sets RAD methodology apart from other methods where, the product is built through several prototype iterations. During this phase the developers work very closely with the clients to ensure that their requirements are incorporated into the product being developed and the expectations are met. The developer develops the prototype, the client tests it and both the parties get together to discuss what worked and what did not repeatedly until all or most issues are resolved, and requirements met. III. Construction: In this phase, the prototype or the beta model is converted into a full-scale working model. As a vast majority of the problems and requirements were addressed during the previous phase, the construction of the product can be quicker. Typically, in this phase, construction preparation, application development, coding and integration & testing activities are done. Even at this phase, clients can suggest changes and modifications or even new ideas to resolve problems. IV. Cutover: In this phase, the finished and finalized product is launched which includes data conversion, testing and switching over to the new system. Even during this phase, developers and clients work hand-on-hand to continue to identify and address problems. Reasons for laying emphasis on prototyping than planning: The prime reason why the RAD approach lays emphasis on prototyping than planning is to accelerate the process of system development. It also allows enhanced flexibility to make any adjustment as required by the clients during any stage of the development process. Prototyping also provides the ability to explore and understand the concepts more quickly. Most importantly it has a huge impact on cost. This table briefs the advantages and disadvantages of the RAD methodology: Advantages Disadvantages Overall cost of project is amazingly less as lesser number of developers are required Involvement of the client during the entire development life cycle is mandatory Customer feedback is prevalent during all the crucial stages Managing the project is a bit more complex compared to other development models It becomes easier to accommodate changes during any stage of the development due to the shorter iterations of prototyping Projects that cannot be broken down to modules cannot be developed using this approach Progress of product development is easy to gauge through different stages May not be suitable for small-scale projects due to the deployment of powerful automated tools and techniques which turns out to be costly Usage of reusable components significantly reduces the total development time of software projects Team leaders must coordinate more closely with both the developers and clients to meet deadlines Better product quality is achieved due to the usage of powerful development tools Usage of powerful tools necessitates involvement of highly skilled professionals Is this approach suitable outside software development sector? Yes, this approach is suitable and can be used widely in various sectors other than software development. This approach can be used in scenarios when a project needs to be done quickly. Upon research we find that the application of RAD approach has been successful and beneficial in the Banking, Financial Services and Insurance (BFSI), Automobile and Online Retail industries. With the growth in technology and usage of internet, there is a huge increase in customers opting for mobile banking platforms for financial transactions. With such a demand, BFSI institutions must move onto the mobile space to keep up with the demand. In order to meet this expectation from clients, a lot of solutions are developed and provided using the RAD approach. The rapid prototyping a derivative of RAD is widely used in the automobile industry in developing physical prototypes and scaled models for their designs. Thanks to the 3D printing technology that makes the process efficient and effective for developing the prototypes at the required pace. These prototypes are subject to various experiments to identify issues / flaws and discover areas of improvement prior to commercial production. Online retailing was getting popular even before the pandemic and has significantly grown and will grow in the future. In 2018, it was found that around 40% of the e-commerce transactions were using mobile devices. This has grown upto 54% in 2021 which describes the growing demand and requirement of mobile e-commerce applications. With the application of the RAD approach, retailers can develop and put to use simple, secure mobile applications in the shortest possible time to meet the demand.


-
Prior to comparing RAPID and DACI matrices with RACI matrix, let us briefly understand what an RACI matrix is. RACI is a short form for Responsible, Accountable, Consulted and Informed. It is a tool quiet extensively used in project management to define individuals’ roles and responsibilities in the execution of projects while removing ambiguities and provides clarity to all stakeholders. This topic is discussed in detail in the “benchmark six sigma forum” and can be accessed using this link. What is RAPID matrix? RAPID is short for Recommend, Agree, Perform, Input and Decide. It is yet another tool used in project management. While RACI matrix is used to define high level roles and responsibilities, RAPID matrix is used to define more lower-level project planning and decision-making responsibilities. RAPID matrix example What is DACI matrix? A DACI matrix, expanded as Driver, Approver, Contributor and Informed is also a tool used in project management to define / identify key roles and responsibilities for making group decisions for every major task within a project. DACI matrix example Comparison between RACI, RAPID and DACI matrices: Matrix RACI RAPID DACI Expanded as Responsible, Accountable, Consulted, Informed Recommend, Agree, Perform, Input, Decide Driver, Approver, Contributor, Informer Year 1970 After 1980 1980 Founders Kristoffer Grude, Tor Haug and Erling Andersen Bain & Company Intuit Application Tool used to clarify & define roles & responsibilities to people within a project / team. Tool used to agree and assign decision making roles and accountabilities. A variant of RACI used to assign roles to personnel who drive projects to conclusion. Merits þ Well known and used throughout organizations þ Once you assign the ‘A’ person, leave it to the team to make it work þ Preferred by 3rd party companies (e.g. consulting companies) as it has a specific person (A role) to deal with þ Enforce a recommendation or a decision, which is typically the blocker þ Role allocation is clear to manage the activities from beginning to end (entire lifecycle) þ Preferred by teams that want to get things done þ Eliminates ambiguities by giving full authority over definite aspects of decision making to a specific person þ Representing every aspect of decision-making with a specific role þ Removes collective responsibility and corrects team imbalance by giving authority to a single person / role þ Eliminate probable disagreements and speeds up decision-making Demerits ý Everything is dependent on ‘A’ role ý No strong focus on teamwork ý Confusion may arise between Consult / Inform roles & Responsible / Accountable roles ý May lead to shortcut and not well-thought through options ý Not easy to implement as everything is not just link to one person ý Trademark limits use due to legal concerns ý Model only works if the rest of the team members are prepared to accept the decision made by the approver


-
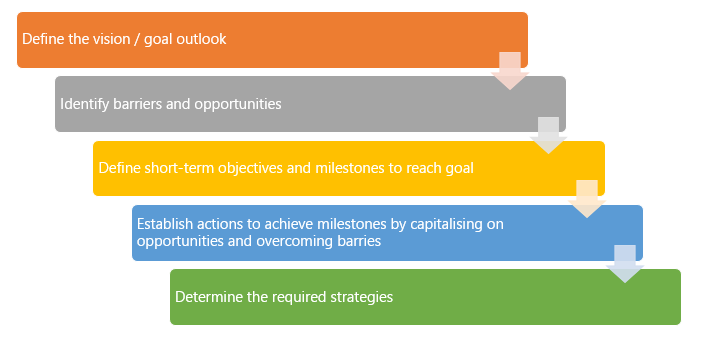
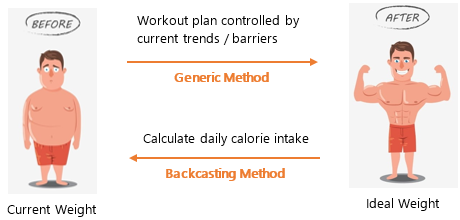
I. Definition: Backcasting is a strategic planning method that defines an ideal future state or goal and working backwards to identify the policies and strategies connecting them to the current state that helps identify and arrive at the required actions to get to the future state. This method was developed in 1990, by John B Robinson at the University of Waterloo, Canada. The available forecasting methods involves prediction of the future based on earlier / current performances and trends, where Backcasting works in the opposite direction which helps envision the future and lay down appropriate action to get there when there is unpredictability or uncertainty in current trends. A good visual differentiation between forecasting and Backcasting is given below. II. Application: Backcasting method was originally introduced in the energy industry and is now widely used in the areas including, urban planning, climate reconstruction, statistical analysis and problem solving. III. Steps involved in Backcasting process: 1. Define the vision: This is the foremost and a crucial step where the end goal or the vision is defined. The time period taken into consideration could range from 5 to 20 years. 2. Identify barriers and opportunities: All the opportunities that we have now and will have in the future along with the potential barriers that would hinder achieving the end results are discussed in detail and listed. 3. Define milestones: The bigger goal is broken down into several short-term objectives and the key milestones completed each of the objectives are flagged. 4. Establish actions: Develop detailed robust actions to achieve the short-term milestones. This shall include actions that effectively uses the opportunities or capitalises on them and actions required to overcome the barriers that prevent from achieving the short-term milestones and thereby the goal. 5. Define strategies: This is the final step, where strategies are developed to implement the required actions that were defined in the earlier stage. IV. Backcasting in problem solving: Backcasting principle and steps can be applied in problem solving by first defining a required outcome / output for a product or from a process and working backwards in identifying the appropriate actions / processes / variables that shall facilitate achieving the desired outcome. Backcasting helps in predicting the unknown setting of the causes, to explain the known values of the effect. In other words, Backcasting helps identifying the optimal setting of input variables in order to achieve a desired value of an output variable. A classic example differentiating generic problem-solving approach vs problem solving using Backcasting method is shown below;

-
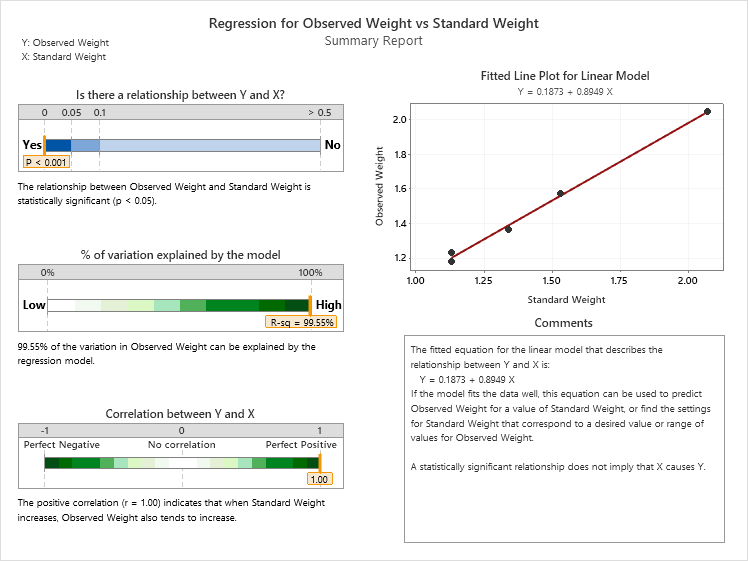
There seem to be a good correlation between your standard weight and actual observations. So in the interim you could use the regression equation to arrive at the correct weight. However in the long run, take multiple readings with the same standard weight, compute the mean and standard deviation and if the standard deviation is high, calibrate your weigh scale. Also establish a periodical weigh scale testing / calibration schedule to avoid dispatching excess due to the weigh scale error and losing out revenues.
-
Hello, In my humble opinion I would recommend to start with a pilot lean project (maybe you could start with 5S) in an area, showcase the results, gain momentum from all levels and then roll out your lean transformation plan throughout your organization. But remember as a MBB it is imperative to identify and execute projects delivering high business value. Good luck with your implementation.
-
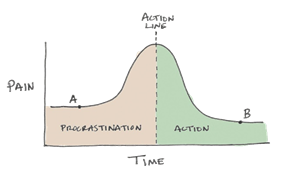
What is Parkinson’s Law? In 1955, Cyril Northcote Parkinson, a British historian and author, mentioned in an essay that “work expands so as to fill the time available for its completion”. He called this theory Parkinson’s Law. Over the years, his theory has become a success in business theory regarding the organisation of work tasks. Why does this happen and what are its impact? According to Parkinson’s Law, instead of working efficiently to do more in less time, we lengthen the process which is a natural tendency of human beings. This makes us delay our work and noticeably our productivity tumbles. Though you know the amount of time set for a task to be completed, you tend to leave it to the very last minute. This is called procrastination which is a key player in Parkinson’s Law. While you allocate too much time for a task, you tend to waste all the precious time that could have been productively used in other areas. The extra time allocated and spent doesn’t necessarily reflect in the outcome of the work as well Majority of people will get tensed and stressed out before they really get around doing the work and will disguise of working well under pressure. How to overcome and improve productivity? Combating Parkinson’s Law is not something that can happen without cautious efforts. A good starting point would be to start assuming that a task or work doesn’t have to be completed by necessarily consuming all of the allocated duration. Generically tested and applied productivity and time-management principles could be adopted to optimize time. Here are some steps that you need to follow to implement it in your work life. a) Use a time-blocking technique: This is about assigning specific blocks of time to each activity. This technique forces us to allocate specific time for each of the scheduled tasks to avoid interruptions and distractions while doing the task. For example, you may set allocate 45 minutes to prepare an analysis report, 5 minutes to review and reply to emails, another 45 minutes to continue with the report, 10 minutes coffee break and so on. This will help stay focussed on the specific tasks and avoid any procrastination. Apply the two-minute rule: This is a basic rule of the Getting Things Done (GTD) method, developed by productivity consultant David Allen. It works on the principle that any task we can perform in less than two minutes should be completed immediately, rather than rescheduling or postponing. The duration a) may vary depending on context, however the principle remains same: do what you can do right away and avoid postponing it. For example, replying to an email, forwarding an available record to a colleague and so on. b) Follow the Pareto principle: Often referred to as the 80/20 rule, this principle states that 80% of the results come from 20% of the effort applied to a task or project. This means that a majority of our tasks have less impact on the end result, whereas the most important result is produced in a shorter timeframe. The challenge here is to identify those tasks that are most important and the assigned them to the 20% so as to ensure to achieve the result in the shortest possible time. c) Create your own method: All the techniques above propose generic approaches, however you may tailor a method specifically to meet your challenges and limitations. Applying any of the renowned time-management techniques, you may create a method that seamlessly fits your daily activity and your requirements. For example, if you are finding it hard to overcome distractions, create suitable strategies and routines to overcome. Similarly if you tend to procrastinate, develop a system with realistic time blocking for tasks and ensure sticking to it.

-
-
-
In a cold rolling mill, a sample is taken for inspection at a frequency of one in 10 coils. This frequency was not arrived at scientifically (i.e without any logic). On an average 152 coils are rolled in a 24 hours shift. This sampling frequency eats up on the production capacity. On a typical day the rolling schedule contains a wide variety of SKU's (alloy, width, gauge, temper etc) depending on the delivery priorities. Historical data pertaining to the defects identified on the samples are available. How do we arrive at an optimum sampling frequency based on historical data?

