

Ronaaq
Members
-
Joined
-
Last visited
Everything posted by Ronaaq
-
Correlation gives a relationship between two variables. It gives relationship between input X and output Y. It gives a good graphical representation of how the two variables are related. But one cannot determine whether Input X is the cause of output Y. it can be the case that both the variables are X, or both the variables are Y. As an example, Crime rate is increased in Ahmedabad VS Ice cream sales has decreased. There can be good correlation between both the events but, the real root cause can be something different. In Ahmedabad, weather is pleasant in winter, so in winter the criminals become more active and hence crime rate increases while on the other hand since it is cold people prefer hot drinks rather than ice cream. So ice cream sales have decreased. This is a major drawback of correlation. Knowing this most of the people use this analysis. Because it acts as a good start, we can filter out many inputs from the analysis which does not show a relationship with the output Y. This can save a lot of time. Further we can work on root cause analysis , based on the correlation study. We can know which parameter is having how much impact on the output.
-
VOC:- Voice of customer. VOC is the customer’s expectation/needs from a particular product/process. Customers can be internal/external. Case study:- Product:- ABC of 1 Kg pack size VOC:- Customer specification:- 1. Nett weight:- 1 Kg +/- 10%. USL :- 1100gms LSL:- 900 gm 2. Piece weight 20 gms( +/- 2gms). 3. Piece count:- 47 to 53 in 1KG. It was observed that we were processing, such that each piece weight came about 18 gms. So customer was getting 56 pieces in each bag. We were within limits of VOC. Our internal customer said that we are running at a piece weight of 18 gms which is our LSL, so it should be increased. After completion of project, weight of each piece was maintained at 20 gms, and in each pack of 1 kg we were getting 50 pieces. Product was completely under specification. But we started getting complains, because the piece count decreased from 56 to 50. Customer was getting 6 pieces of product less in each pack. Customer was not happy to see this change, though we were following the specification given by customer. Thus overemphasis on VOC might cost our business in some cases.
-
There are various types of process mapping, but we can categorize them in mainly 5 groups. 1. SIPOC 2. High Level Process Map/Flow chart 3. Detailed process Map 4. Swim Lane Map 5. Value steam Mapping SIPOC:- SIPOC stands for Supplier – Inputs – Process – Outputs – Customer · The required inputs (and their providers) are listed to the left, and the key process outputs (and their recipients) are listed to the right. The SIPOC provides a focus for discussion of what the process is all about. · With SIPOC we will be able to know who supplies to process, what is the output of the process? What are requirements of a customer? · It is recommended to have a SIPOC for every project because they are helpful when discussing the process with others and simple to make. High Level Process Maps/High level Flow chart:- It provides an overview of the processes and objectives that drive an organization. The purpose is to provide quick and easy insights into what the process does, without getting into the details of how it’s done. Detailed Process Map/ Detailed Flow chart:- While studying the high level process map, if we want to get more detail of a particular process. We may need to make a details process map for that process. Swim lane Map:- Swim lanes is a technique used in process mapping to simplify the work procedure. The process is divided into several swim lanes. These are represented by the different people that will perform that job. Detailed process maps are often prepared in the swim lane format. This is because often there are multiple detailed process maps. Keeping track of who is supposed to do what may get confusing. Swim lanes help to simplify them. Value Stream Map:- VSMs are typically used in Lean applications. They are rich with information that is useful when planning process improvements. Value Stream Maps are sometimes called Material and Information Flow Diagrams. With value stream map we can see how material is moving from one process to another and how information is flowing. We can also see WIPs and its level. We can get relevant process details such as cycle time, change over time,etc. What is the wait time for information/product can also be gathered from a value stream map. They require more skill to build than simpler process maps, but they provide great information. Below is the summary of various process maps. Process Mapping When It is used SIPOC to get overview of what are inputs/outputs, what are customers’ requirements High level process Map Shows how the process works Detailed process Map To get deep understanding of the process Swim Lane Maps It shows which department is is involved with how much intensity in that process Value stream mapping It is the ultimate process map, which gives all the relevant detail about the process. For me Value stream mapping is the best template to do a process mapping. Now for an organization which is new to these tools, or for an organization which I am not aware of I will follow below sequence of process mapping.


-
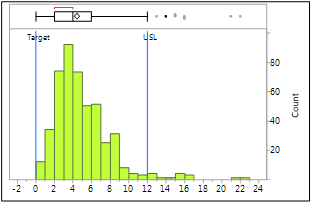
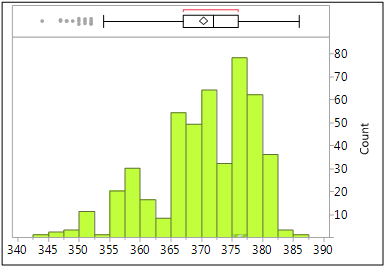
Continuous data is measured and attribute data is counted. There are some cases when we actually count our measurement, but for analysis purpose those data are considered continuous. Below are some examples. Example1:- In a 3 Kg packet of French Fry, we measure count per Kg. which is an attribute data as it is counted. But if we want to check what is the mean and median of count in a 3 Kg pack, we need to consider the same data as continuous. Short text for inspection object Count Per Kg Fries 3 Kg 374.000 Fries 3 Kg 372.000 Fries 3 Kg 376.000 Fries 3 Kg 379.000 Fries 3 Kg 372.000 Fries 3 Kg 372.000 Fries 3 Kg 375.000 Fries 3 Kg 358.000 Fries 3 Kg 369.000 Fries 3 Kg 368.000 Fries 3 Kg 367.000 Count Per Kg Quantiles 100.0% maximum 386 99.5% 383 97.5% 382 90.0% 379 75.0% quartile 376 50.0% median 372 25.0% quartile 367 10.0% 358 2.5% 351 0.5% 347 0.0% minimum 344 Summary Statistics Mean 370.38577 Std Dev 8.0232368 Std Err Mean 0.3696912 Upper 95% Mean 371.11223 Lower 95% Mean 369.65932 N 471 Sum 174451.7 Variance 64.372329 CV 2.1661838 N Missing 476 Example 2:- Similar to above example, for a sample of 1 Kg, we measure critical and major defects. Which again is an attribute data, but for analysis they are considered continuous data. Short text for inspection object Critical + Major + Minor Defects Fries 3 Kg 10.000 Fries 3 Kg 5.000 Fries 3 Kg 8.000 Fries 3 Kg 15.000 Fries 3 Kg 13.000 Fries 3 Kg 14.000 Fries 3 Kg 8.000 Fries 3 Kg 10.000 Fries 3 Kg 2.000 Fries 3 Kg 10.000 Fries 3 Kg 14.000 Fries 3 Kg 9.000 Fries 3 Kg 9.000 Fries 3 Kg 11.000 Fries 3 Kg 10.000 Fries 3 Kg 11.000 Fries 3 Kg 7.000 Fries 3 Kg 8.000 Fries 3 Kg 8.000 Fries 3 Kg 7.000 Distributions Critical + Major Other Quantiles 100.0% maximum 22 99.5% 19.175 97.5% 12.175 90.0% 8 75.0% quartile 6 50.0% median 4 25.0% quartile 2 10.0% 2 2.5% 0 0.5% 0 0.0% minimum 0 Summary Statistics Mean 4.4491525 Std Dev 2.9942548 Std Err Mean 0.1378217 Upper 95% Mean 4.7199741 Lower 95% Mean 4.178331 N 472 Sum 2100 Variance 8.9655619 CV 67.299442 N Missing 475 There are many such data in real life in which measurement is done in counts, but for analysis they need to be considered continuous data. In Summary, it depends a lot on what analysis you want to have for a particular data set. And we should have understanding of what affect a tool will have , if the data are considered continuous or attribute during the analysis.
-
Sr.no. Correction Corrective Action Preventive action 1 Correction is an action taken to eliminate a detected nonconformity/problem Action to eliminate the cause of a detected nonconformity/problem. Action to eliminate the cause of a potential nonconformity/Problem 2 Correction addresses the short-term need and gets immediate attention. Corrective action is a long-term solution. Preventive action is a Futuristic solution. 3 It is a fire fighting process. Corrective action is a reactive process and it is performed to bring the deviation under control Preventive action is a proactive process 4 For corrections problem has already occurred. For corrective action problem has already occurred. For Preventive Action a problem has not yet occurred 5 Root cause analysis, 5 Whys’s, Ishikawa diagram Failure Mode Effect Analysis (FMEA) or risk management, Fault Tree Analysis. Example:- In this Diwali vacation, you have planned to visit you parents. You are on the way with your wife in your new car. Suddenly you one of your tire is punctured. Now you need to change the tire in your new Diwali clothes. But when you open your trunk you get even bigger surprise that there is no spare tire. Now for above example your correction, Corrective action and preventive action will be as follows. Correction:- Call for help from nearby place and get your tire repaired. Corrective action:- To keep an extra spare tire in your trunk. This will help us when similar problem is repeated. Preventive action:- Before using the car, we should check the basic requirement to run the car. Like, Fuel, tire pressure, spare tire, water level, etc. This is to prevent other possible problem that can come in a car. I think the question about a situation where correction is only desired solution, is a googly. Because I don’t think there is any situation/problem, where you will neglect corrective actions/ preventive actions
-
Considering BPM and its various tools are implemented properly, I think check sheets will be removed from the system. But for education of quality it should not be ignored completely, because we must have our basics correct. People should understand how those data are coming from BPM tools.
-
When to go for Push system 1. Push system should be applied to seasonal products where the company can have a small daily capacity but through proper planning and forecasting could ship very large quantities when their product is in high demand. If we apply pull strategies to seasonal products, we can run out of capacity when the demand for that product is high. Other option is to increase manufacturing capacity, but most of the time in off seasons you will not utilize full capacity. 2. Products with small demand uncertainty, as the forecast will provide a good indication of what to produce and keep in inventory. Eventually resulting in lesser lead times. When forecasting is very close to the demand graph, having a push system reduced the lead time drastically. 3. Products with high importance of economies of scale in reducing costs. Some products cost very less when produced in bulk, instead of small frequent orders. 4. When your products are exported, it is better to deal with push system. If we go for pull system, there will be way too many jets and vessels to be booked for transporting your products. 5. When customer is not aware about the products. Example of push marketing can be seen in department stores that sell fragrance lines. The manufacturing brand of the fragrance will often offer sales incentives to the department stores for pushing its products onto customers. This tactic can be especially beneficial for new brands that aren't well-established or for new lines within a given brand that need additional promotion. After all, for many consumers, being introduced to the fragrance at the store is their first experience with the product, and they wouldn't know to ask for it if they didn't know it existed. 6. Push system can be used when the brand loyalty is low. Push system can help in increasing the loyalty, by shifting money used in advertisements and endorsements to improving products and resource allocations. Overall no company will survive solely on Push or pull system, there has to be hybrid of both the systems. Percentage importance of both the system varies from industry to industries.
-
A false alarm:- Rejecting a good product. As the no. of false alarm increases rework/rejection increases. So it’s a producer’s risk. Most of the producers will be keen on reducing false alarms. It can also be referred as Type 1 error. Missed alert:- Accepting a rejected product. When a bad product is accepted and reaches customer/consumer. It is consumer’s risk. It can also be referred as type 2 error. Which error to be preferred over other depends on the criticality of the product/parameter that is in consideration? In food industry:- there are many parameters that are checked. One of the main parameter is addition of allergen/non allergen ingredients. In this parameter, missed alert will have more impact. As if an allergen product is consumed by a person, it can lead to his death also. Taking one more parameter:- Color of product. If we were not able to produce the product as per target color, and it is off by just a bit. In this case more emphasis is to be given on false alarms. As too many false alarms will lead to rework/rejection.
-
FTA:- Fault tree analysis A technique by which many events that interacts to produce other events can be related using simple logical relationship. FTA is a technique generally used in reliability and safety analysis. Bell Telephone Laboratories developed the concept in 1962 for the US Air Force for use with the Minuteman system. It was later adopted and extensively applied by the Boeing Company. Fault tree analysis is one of many symbolic "analytical logic techniques" found in operations research and in system reliability. FTA is a Top down approach Fault tree diagrams represent the logical relationship between sub-system and component failures and how they combine to cause system failures. The TOP event of a fault tree represents a system event of interest and is connected by logical gates to component failures known as basic events. Limitation:- 1. Difficult to conceive all possible scenarios leading to the top of event 2. Making an FTA for large system can be tedious, as we will require a separate fault tree for each top event. 3. Fault trees developed by different users are generally different in structure. Which leads to confusion 4. Same event may occur in different part of tree, leading to some confusion. 5. Correlation between basic events are difficult to model and exact solution to correlated event does not exist 6. Subjective decisions regarding the level of details and completeness are often necessary. 7. Can be costly in time & effort
-
Yes, these 3 questions are sufficient enough to find the value added activities in any industry/process/situation. But at the same time definition of Non-value added activities change. There can be many activities that does not fulfill the three question to be value added but are important for business. Those activities are categorized as NVA but required. There are different names for those NVA , like Business NVA, Supportive NVA, Essential NVA Some examples Inline inspection in any process Preparing some reports Maintaining employees data etc. If we put them under VA activities, than we will be limiting our scope for improvement. People will always think that they are VA so we should not change them All this BNVA, SNVA, ENVA can be reduced or eliminated over the period of time when we change the process or machine. An example of withdrawing money from a bank Few years back, the process of withdrawing money from a bank took about 3-4 hours depending upon the bank and which day you went to bank. 1. Drive to bank àSNVA (15 minutes) 2. Wait in line à NVA (15 minutes) 3. Complete transactionà VA (2 minutes) 4. Banker count the cash à SNVA ( 2minutes) 5. Banker again count the cash àNVA ( 2 minutes) 6. You count the cash àNVA (2 minutes) 7. Drive Home à NVA (15 minutes) Note:- Time taken here are bare minimum. Out of the total of 53 minutes, only 2 minutes are value added, rest of the activities are either Supportive NVA or NVA. Nowadays, with ATM available at every corner of a street, we can withdraw cash in about half an hour. Total time is reduced to 34 minutes. Which gives a saving of 19 minutes. Still, there are some SNVA and NVA in this process. 1. Drive to ATM à SNVA 15 minutes 2. Withdraw cash àVA 2 minutes 3. Count the notes à NVA 2 minutes 4. Drive to HomeàSNVA 15 minutes With online net banking, we can do the transaction sitting at home which further reduced the NVA and SNVA. Thus, in my opinion, those activities for which we have a doubt that they are VA or not they should be categorized as SNVA (Supportive NVA), so that in longer run we can improve upon those.
-
Definitely it does help when we implement 5S outside manufacturing. Steps Meaning/ Tag line How it is useful in outside manufacturing/monetary gain. Sorting Removing unwanted things from a work place “IF IN DOUBT MOVE IT OUT” In an office, too much time is wasted on finding the file that you have been working on. When you search that file in your PC, you will find so many files/folders 80% of those files are of no use. So use the tag line “If in doubt move it out” There will be a lot of time saved by doing this. If we convert a person’s salary into INR/minute. We measure time saved by sorting we can easily calculate the savings due to 1st step of 5S. Taking an average salary of 50,000 INR /month, with 25 working days and a day of 8 hours. We get about 4 INR/minute. Now if a person waste about 30-40 minutes in a day searching for different files, we can save about 3000 INR/day. Set In Order Keeping things near the workplace based on it’s frequency of use “A PLACE FOR EVERYTHING AND EVERYTHING IN ITS PLACE…..” For this step lets take an example of Operation theater in a Hospital. If 5S is not implemented in an operation there, and after a day or two doctors find that one of his Forceps is missing. What will you think about it? J Imagine doctor giving a call to every patient that had undergone operation asking them to get their checkup done immediately to find the missing Forceps. Now in this situation, if a person dies, wecant calculate cost. But if another operation is to be done to get the forceps back than it will cost minimum of 0.5 Mn INR. Shine Keeping the workplace clean “SEE IT CLEAN IT…” For this step let us take an example of a restaurant. If we don’t keep our workplace clean, customers will question the Hygiene of the restaurant and never come back again. In office, Standardize A checklist is to be prepared to keep the first 3S from falling back “WHERE IS THE STANDARD…” Think of Aeroplanes, if we have not implemented 5S in Aeroplanes, not defined minimum fule requirement, it will be stuck in middle of air without any fuel. If there are no standards on how first 3 s will be done in an Aeroplace. There will be so much dissatisfaction in customers, and everyday you might get news about accidents/incidents of Planes in Newspaper Sustain Create a 5S culture by cross functional audits of that area, so that first 4 s does not fall back “ CREATE A 5S CULTURE” Overall I would say that 5S does benefit if implemented outside the manufacturing industry. Cost implications can also be calculated as shown by various examples.
-
Innovation requires creative thinking; it also requires some data collection on which you make your decision. Lean Six Sigma is a process of finding solution/ideas based on detailed data analysis. Lean Six Sigma never stops innovation/creative thinking. Innovation is more of skill based process and Lean Six Sigma is Knowledge based process. When we have people with good skills in a Lean six sigma project we will come up with an innovative idea. It all depends on team members and the facilitator/team leader. Several Six Sigma tools including the Cause and Effect diagram and the Failure Mode and Effects Analysis (FMEA) promote innovative thinking and team brainstorming. An efficient facilitator paired with a varied and creative team makes the ideal setting for new thoughts to materialize when searching for possible root causes or when determining probable solutions. If we involve Six Sigma methodology in innovation, chances of getting success increases. At the end I would like to Quote “FAILING TO PLAN IS PLANNING TO FAIL”
-
Methodology English translation/ Other name Description People involved/ where it is initiated Loss if a company does not utilize this methodology Kaizen 1. Improvement for better 2. Continual Improvement 1. Small incremental changes to eliminate 8 wastes in process. 2. Target is to eliminate non value added activities from process. 3. It does not require capital 1. Ideas are generally initiated by shop floor people and implemented by cross functional team of shop floor people. 1. When process/machines becomes old , due to wear and tear of machines, variation in the process increases and it's efficiency goes down kaizens helps in improving efficiency. 2. Also as the cost of raw material increases. and we keep on making with the product at same price/process , company will lose their profit margin. 3. If we don't implement kaizens. we can lose a good culture of people involvement in creative problem solving. keeping shop floor people busy in improving is very important, because if we don't do that brains will become idle and ideal mind is devil's workshop Kaikaku 1. Reform 2. Radical Change 1. In Kaikaku target is do a radical change. 2. Generally these radical changes are done in a short period of time. 3. Most of the time implementing these changes requires capital. 1. Kaikaku is generally initiated by external factors. 2. When the improvements from kaizens are no longer giving benefits compared to efforts required. 3. Generally Managers implement KaiKaku 1. There are many competitors in market; sometimes to be able stand strong against those competitors, need arises to drastically change our process. otherwise we may lose market share Kakushin 1. Innovation 2.Radical Innovation 1. Kakushin deals with innovation in product, services. 2. This initiatives need substantial amount of resources in terms of capital and manpower. 3. Main target is to developed a new product or service which is very different from their current product or service. 4. Mainly it is Futuristic approach 1. Kakushin is initiated by external factors 2. Also based on companies topline strategies. Of how they want to grow in which market 3. Generally management implements this 1. Each product has a life cycle, if we don't initiate innovating something than eventually our product will die. 2. Also to grab the potential market for a product/ service which does not exist we need to adopt kakushin.
-
Peter Drucker " If you can't measure it, you can't manage it" 1. You have a meeting tomorrow. 2. You have a meeting tomorrow at 3:00 PM at ABC Company located at XYZ location. Looking at above two statements, one will feel more comfortable to attend the meeting based on statement no.2. What peter Drucket meant was same thing, you can’t know whether you are heading the right path unless you have target. That target should be tracked and measured at regular intervals for gap analysis. Without firm objectives/target you are always reliant on your gut feeling . Measuring data helps in making decision with confidence. It helps in continual improvement, setting new targets each time. Dr. W. Edward Deming 1. “It is wrong to suppose that if you can't measure it, you can't manage it. The most important numbers are unknown and unknowable” - Dr. W. Edward Deming Before I discuss about this quote, let us see another quote from Dr W.Edward Deming. 2. “In God we trust; all others bring data.” Both these quotes are from Dr. Deming. And it looks like both are contradictory. It is very important to know in what context Dr Deming quoted “It is wrong to suppose that if you can't measure it, you can't manage it. The most important numbers are unknown and unknowable” - Dr. W. Edward Deming There are certain things in industries that cannot be measured, all those tangible things like Companies brand value What benefits you will get if an employee goes for training How much savings can be done if we implement 5S at our workplace Benefits of a visual management process How much did a customer like your product? Benefits of letting employees play games/ have a nap during their lunch hour Qualitative experience of an employee. Dr. Deming was never against gathering data and making improvements based on that data. Though we don’t know how to measure some things, a Manager has to manage those activities also. Managers can measure factors affecting that thing. If that factor was not impacting we can always change our metrics and measure something else that gives proper reflection. For small improvements, it is not advisable to waste time in measuring and collecting data. Sometimes gathering data becomes more expensive than actual benefit that we get from it. In summary, we should be able to measure data and create a culture of decision making based on data. This will help us in creating benchmark year on year and lead to continual improvement.
-
Personal Excellence:- As the name suggest it refers to personal, increasing his/her efficiency, effectiveness. Process excellence:- this deals with increasing efficiency/effectiveness of a particular process. A process has achieved excellence when it is able to give consistent right quality output. Operational excellence:- this deals with increasing efficiency in complete operation, it includes process excellence, but some other factors such as service departments also play a big role in achieving operational excellence. Business excellence:- Business excellence includes Operational excellence along with Companies policies, their strategies toward environment/society. What is their perception about their competitors/customers. An Organization can achieve business excellence only if their strategies are correct. Analogy:- Comparing with Human Health Business Excellence:- Our goal is to keep oneself healty/fit. Operational excellence:- there are many operations done in our body, like breathing, blood circulation, digestion, etc. taking an example of blood circulation. If operation of circulating blood to and fro from heart is performing correctly it is considered operational excellence. Process excellence:- process done by heart of pumping blood to varies arteries. If this process is working efficiently it has achieved process excellence Personal excellence:-the amount of RBC, WBC, plate lattes etc, is as per required quantity. And formation of new blood is done as per requirement it can be considered personal excellence. Now, keeping in mind above example. We can achieve personal excellence, but it does not mean we can achieve process excellence. There can be some reasons that heart does not pump enough blood continuously. (process). If both our personal and process are efficient that does not mean our operation has achieved operational excellence. Operation includes end to end processes; if heart is pumping (process) efficiently, there can be some reasons that it is not reaching the some parts of body. Our process has is perfect, but our operation is not correct. Now comes the big part business excellence. As a human we can have different thinking/ethics/strategies, someone smokes, someone has bad food habits. Because of that our arteries can block. In this case all the three personal, process and operational excellence can be achieved, but because of our strategies/thinking our business as a whole (keeping oneself healthy) is not met.