

Ronaaq
Members
-
Joined
-
Last visited
Everything posted by Ronaaq
-
The statement is conditionally true. Condition being “rest of the thing remain the same” Producer’s risk:- It is the probability of rejecting a true null hypothesis. It is also called Alpha error or Type 1 Error or False alarms or overkill. A Significance level of 5%, means there is 5% probability that we will reject a good product. Consumers risk:- It is probability of failing to reject a false null hyphothesis. It is also called as Beta error or Type 2 error or Misdetection or underkill. A power or sensitivity of 10%, means there is 10% probability that a bad product is accepted. Now when we try to decrease consumers risk. i.e we try to reduce bad product going to customer and rest of the things remain the same than Producer’s risk is increased. Analogy Producer’s risk:- A good person is declared a criminal. Consumer’s risk:- A Criminal is actually released. To avoid a good person being punished, we need to check so many proofs, that because of lack of proofs sometimes a criminal is also released. In addition, the inverse true, if we want to reduce consumers’ risk, probability of a good person getting punished increases.
-
Against:- Zero defect is a Nirvana stage. When there is no waste, no unwanted activities in process of making a product. No matter how much money you invest, there will always be some waste generated/ some activity that is a not adding any value to the product. You take any organization with world class equipment,processes, technologies. They are still struggling to achieve Zero Defect, because it is practically impossible. I am not telling that Organization should stop working to achieve zero defect. Considering "Zero defect" as a concept is brilliant. It motivates and drives people for continuous improvement. If Zero defect is possible why do organization struggle to achieve 6sigma level. i.e 3.4 DPMO. why don't they target higher sigma level where there is 0 DPMO. six sigma is only one aspect of Zero Defect
-
Against:- Hi Kavitha, Previous question was about the concept and slogans that help motivate people. I completely agree with you that Zero defect concept is always beneficial to organization. but here the question is whether it is achievable or not. it has only two answers to it. either "yes" or either "No". and most will agree with it that it is practically not possible to achieve Zero defect.
-
Against Zero Defect is achievable:- I agree that Zero defect is a concept rather than target It should be used for motivating people to achieve zero defects. It drives continuous improvement activities. However, the question is ZERO defect is achievable or not. To achieve zero defect we need to eliminate waste from the process. Waste means any unproductive activity that does not add value to the product. Eliminating all those Non-value added activates/waste is practically impossible. The question is not about the concept; it is about actually achieving zero defect. Therefore, my vote is against

-
Specification limits:- Specification limits are the values between which products or services is accepted or rejected. Generally, customers give specification limits. Specification limits can be one sided, or two sided. One-sided specification: A specification limits set only at one point, for product to be accepted or rejected. As an example, defects in product. There can be only upper specification limit for defects. Two-sided specification: Specification limit that are set at two points, A product is accepted only if that parameter falls in the interval created by two specification limits. Upper specification limit (USL): A point above which the parameter measured is rejected. Lower specification limit (LSL): A point below which product is rejected if the measured parameter goes below the specified point. Target (T ): The single point where the parameter should hit. We should be cautious while defining the specification limits, because if we set the specification limit too liberal, we will be always within specification when we produce the product. However, customers will not be happy to see so much variation in the product of different batches. Similarly if we set the specification limits too stringent than what customer wants, we will waste too much resources in meeting those specification. In addition, customers will be happy because they get more than what they expect. How to decide specification limits for innovative new product. 1. We can look at other similar product in the market, and consider the specification of that product as benchmark. 2. If we are already making similar product, and the new product is an upgrade, enhancement of previous product, than current specification can be taken as a benchmark. 3. When there are multiple component in our new product, we can look at the specification of all other components and take some of the specification as out benchmark. 4. If we already had a trial run for the new product, we can record reading of all the parameters for which specification limits are to be defined& based on the sigma level we want to produce, we can decide the specification limits. If we decide specification at an early stage of new product development, we may be able to produce product within specification, but it may fail to meet customer expectation/requirements. It can restrict the innovation if the designers/engineers are told to meet all the specification without any changes. On the other bright side specification can help design team on how to meet the requirement. Which specification are not easily achievable, and how much resources are required to meet those specification. Each defined specification should be questioned for its purpose and how it will enrich customer requirement. Questioning the specification and looking for alternate solutions will result in truly a unique/innovative product. Similar to target/KPI’s Specification limits should follow SMART rule. S - Specific: - Specification should be specific; there should be zero chances of misinterpreting those specifications. M - Measureable: we should be able to measure the parameter for that specification, if we do not measure, we cannot control. Therefore, it is very important that the specification should be measureable A -Achievable: - our process should be capable enough to meet the specification. R - Relevant: - our specification should be based on customer’s actual needs; specification should be able to define the performance of our product. T - Timeless: - we should be able to be within the specification timelessly when our process runs with normal variations.
-
Understanding yield Basically there are three types of yield Sr.no Traditional Yield FTY RTY Definition It is the traditional way of calculating yield, in which no of good product is divided by no of inputs. First Time Yield. It is the probability for a unit going through a process will be good product. Rolled through put yield. It is the probability for a unit going through multiple process will be a good product. Formula = Output/ Input = (Input – Scrap – rework) / Input = FTY1 * FTY2 * FTY3 Comments This may be misleading because it obscures the impact of inspection and rework This shows actual effectiveness of the process, because in this rework is also considered. Taking an Example:- There is typically 5 process in manufacturing of French fries 1. Peeling & trimming 2. Cutting 3. Blanching & Drying 4. Frying 5. Packaging Now input is 100 Kg of potatoes and we get 54.36 Kg of output. Traditional Yield will be 54.36/100 = 54.36% For each process input and the output are measured Process Input Output Traditional Yield Peeling and trimming 100 85 85% Cutting 85 75 88% Blanching & Drying 74.8 64 85% Frying 63.58 57 90% Packaging 57.222 54 95% Output 54.36 Traditional Yield for all the process are measured by formula output/input Overall traditional yield for all the process will be 54.36/100 = 54.36%. We will get same result if we multiply traditional yield of all the process. As discussed before traditional yield does not consider amount of rework done. Assuming at all different there was some rework done as shown in table. Process Rework Peeling and trimming 5 Cutting 10 Blanching & Drying 10 Frying 15 Packaging 20 Output Now if we calculate FTY for all the process will be get results as below table. Process Input Scrap Output Rework Traditional Yield FTY Peeling and trimming 100 15 85 5 85% 80% Cutting 85 10.2 75 10 88% 76% Blanching & Drying 74.8 11.22 64 10 85% 72% Frying 63.58 6.358 57 15 90% 66% Packaging 57.222 2.8611 54 20 95% 60% Output 54.36 To calculate RTY we need to multiply FTY for each process steps, and we will get 17.42% as RTY. Checking the difference between traditional yields of all process to their FTY, we can see that when rework is considered in calculation, it gives a big impact on yield. Similarly, Traditional yield of overall process and RTY figures are having large difference. We need to concentrate more on improving RTY, rather than traditional yield. RTY and Traditional Yield can be same when there is no rework done in a process. To improve RTY, we need to improve individual FTY of that process, and if we improve FTY for the initial processes, we can see a lot of improvement in RTY. Now considering that one process is having a 100% RTY, which means there are no rework & no scrap produced in the entire process flow. This does not mean the process is efficient; there can be other losses in the system. We all know 8 types of waste as per lean manufacturing. TIMWOODY (Transportation, Inventory, Motion, Over production, Over processing, Defects, Y- your skills). If RTY is 100% it means one of the 8 waste is not present, but there are 7 other waste that can be eliminated. Also the products that are 100% ok first time, does not mean that the average of all the measurement is at the target line, average might be shifted towards LSL or USL. In Summary, if a process if having 100% RTY, does not mean that there is no scope of improvement in that process, there are other metrics, that needs to looked upon.
-
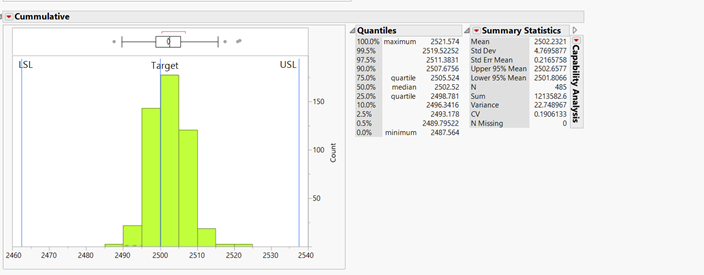
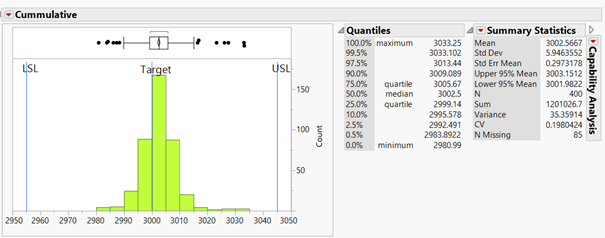
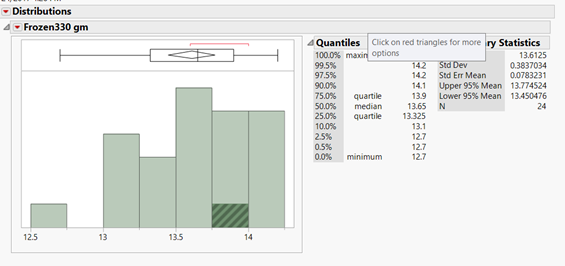
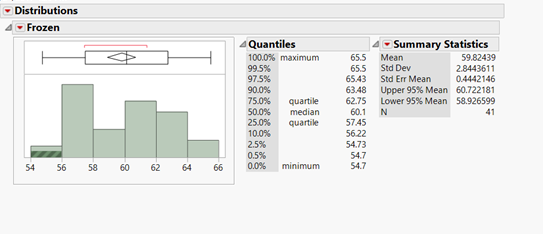
Coefficient of variation (CV) is a measure of relative variability with respect to the mean of the population. It is the ratio of the standard deviation to the mean (average). COV= (SD/M) * 100 COV:- Coefficient of variation SD:- Standard Deviation M:- Mean COV is used to describe relative variability within a population independently of absolute values of observation. If the absolute values are similar, than both the samples can be compared with standard deviation. But when both (the absolute values) population mean are different than we should use COV , or when the measured variables are completely different than we can use COV for comparing tow population. COV should not be used to compare population data which are on interval scale, which can have negative values. As an example, For packaging machine, some data were taken for a 2.5 Kg pack size, and 3 kg pack size. We want to know for which pack size machines is more stable. We can use COV for this analysis. For 2.5 Kg Mean:- 2502.2321, SD:- 4.7695, COV = (SD/M)*100 = 0.1906% For 3 Kg Pack size Mean:- 3002.5667 SD:- 5.94635 COV = (SD/M)*100 = 0.19%. In this example we can see that there is difference in SD for both the pack size, but when we compare COV, there is not is very marginal difference. Hence we can say that machine is stable for both 3 Kg pack size and 2.5 Kg pack size. Example 2:- In a process industry there is a machine which gives actual shape to the product. Different products have different shapes and different weight. Now we want to check whether the machine performs equally for both the type of products or not. We can compare COV for this. For Product A:- Mean:- 13.61, SD:- 0.383, COV:- 2.81 % For product B Means:- 59.82, SD:- 2.844, COV:- 4.72% So for product A we got COV 2.81% and for product B we got COV 4.72%. Hence, we can say that machine gives less variation when we run product A. Similar studies can also be done when there are different variables.
-
FMEA :- Failure More Effect Analysis. Failure Mode and Effects Analysis (FMEA) is a structured approach to discovering potential failures and their effects that may exist within the system/process/ product/service. We can break down FMEA in two parts FM (Failure modes:-The ways in which the system can fail.) In this all the possible failure modes are defined. EA(effect analysis:- Effects are ways that listed failures can result in waste, rework, deficient product reaching the customer) In this we analyze the effect/consequences of those failure modes. It is essential that all the components are reviewed during the analysis. With FMEA we can identify, prioritize and limit these failure modes. Failures are prioritized according to how serious their consequences are, how frequently they occur and how easily they can be detected. The purpose of the FMEA is to take actions to eliminate or reduce failures, starting with the highest-RPN. There are mainly two types of FMEA 1. Design FMEA (DFMEA) In DFMEA, analysis is done on basic properties of a product, like material, geometry, etc. Ideally DFMEA is done for products before they reach production 2. Process FMEA (PFMEA) PFMEA is done for analysis of manufacturing and assembly processes In PFMEA, analysis is done on ways in which product quality will affect based on online processes. Like Process parameters, machines, Human errors, etc. Steps for FMEA Form FMEA Team. Identify process steps. Identify the potential failure modes for each process step. Identify potential effect of failure and rate their severity. Identify current control and rate the detection. Identify probability of occurrence, severity and probability of detection. Calculate RPN( Risk Priority Number) and prioritize. Identify recommended actions and follow up. Below is the template that can be used for process FMEA Limitations of FMEA 1. Entire process is depending on the knowledge and skill level of team members. 2. FMEA analysis takes lot of time and effort, team has to be very cautious about defining the scope. Going too deep will make the analysis never ending. 3. A team member who is having biases can manipulate RPN no. Making a small problem bigger and vice versa. 4. FMEA is not a static model. For successful risk management, the FMEA should be regularly updated as new potential failure modes are identified and corresponding control plans are developed. 5. It is an assessment tool, not one that is designed to eliminate problems. It will yield the best results when supplemented with other project management tools to see the control plans through. 6. FMEA often has repeated information 7. FMEA works best as a bottom up tool and fails to identify all the failure modes if used for a top down analysis 8. FMEA does not provide any assessment or discover complex failures involving combination of failures

-
Cycle time:- Actual average time taken to make a product. It can be total of all the process time/cycle time of different machines. Cycle time is more for internal process improvements. If there are more machines for the same process, we can divide the cycle time for one process by no. of machines. Unit for cycle time is minutes/unit. Lead time:- Time taken to deliver the product to customer from the time order is placed. Lead-time includes total cycle time. Hence, lead times will always be greater than cycle time. Lead times are for customer, when to expect the product. Unit for lead-time is time (days, months, weeks) Example:- There are 5 main process to manufacture SS seamless pipes. 1. Cutting 2. Drilling 3. Extrusion 4. Chemical treatment 5. Inspection We have measured average cycle time for each process 1. Cutting (CT1):- 5 minutes/unit 2. Drilling(CT2):- 3 minutes/unit 3. Extrusion(CT3):- 2 minutes/unit 4. Chemical treatment(CT4):- 3 minutes/unit 5. Inspection(CT5):- 2 minutes/unit Here total cycle time will be CT1+CT2+CT3+CT4+CT5 = 15 minutes/unit. Now time taken to convert customer order to process order is 10 minutes And time taken for transportation of finish good to customer is 10 days. Lead-time will be 10 minutes+15 minutes+ 10 days = 10 days and 25 minutes. Lead-time will be higher if an organization wants to keep some WIP/backlog. Cycle time is important to find the bottleneck in the process. The machine with greater cycle time drives total production. In our example cutting is the bottle neck, because cycle time for cutting process is 5 minutes. Now if we install one more cutting machine with same capacity as the current one, our cycle time will be reduced to 2.5 minutes/unit. Moreover, our improved cycle time will be 12.5 minutes/unit. There will be new bottleneck to our process i.e Drilling and chemical treatment. Thus, cycle time is very important to process balancing and identifying bottlenecks. In our example, drilling process is a customer for cutting process, so lead-time for getting a unit from cutting to drilling process is 5 minutes. Which is wrong because in this people ignore the time taken for one unit to transfer from cutting area to drilling area. Major difference between both the terms is units. Lead-time is in time, while cycle time is minutes/units.
-
E. Workforce if engaged in improvement initiatives can do wonders. While slogans and rigid targets should be avoided, improvements in quality and productivity should still be expected from workforce. I believe in statement E, with inclusion that management should provide the environment/infrastructure, which is required for improvement initiatives. It should be a top down approach. Because any improvement system will not sustain unless it is driven by management. Workforce is the main asset for any organization. Many good organizations believe in this and hence they invest in people. They believe in developing the skills of the existing resources so that their expertise can be used more effectively in the key areas of business. We can keep workforce engaged/involved in many ways. An organization can have an employee suggestion program; employees can be given incentives based on performance. In Lean/six Sigma there are many tools that can help us achieve this. Whenever a tool is rolled out management should be committed throughout the process of implementing these tools. Role of management is not only to roll out/ kick off the session and wait for the end results. While taking active participation in program, management should be cautious about the providing feedback. Providing positive feedback is simple. Positive feedback should be given in presence of a group. While on the other hand negative feedback should be given in personal. Giving negative feedback to employees force them to perceive that newly launched program is another way of monitoring them. Coaching sessions are the best option for providing negative feedback/areas of improvement. For each parameter, we should have SMART goals. Specific (simple, sensible, significant). Measurable (meaningful, motivating). Achievable (agreed, attainable). Relevant (reasonable, realistic and resourced, results-based). Time bound (time-based, time limited, time/cost limited, timely, time-sensitive). Making Slogans, does help in motivating employees. However, overdoing the slogans and not achieving figures as mentioned in slogans demoralizes people. Targets should be always based on SMART, There should be a strategy developed to meet the figures mentioned on slogans. Slogans should reflect what an organization wants to achieve in longer duration of time. For each year, we should have an action plan on how to reach the figures mentioned in slogans. Targets should be drilled down from top to bottom. Every employee should be working for achieving their targets, which in turn are linked to business targets.
-
A fish bone diagram displays graphically the factors and underlying causes of a defect or problem. The factors are drawn on lines radiating out from a central line. The completed diagram resembles a fish skeleton hence it is called Fish bone diagram. Other names:- 1. Cause and effect diagram ( as it shows relation between all the causes and it’s effect) 2. Ishikawa Diagram (named after it’s creator Kaoru Ishikawa) The fishbone diagram gives you a comprehensive list of possible causes to identify the root cause of the problem. We can group causes in separate categories as per industry it is used. For manufacturing industry, we can use 6M’s (Man, Machine, Method, Material, Management, and Mother Nature) For marketing industry, we can use 7P’s (Product, Price, Place, Promotion, People, Positioning, Packaging) For service industry, we can use 5S’s (Surrounding, Suppliers, System, Skills, Safety) It is not mandatory that we need to stick with these categories for any industry; we can add/modify categories as per our requirement. Advantage of grouping causes as per category is to get as many possible causes for the problem. Sometimes people are having presumptions about the causes, and they do not think outside those causes. Having different categories help people to think in all the directions. Below is an example of Fishbone diagram in a Manufacturing industry. Fishbone Diagram is considered misused for following reasons. 1. Problem statement not clearly defined. Clarity of problem for all the team members is essential for brainstorming of causes for a fish bone diagram. 2. Team selected for brainstorming should have people who are subject matter experts, otherwise there will be few causes on the diagram and we may not reach the root cause. 3. People in team are not open for other causes, and support the causes that they presume is root cause. 4. If we don’t keep all the points, thinking that it is having negligible impact. 5. We get symptoms on the list instead of causes. 6. Why Why analysis for a cause is not used effectively. 7. Stopping the session, because there are too many causes on the bone and no more blank space available. 8. Stopping the session because of time constraints 9. Discussing more about a particular cause and hence diverting the topic to some other problem. 10. Further filtering of all the causes is required with help of other tools.

-
Root cause analysis (RCA) is a problem solving technique used for identifying root causes for the problem. There are two types of factors for a problem. Casual factor and root cause factor. During RCA, when we find a root cause and eliminate the root cause the problem does not arise again. On the other end if we remove the casual factor for the problem. We will get rid of the problem, but there is a risk that the problem can arise again. It is very important that we follow proper step of root cause analysis and eliminate problem permanently. In entire process of root cause analysis, data segmentation is very useful. Considering an example, Problem:- There are high no. of defect in product and we are getting complains and our Sigma level is affected by it. Step 1:- Gather data for all complains. Step 2:- Data segmentation based on type of product/SKU. Step 3:- Identifying which product/SKU is having more complains. Step 4:- Data collection of complains for that product/SKU. Step 5:- Data segmentation of complains based on time, shift, operators, QC technicians Step 6:- If we find that there is a particular pattern for complains based on any particular variable. We need to drill down more on that variable Step 7:- In this example, we see that a particular trend id followed based on time. i.e during start of calendar year complains are less and it is gradually increasing after June till December. Step 8:- Data collection for processing parameter that were used during the time and segmenting those data into two parts. Jan to May and June to Dec. Step 9:- we derived that processing parameters for sorting machine are same for entire year. At the same time defect in incoming material was increasing. Step 10:- on performing 5Why analysis, we found that sorting machine was capable of handling the defects in incoming material but the process recipe was not set for higher defects in incoming material. Step 11:- Action taken that machine automatically detects that if the no. defects in incoming material is high than sorting machine changes its parameters on its own. In the entire process, we can see that data segmentation into right variable helps us a lot in finding the root cause analysis.
-
Prevention cost:- Total cost that helps us in prevention of a quality problem from occurring at all. These cost are planned well before actual operation starts. This cost are generally onetime cost. Prevention cost can be categories as Cost for Good Quality Prevention cost includes. · Quality management System development and it’s management · Quality training · Quality circles · Statistical process control · Quality improvement projects · Quality data gathering, analysis and reporting · Investment in quality-related information systems · Product-design verification Appraisal cost:- Similar to prevention cost, some cost that are incurred to keep the quality problem from occurring by different online inspections for quality attributes. This cost are incurred on daily basis. Appraisal cost can be categories as Cost for Good Quality Appraisal cost includes · Test and inspection of incoming materials · Final product testing and inspection · Consumables and equipment’s for testing and inspection. · Labor/ Supervision of testing and inspecting activities · Depreciation of test equipment · Maintenance of test equipment · Test and inspection of purchased materials · Online Inspection Internal Failure costs:- Internal Failure cost are the total cost that are incurred to rectify the defects/defective product discovered before the product is delivered to customer. Internal Failure cost can be categories as Cost for Poor Quality Net cost of scrap Rework and overhead involved for rework Delay in production plan because of rework Rework labor and overhead Cost involved in disposal of defective products Down time caused by quality problems Analysis of the cause of defects in the production Retesting of reworked products External Failure costs:- External Failure cost are the total cost that are incurred to rectify the defects/defective product discovered after it has reached customer. External Failure cost can be categories as Cost for Poor Quality Cost of field servicing and handling complaints Warranty repairs and replacement costs Lost sales arising from a reputation of poor quality Product recalls Complaints in/out of warranty Loss of reputation No organization will like to incur cost because of Poor quality (Internal/External Failure costs).Since there are so many tangible and intangible cost associated with it. For an organization best scenario is to have zero Cost of Poor Quality. To achieve this, we need to invest more in prevention cost/appraisal cost. An organization should find the right balance between prevention cost and appraisal cost, because when we invest too much on prevention cost, total production cost of our product increases. Which may not be good to be stable in a highly competitive market. We should have an acceptable target for getting customer complains, reword, and hold (Cost of Poor quality).
-
Null hypothesis (Ho):- It is a hypothesis that says there is no statistical significance between the two variables in the hypothesis. It is a statement of “No Difference”. It is a statement we are testing in order to determine whether or not that statement is true. The observed difference is purely by chance and there is no special cause for the difference. Alternative Hypothesis (Ha):- Hypothesis which states that there is statistical significance between the two variables in the hyphothesis. It is a statement of “difference”. It states that there is real effect and the observations are affected by the effect and some pure chance variations. Example:- A person reaching his office through a route 1, after some days he takes another route 2. We have recorded time taken for a person to reach his office. Ho:- there is no difference in time taken to reach the office from route 1 and route 2. Ha:- There is statistical difference in the time taken to reach the office from route 1 and route 2. There is no situation in which Ho becomes and Ha and vice versa. Ho statement always has the words “No Difference”. While Ha statements will always have “statistical difference” words.
-
Below is the table showing steps followed in each problem solving techniques Steps DMAIC Steps 8D Define (Define Project Goal and Deliverables) 1. Generate project Ideas D0 Plan for solving the problem and determine the prerequisites 2. Select Project D1 Use a team—Establish a team of people with product/process knowledge 3. Finalize Project charter and High level Map D2 Describe the Problem Measure (Measure the process to determine current performance; quantify the problem.) 4. Finalize Project Y, performance standard for Y D3 Interim Containment Action 5. Validate Measurement systems D4 Root Cause Analysis (RCA) and Escape Point 6. Measure current performance and gap D5 Permanent Corrective Action (PCA) Analyse (Analyze and determine the root cause(s) of the defects) 7. List all probable X’s D6 Implement and Validate the Permanent Corrective Action 8. Indentify Critical X’s D7 Prevent Recurrence 9. Verify sufficiency of critical X’s for the project D8 Closure and Team Celebration Improve (Improve process performance by addressing and eliminating the root causes) 10. Generate and evaluate alternative solutions 11. Select & optimize best solution 12. Pilot, implement and validate the solution Control (Control the improved process and future process performance) 13. Implement control system for X’s 14. Document solution and benefits 15. Transfer to process owner, project closure If we analyze the steps in both the process, there is only one major difference. In 8D process step D3 “Interim Containment Action” is not done in a DMAIC process. In this step an interim solution is provided for the symptoms of the problem, this solution is temporary. Which reduces the impact of the problem to the customer for the time being. I would prefer to always use DMAIC process in problem solving. If the problem is huge and gives big impact on the customer, we can separately provide a fire fighting solution and stop the impact for short time. But management should be aware that the solution provided is not a permanent solution so they should continue problem solving with DMAIC process.
-
Control Charts are basically for 1. To study how a process changes over time. 2. Whether the variation in process are because of common causes 3. How the process has improved because of the improvement done in process. 4. Predicting the expected range of the outcome In a C chart & a U chart center line is for average, there is an upper control limit and a lower control limit. There are three rules for control chart which determines that process is stable 1. None of the reading is above USL/ below LSL 2. There are no more than 6 points consecutively above/ below center line 3. There are no more than 6 points consecutively trending upward/downward. Now if we don’t have a LSL in control chart than we might miss if the process is breaking one of the rule for a stable process. i.e “None of the reading is above USL/ below LSL” In case of U Chart we can neglect LCL is it is coming negative.
-
Sigma level Long Term (Zlt) Sigma Level Short term (Zlt) A Z value is a data point's position between the mean and another location as measured by the number of standard deviations. For example, a 6 sigma process means that six standard deviations lie between the mean and the nearest specification limit. Six is the Z value. Zlt is calculated from data set which can have special causes or assignable causes Zst is calculated from a data free of any special cause or assignable cause Zlt is calculated for a longer duration of time in which there are some changes in the process. Zst is calculated in a shorter time frame when all the parameters remain the same We can measure Zsl and Zlt separately for a particular data set. But generally we measure one and compute the other with the formula Zst= Zlt+1.5. This formula is derived by Motorolla, by conducting many research from their historical data. For measurement purpose we can measure both separately, but when we want to check the improvements in a process. We should always measure Zst, because it gives correct reflection of our data. And estimate Zlt from Zst. In a six sigma project, we should always make Zst as our bench mark and make improvements on this.
-
VOC VOB Full Form Voice of Customer Voice Of Business Definition Stated and unstated needs or requirements of the customer. Customer can be internal as well as external Stated and unstated needs or requirements of the business/shareholders Examples customer satisfaction scores, product delivery times, TAT ( Turn around time) TPC ( Total Production Cost) ROI (Return-On-Investment) IRR % Market Share% No. of new product developed How to get the needs KANO Analysis, Direct discussion or interviews Surveys/market research, Focus Groups, Customer specifications, Field reports, Complaint logs. Derived from financial information Competition investigation Historical data Other sister companies in other countries Board meetings Hot to use those information Modify or discontinue products. Modify processes. Attune business strategy. Identify opportunities for Market weakness, Utilization of investment capital Research and development status Ensure business growth While the Voice of Business is supposed to be in line with the Voice of Customer, there are some valid reasons that make them go against each other. We as a company run business to make profit, but at the same time we should not ignore voice of customer. Because at the end if customers are not satisfied we lose business. Example:- For a Fries manufacturer, VOC is that they don’t want any defect in the fries. (Defect:- natural defect that comes with potatoes, ex potato skin, potato stem) At the same time VOB is to keep out TPC( total production cost) down. As a producer we can adjust our process such that there is no defect in the product. But to accomplish that we need to run our process slower so that our defect removal system works at 100% efficiency. Another option is to invest in adding defect removal capabilities. In this case as a producer we have to balance between the two VOB and VOC.
-
Tribal knowledge is any unwritten information that is not commonly known by others within a company. Those information are handed down generation to generation without any documentation. This type of knowledge can be realistic but there are no data for backup. A company/organization that is working on continuous improvement, tribal knowledge plays a very important role. We need to make a system, through which people having this tribal knowledge can give their ideas and help in solving complex issues. We can make those people in Kaizen teams/project team as a key member of team, but at the same time we need to be cautious because people with tribal knowledge are the ones that gives most resistance to any change. To convince them with supporting data and explain them that tribal knowledge has to be supported along with data. When their mind set changes , and they are aligned to company goals and priorities, process of continuous improvement will flourish in that organization.
-
Rational subgrouping is a process of organizing data in different groups, which were produced under similar conditions. With this we can measure the variation between the subgroups instead of individual points. If we dot use rational subgrouping properly, and use only individual data points, we will miss the drift in the variability of the process that happens over a period of time. With help of rational subgrouping we will be able to know whether the control limits are too tight or too wide
-
Below is the table Showing Qualities of a sponsor and when,where and how those qualities are helpful Qualities Why/ When/ How those qualities are helpful Leadership 1. Provides leadership and guidance about the culture and values of business. 2. Provide direction and guidance about business strategies and project initiatives 3. Identify and qualify project benefits and manage project benefits realization 4. Recommends opportunities to optimize cost/benefits 5. Keep resources in place to ensure success Vision 1. Clearly understand the problem to be solved 2. Recognize when a project isn't going to deliver the results as originally expected 3. Know when higher priority projects supplant the current project Business Awareness 1. Providing business expertise and guidance to the Project Manager. 2. Keeps project aligned with organization's strategy and ensure that the business need is valid and correctly prioritized Decision Making Identify project critical success factors. Determine Project scope. To have a mitigation plan for project risk. Taking decisions that may be beyond the authority of the Project Manager. 5. Ensure the solution fixes the problem 6. To check that project team doesn't waste organization resources by over-engineering a solution at the same time avoiding to over-simplify things thereby under-allocating resources to fix the problem 7. To remove non-performers as and when necessary Influencing 1. Selling and marketing the project throughout the organization. 2. Negotiate funding for the project and be a spokesperson to the senior management Acting as the link between the project, the business community and perhaps most importantly Communication 1. To launch the project properly. 2. Selling and marketing the project throughout the organization. 3. Initiating project reviews and supporting the process of review. 4. Provides real time feedback and lessons learnt to the entire team 5. Involve stakeholders in the project and maintain their ongoing commitment to the project 6. Review changes to the project environment, including schedules, priorities, tasks, etc. Motivation 1. Motivating team members in each and every phase of project Conflict Management 1. Resolving issues (typically competition for resources and priority clashes) that are beyond the control of the Project Manager, resolving conflict and removing obstacles to progress 2. Governs project risk, ensuring risks are managed 3. Negotiate with stakeholders to gain consensus when differences of opinion take place. Ensures Accountability 1. Owns the business case 2. Overall quality of the project, both the methods used to develop it and the end product, Evaluate the project’s success on completion 3. Provides assurance, ensuring the project is under control, ensuring changes to the project are properly managed 4. Provides assurance, ensuring the project is under control 5. Hold the team accountable for results 6. Ensuring changes to the project are properly managed 7. Keep the team focused on dates and deliverables Action Oriented 1. Ensure the solution fixes the problem 2. Know the big issues and what is needed to resolve them 3. Resist the urge to take on additional work at the last minute Collaborates 1. Be a partner to the project manager by helping to think through tough problems Courage 1. To make a good business decision that may be unpopular. 2. To cut losses and stop a failed project Customer Focus 1. Keeps project aligned with organization's strategy and portfolio direction, ensuring that the business need is valid and correctly prioritized ensuring that the project remains a viable business proposition Builds Effective Teams 1. To prepare project organization, roles and reporting structure. 2. Identify key members that should be part of steering committee.
-
For an organization target should be to reach as near to zero rework as possible instead of zero rework. Because to accomplish zero rework , we will require huge capital investment which includes all the modern technology and machines that will produce product within the specification limits all the time. Cost of product will increase which at the end will affect their market share. Some reworks are always acceptable, when that product, process is not a critical function of the product. Taking an example of a sensor which was not functioning properly, and after doing some maintenance it started working again. Now imagine this sensor is too be used at two different places. 1. In Aeroplanes 2. In a local manufacturing machine. In this case the reworked sensor should not be used in aeroplances, but that sensor can be used at a local manufacturing machine. Taking another example of a food industry. There are various parameters on which a product is accepted by quality representative. One of them is metal pass. if the machine detects that there is slightest of chance that there is metal in the product it will not be allowed by quality representative. We need to do rework in this product. Because it affects the human health directly. There is another parameter of length of the product, if there is slight variation in the length of the product, we may not rework that product instead we will pack in a lower grade of product.
-
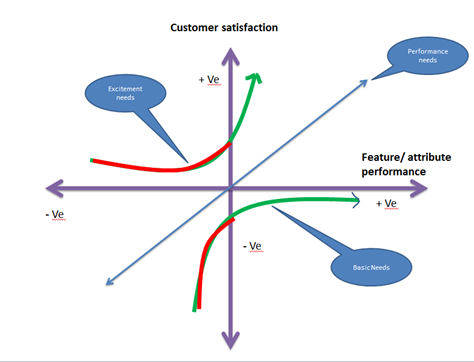
Kano Model:- It was developed by Dr. Noriaki Kano in 1984. It is a very good and effective tool of analysis to find out what are the features that customers want from your product. And how much those features affect customer satisfaction. Below is the table showing what is meaning of the needs mentioned and its impact to customer satisfaction. Basic Need Performance need Excitement Needs Definition These features are the basic requirement of the product/service. Customers expect that these features are already present in the product, and do not ask for these features. These features are those which customer demands. These features are the points on which customer compares product of two companies. These features/needs are those which are not demanded by customers. Many times customers are not aware about these features. Effect on Satisfaction level Enhancing these features may not increase the satisfaction level of the customer. But if the performance of these features drop customers will be highly dissatisfied. Performance of these features will affect customer satisfaction positively as well as negatively. If our product is having these features/needs customer satisfaction increases a lot because they are delighted/excited by these features Effect on Market/Market share These are the features/needs of a product that will help a company to get in the market. If we as company satisfy performance needs we will be able to remain in market. If we want to excel in our market, be world class we should increase these features in our product. Effect of overkill/ over enhancing these features Once a company has reached a satisfaction level for these features company should not try to improve on these features, as improving more than required will add cost to product without affecting customer satisfaction positively. If we want to improve our product’s satisfaction level we need to improve performance of these features. It’s also important to keep in mind that the more functionality we add, the bigger the investment we have to make. We should try to improve on these needs, but keeping the investment minimum, otherwise customer will feel burden of these excitement needs. Graphical presentation In attached graph, you can see that curve for basic need, becomes stable after reaching a satisfaction level. These features do not increase the satisfaction level positively. Curve for performance needs is a linear curve. If these performance of these features is better compared to others satisfaction level increases, but if performance is not good it will affect satisfaction level negatively. Curve for excitement needs, starts on a +ve quadrant, absence of these features will not affect the satisfaction level, but presence of these features highly affect satisfaction level. Other names Threshold attributes, unspoken needs, Must be needs. Linear, One dimensional, satisfying customer needs Delighter, attractive needs. Example:- Mobile Phone Mobile, Charger with USB cable. Headphones, Dual sim/single sim, Memory capacity, warranty period, camera resolution, battery size, cost. Separate camera for group selfie, Free data plan for 1 year, Free One time screen replacement, cover, screen guard, Portable charger. As times passes performance need à basic needs, and excitement needs àperformance needs and new excitement needs arise. Categories of these needs do not remain the same. It evolves along with time. Taking same example of mobile phones. Previously when there were only landline phones, mobile phones ability to call and send messages was an excitement need. But now those two features are part of basic needs with performance needs of battery life, camera quality. At present there are excitement needs for mobile phones such as face detection, group selfie camera, etc. These features which are excitement need at present will become a performance needs in future and new excitement need will arise. Thus shift in the needs continues. Once we know needs of customer for a particular product and their categories. 1. We can make sure that our product has all the basic needs required by customer. 2. We can check which features/needs are redundant and can be removed from the product to save cost. 3. Which performance features required improvement. 4. Check Excitement needs and find a solution to incorporate them with your product. 5. Since there are competitors, this analysis is of great use for development of new product. Kano.pptx
-
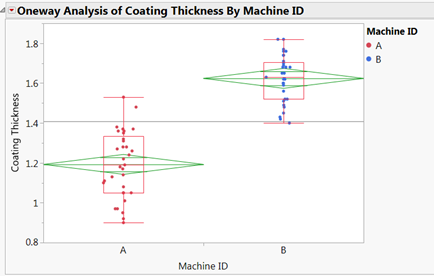
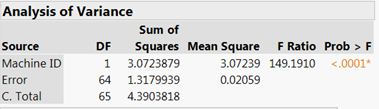
Statistically significant difference means that the two variables that we are comparing are having some difference caused because of some special cause and not because of chance. 1. We can use this analysis to verify whether the changes that are done in the process are actually giving the desired results or it is just random chance. In a company, downtime caused due to Maintenance and electrical problems was 5%, after we have a new maintenance manager; he rolled out a new system of maintenance as a result of that downtime reduced to 3.5%. With this analysis we can statically prove that the reduction in downtime is because of the new process. 2. For measuring one quality parameter, we have two machines. We can use this analysis to check whether testing on type of machine gives different result. From the analysis we can statistically prove that machines does affect the results that we are getting, because the p value is <0.5. 3. Similarly, if for an output Y, we have multiple X. we can also analyze which X are having statistical significant difference. and find the impact of that X with further analysis.
-
Differentiate between a stable process and a capable process. Is Process Stability supposed to be a pre-requisite for all type of processes? Explain with appropriate examples. Sr.no Stable process Capable process Definition A process which is able to produce the output consistently over a long period of time A process which is able to produce the output meeting customer specification Pre-requisites Customer specification (USL/target/LSL) is not required. Customer specification (USL/target/LSL) is required. Variations It has only common cause of variation. It can have special cause of variation along with common causes. Output predictability over a long period of time We can predict the output over a long period of time Since there are special causes of variation, it will be slightly difficult to predict the output over a long period of time Before going to example, I would like to clarify that a stable process does not mean that it is a capable process and vice versa. Definitely process stability is a pre-requisite for all the type of process. Case study:- A company is producing a product which has a weight of 3Kg. Stable process:- Bellows distribution curve shows that the process is stable, as it is making product consistently at a mean of about 3.002 Kg. Non stable process:- Now over a period of time if there is some special cause of variation, than the same process cannot be stable process. We can get a graph as shown below. We can see from the graph that there are two spikes in the distribution curve, one is near 3000 and another one is around 3025. At the mean value 3012.43 we are getting very few readings. Product should be of 3 Kg, but due to some special cause entire mean after that cause has shifted to 3025. Thus this process is not stable. Capable and stable process:- Now in the same process, when we add customer requirements, we can see whether the process is capable or not. From the below distribution curve we can see that we are getting weight of the product well within specification. This process is both stable and capable. Capable process but not a stable process:- In above distribution curve of weights, we can see that the product is well within specification, but it is not stable. It is very difficult to predict the output of the process. Also minimum value is very near to the LSL. Now if customer revised the specification limits and makes it more stringent. In that case our process will not be capable to meet the requirements. And we may lose the business. Hence it is very important the process is stable. Once we eliminate special causes of variation from the process and make it stable. It becomes easier to adopt new customer requirements. The only thing required will be to shift the mean towards target. As an example if the customer comes up and tells us that he requires a 2.5 kg of product instead of 3 kg. We will have to change the process mean to 2.5 kg and the process will be capable on its own. As we know that the process is stable.


