Sumanta Das
Members
-
Joined
-
Last visited
Everything posted by Sumanta Das
-
RTY is stands for Rolled Throughput Yield, sometimes also referred as Final Yield, RTI is the probability which indicates that a process with multiple step will produce a flawless/defect free unit. If under a process there are N number of sub-processes and the probability of getting a defect free result is n1%, n2%, n3%, …. and n% then RTY of N = n1 * n2 * n3 * … * n. Say under a process P there are four sub process and the probability of getting defect free result is 97%, 62%, 91% and 88% then RTY of P = 0.97 * 0.62 * 0.91 * 0.88 = 0.4816, that is 48% approximately. In the above example if we have 100 items, say glass, After 1st sub-process: We have 97 defect free glasses, 3 glasses needs rework/retest/failed/scrapped. After 2nd sub-process: We have 60.14 defect free glasses, 36.86 glasses needs rework/retest/failed/scrapped. After 3rd sub-process: We have 54.72 defect free glasses, 5.42 glasses needs rework/retest/failed/scrapped. After 4th sub-process: We have 48.16 defect free glasses, 6.56 glasses needs rework/retest/failed/scrapped. That is we get 48% approximately and that is how it’s get calculated. Although most of the steps have yield more than 88% but because of one step’s yield 62% it became 48%. Same way for another process consisting of four steps each with 95% yield, RTY comes to (95%*95%*95%*95%) = 81.5% 95% RTY is considered ‘Good’. RTY= [(1-DPI)^(s)]^(n); s = no of inspections done, n = no of steps in production or service delivery process. Also can be calculated via Y = e^(-dpu) Pros: 1. Its provides visibility into the yield of each process step. 2. Its expose “hidden factory” of risk defects/delays. 3. Identifies the poorest performing/greatest negative contributing process steps. 4. Helps to look into most impactful process for improvement/opportunities. 5. reflects the effect of variation on both scrap and rework. 6. Gives us a realistic view of the quality of the process. Cons: 1. It is very difficult to maintain for parallel process or for offshore branches. 2. You have to know FTY of each steps. RTY is TRUE yield or capabilities or reflection of a process [which has more than one steps] performance. So, if a process has RTY of 100% it’s never going to be inefficient[until and unless we have made a mistake in the beginning itself i.e assumed/gathered a wrong requirement specification and implemented that]
-
Coefficient of Variation(cv) Definition: CV is the percentage variation in mean. Standard Deviation(SD) is the total variation in in the mean. When we want to compare more than one series then we use CV. the more large CV is, the more variable the series is that is less stable/uniform, and the small CV is the less variable the series is i.e more stable/uniform. Formula: CV = SD/Mean that is it the ratio of SD and Mean. Only for NON-ZERO mean CV gets calculated. Example: Series A= (5, 9.5, 4.9, 1.85, 5.25, 7.05, 6.0) No.of Samples 7 Mean 5.6499 Standard Deviation 2.327 Coefficient of Variance 0.4118 Step by Step Calculation: Input: 5, 9.5, 4.9, 1.85, 5.25, 7.05, 6.0 Mean(µ) = (5 + 9.5 + 4.9 + 1.85 + 5.25 + 7.05 + 6.0)/7 Mean = 39.55/7 µ = 5.6499 = √( (1/7-1) * (5-5.6499)2+( 9.5-5.6499)2+( 4.9-5.6499)2+( 1.85-5.6499)2+( 5.25-5.6499)2+( 7.05-5.6499)2+( 6.0-5.6499)2) = √( (1/6) * (-0.64992 + 3.85012 + -0.74992+ -3.79992 + -0.39992 + 1.40012 + 0.35012)) = √( (1/6) * (0.42237001 + 14.82327001 + 0.56235001 + 14.43924001 + 0.15992001 + 1.96028001 + 0.12257001)) = √ 5.414929 σ= 2.327 Coefficient of Variance = σ/µ = 2.327 / 5.6499 Coefficient of Variance = 0.4118 Series B: (4,59.5, 4.9, 4.85, 5.25, 6.05, 6.0) No.of Samples 7 Mean 12.9357 Standard Deviation 20.5451 Coefficient of Variance 1.5882 Step by Step Calculation: Input: 4, 59.5, 4.9, 4.85, 5.25, 6.05, 6.0 Mean(µ) = (4 + 59.5 + 4.9 + 4.85 + 5.25 + 6.05 + 6.0)/7 Mean = 90.55/7 µ = 12.9357 = √( (1/7-1) * (4-12.9357)2+(59.5-12.9357)2+( 4.9-12.9357)2+( 4.85-12.9357)2+( 5.25-12.9357)2+( 6.05-12.9357)2+( 6.0-12.9357)2) = √( (1/6) * (-8.93572 + 46.56432 + -8.03572 + -8.08572 + -7.68572 + -6.88572+ -6.93572)) = √( (1/6) * (79.84673449 + 2168.23403449 + 64.57247449 + 65.37854449 + 59.06998449 + 47.41286449 + 48.10393449)) = √ 422.10113401 σ= 20.5451 Coefficient of Variance = σ/µ = 20.5451 / 12.9357 Coefficient of Variance = 1.5882 Series C: (4,59.5, 18.9, 20.85, 5.25, 6.05, 1.0) No.of Samples 7 Mean 16.5071 Standard Deviation 20.4366 Coefficient of Variance 1.238 Step by Step Calculation: Input: 4, 59.5, 18.9, 20.85, 5.25, 6.05, 1.0 Mean(µ) = (4 + 59.5 + 18.9 + 20.85 + 5.25 + 6.05 + 1.0)/7 Mean = 115.55/7 µ = 16.5071 = √( (1/7-1) * (4-16.5071)2+(59.5-16.5071)2+( 18.9-16.5071)2+( 20.85-16.5071)2+( 5.25-16.5071)2+( 6.05-16.5071)2+( 1.0-16.5071)2) = √( (1/6) * (-12.50712 + 42.99292 + 2.39292 + 4.34292 + -11.25712 + -10.45712 + -15.50712)) = √( (1/6) * (156.42755041 + 1848.38945041 + 5.72597041 + 18.86078041 + 126.72230041 + 109.35094041 + 240.47015041)) = √ 417.65461956 σ= 20.4366 Coefficient of Variance = σ/µ = 20.4366 / 16.5071 Coefficient of Variance = 1.238
-
FMEA stands for Failure Mode and Effects Analysis Limitations of FMEA: 1. Ratings might mislead or even Biased :- if all ratings are given in highest[close to highest] possible values, but the actual fault might reside there only. In the scenario it will be impossible to identify the fault. 2. It is always not possible to find out 'what if' in big companies there might have lakhs of discrete components where we might loose the trivial issues. 3. As possible list of failure mode is ever increasing and its only a list not a corrective process to implement. 4. It needs experienced and knowledgeable members to fulfill its goal 5. The more late we start FMEA in the design phase the more weaker it becomes. 6. It requires a detailed analysis and focused to fulfill it's goal or will miss many failure modes. 7. It should have a proper fault detection techniques/processes 8. It should be a top-down tool, not bottom-up a tool or else it will miss most of the important issues. 9. Use of RPN can limit its efficiency. 10. FMEA worksheet's complexity. 11. Huge entries in FMEA worksheet 12. Improper prioritization of risks 13. It needs regular updation, as it is not a static model 14. Costing 15. Dependency on Human diagnosis and management factors.
-
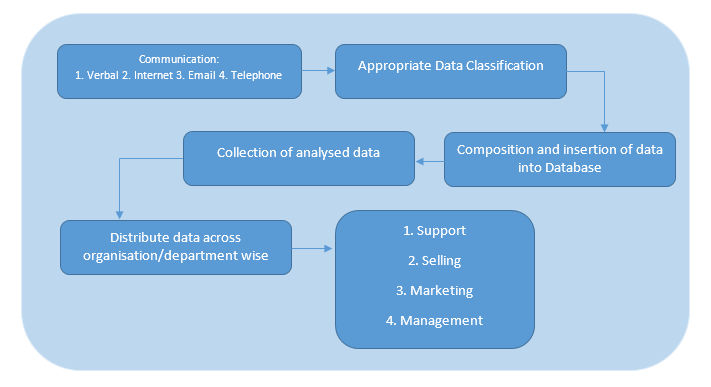
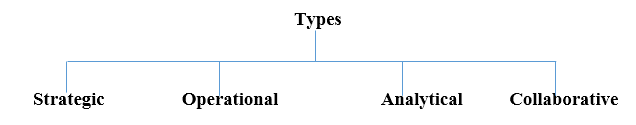
'CRM' is sand for ‘Customer Relationship Management’ While interacting with its customers, CRM is all about – · principles, · practices and · guidelines Organization's view: It includes direct interactions with customers, example: sales & service. Customer's overall experience actually enhanced by CRM. A. Strategic: Customer Centric B. Operational: Integration & automation of Sales/Support/Marketing. C. Analytical: Collect customer’s data & present it to management to take decision. D. Collaborative: include external stakeholders and share customer information throughout organisation. Components: CRM includes 1. Data Warehouse - Centralize customer information 2. Opportunity Management - Track sales opportunities 3. Track & measure of marketing campaigns ) - Track sales opportunities 4. SaaS- Automate marketing interactions 5. PaaS - Provide business intelligence 6. Contact manager system integrating emails, documents, tasks, schedules, faxes etc.- Facilitate communications 7. CCRM (Customer Centric Relationship Management etc. Customer Satisfaction: It helps customer a lot by increasing loyalty and usage behaviour and by reducing customer complaints. Organisation can distinguished profitable customer, integrated across channel assistance, salesforce effectiveness & efficiency, competitive pricing, customised offers/products/services, improved customer service, individualised campaign, single channel association with customer. In practice: a. Call centres, b. Contact centre automation, c. Social media, d. Location-based services, e. Business-to-business transactions CRM market a. Salesforce.com b. SAP c. Oracle d. Microsoft Dynamics (Axapta). Break Down Of CRM: 1. Software 2. Cloud Solutions 3. Management


-
Here is the difference between Lead Time and Cycle Time:- Lead Time => LT Cycle Time => CT A. Although LT & CT don't share same unit both are called “Time.” LT is actually the elapsed or spent time (sec, min, hrs etc.), whereas CT is actually the amount of time spent per unit (min/customer or hrs/part, etc.). It is not meaningful to add/subtract one to/from another respectively. B. CT is actually a count of Throughput (units/period of time), and is the reciprocal of CT. CT is an average value. C. In the entire process, LT & CT, both are related by Work-in-progress (WIP), This is called Little’s Law: D. CT must be the process cycle time, which is actually determined by the bottleneck of the whole process. We need to know WIP, without WIP, individual step's CT cannot be used alone to find out the process LT I think the best description about CT & LT and for some other terms is here: https://hbswk.hbs.edu/archive/hbs-toolkit-basic-operations-self-instructional-workbook#definition
-
In respect to above situation I will choose three option - B. Although there should be an effort to reach zero defects using both top-down and bottom-up approaches, this should not be converted into a slogan for workforce. - As automation is out of question - so to increase workforce involvement, improvement and to set goal the approach should be through out the organisation and as soon as possible, that's why together both the approach will work fast. E. Workforce if engaged in improvement initiatives, can do wonders. While slogans and rigid targets should be avoided, improvements in quality and productivity should still be expected from workforce. - people who are actually working understand the pain or the gaps in between better than others, if that can be identified - yes wonders can happen. F. The ownership for such goals on productivity and quality lies with management and can never be forced as a justifiable target for workforce. - of-course this should be taken care of as automation is already out of question - unnecessary pressure will demotivate workers to delivers their best.
-
-
-
DMAIC 8 Disciplines (8D) Definition D-Define the Opportunity/Problem M-Measure the Current Condition A-Analyze the Data I-Implement the Improvement Action C-Control the Process 0 Prepare for the 8D Process 1 Establish The Team– Define => Identify problem, define requirements, set goal. 2 Describe The Problem 3 Develop the Interim Containment Action and Verification. (ICA) 4 Define and Verify Root Cause and Escape Point(Verify Potential Causes, Select Likely Causes, Potential Cause = Root Cause, Identify Alternate Solutions. MEASURE: Validate process/problem, Refine Goal/problem. ANALYZE: Develop Hypothesis, Identify few most important root causes. IMPROVE: Attack Root Cause, Test solution, Measure result/standardize solution) 5 Choose and Verify Permanent Corrective Actions (PCAs) for Root Cause and Escape Point 6 Implement and Validate Permanent Corrective Actions [PCA](CONTROL- Establish Standard. Measures to Maintain Performance, Correct Problems as Needed) 7 Prevent Recurrence 8 Recognize Team and Individual Contributions Difference/when to use and why 1. Well, the difference is actually in 8D there are 3 more steps, and step 3 is the most important one - Implement and verify interim containment - resulting a false guts/sense that you have solved the issue 2. 8D is short term process, generally some weeks, than DMAIC, generally months 3. DMAIC can predicts the failures too, where as 8D used to correct a process 4. 8D used as a immediate action for a flaw,but DMAIC not. 5. DMAIC is tighter, disciplined method/approach than 8D 6. 8D used to stop the current loss/flaws
-
Voice Of Customer (VOC) always wants cheapest product with highest quality, where Voice Of Business (VOB) is the internal customer who are associated with the business to grow in all possible direction and obviously by revenue. As customer always wants things on cheap rate, here the contradiction starts with VOB. Customer wants things faster and to deliver solution faster its comes with cost, that ultimately comes on customer soldier. Again the contradiction comes. For any service what business provides comes as additional cost to customer which somehow goes against VOC, where customer wants service and quality with cheapest rate.
-
Advantages of Discrete data: Real data comes in discrete form always, real data points can be calibrated from discrete data discrete data can be used by a computer as it works in discrete units. so discrete data are more general as continious time is also discrete time(special case- in the limit as the length of each period approaches zero).
-
Responsibilities of Sponsors: they are leadership team's member. 1.They take decision on projects. 2. They selects Six Sigma projects & project result accountability are on them. Sponsors also have Champions under them. 3. They must ensure process improvements are captured properly and sustained till the end. 4. They articulate problem statement. 5. Define team's objective 6. They provides resources(MBB, BB etc). 7. Sets priority & accountabilities. 8. They must support champions/MBB/BB 9. They sets up high expectations, sets behavioural role model. 10. They must check the knowledge of facts of expert. 11. Checks always wheather the project is at per with departmental and strategical objectives. 12. Checks all the LSS phases and approves accordingly. 13. Checks on timely deliverables and on budget too. 14. Approves change request and removes problems/issues or barriers. 15. Matches the outcome with desired result. 16. Marketing of the same.
-
Its means how much percentage of error we might take. If in any statistical tool its says .05 means the the reault is 95% accurate. Here we take p-value to consider. The smaller the sample size, the harder to get accurate result. Standard of significant is 5%, i.e 0.05. The more sample size the more better result we will get.
-
Yes, I agree with this point, in last few years we have heard so many example from India's two big e-commerce retailers. Example 1: Ms X ordered online a nice clothes for her. She attented marriage ceremony with that dress. Then she returned it, as it was not exact color it was showing in website. And she took refund of the same. The above example is happening very frequently.... Some time wirh dress, some time with shoes, some time with mobile or mobile cover for show or sometime to maintain a status quo. It is not that all customers are doing this kind of thing but some/few are doing these. 2. Some time customer over reacted too. They are raising voice for anything abd everything. 3. Sometime customers even do partiality. 4. Even now a days we have fake customers - we all might know this, one retailer was ordering from another retailer's site and then was not receiving the order or at the last moment was canceling the order. And was raising voice on social media. As a result the 2nd retailer stops taking order from certain region above a specific amount of money or in "cash on delivery" option. In all above situation it incur some cost to company - which is actually loss to the company's balance sheet. Our world has become very much dynamic, we have act very wisely to handle this. VOC is one of the best tool we have but it is also getting misused.
-
-
What is a Checksheet ? A check sheet is meant to record simple facts and statistics that happen on the shop floor/business for over a period of time. It is designed to show the possible source of errors, User can add it and can brainstorm if needed. There are varieties of check sheet - domain wise and Industry wise[examples: - tabular check sheets or tally sheets, location check sheets and graphical or distribution check sheets, Frequency Check sheet, Measurement scale check sheet etc]. I think it depends upon industry to industry – in IT and in some automated industry it became obsolete because of BPM software – which enables more complex data to be recorded automatically. So, chances of human error or reliability or availability of check sheet and its dependency is gone. Due to BPM softwares we can see the data on different business angle in few clicks. Even graphical representation gives a better understanding to common users. Where system is not getting automated ot where BPM software implementation is cost effective there check sheet is very much important. Conclusion: the more automation is going to happen the more check-sheet is going to obsoleted.
-
There is enough information on how and why 5S is effective in manufacturing. While everyone may agree that 5S makes sense in workplace organization even in services, the question is - Does 5S actually save enough money when implemented outside manufacturing? If yes, how? (The 5 S) There are five 5S phases: They can be translated from the Japanese as "sort", "set in order", "shine", "standardize", and "sustain" and 2 extended S . Let’s have a detailed view on each S, which will help us to relate with other industries - 1. Sort (Seiri) Make work easier by eliminating obstacles. Reduce chances of being disturbed with unnecessary items. Prevent accumulation of unnecessary items. Evaluate necessary items with regard to cost or other factors. Remove all parts or tools that are not in use. Segregate unwanted material from the workplace. Define Red-Tag area to place unnecessary items that cannot immediately be disposed of. Dispose of these items when possible. Need fully skilled supervisor for checking on a regular basis. Waste removal. Make clear all working floor except using material. Sort bad and good things. 2. Straitening or Set In Order or Stabilizing (Seiton) Arrange all necessary items so that they can be easily selected for use. Prevent loss and waste of time by arranging work station in such a way that all tooling / equipment is in close proximity. Make it easy to find and pick up necessary items. Ensure first-in-first-out FIFO basis. Make workflow smooth and easy. All of the above work should be done on a regular basis. Place components according to their uses, with the frequently used components being nearest to the work place. 3. Sanitation/ Sweeping/Shining/Cleanliness/Systematic Cleanliness (Seiso) Clean your workplace on daily basis completely or set cleaning frequency time to time Use cleaning as inspection. Prevent machinery and equipment deterioration. Keep workplace safe and easy to work. Keep workplace clean and pleasing to work in. When in place, anyone not familiar to the environment must be able to detect any problems within 50 feet 4. Standardize (Seiketsu) Standardize the best practices in the work area. Maintain high standards in workplace organization at all times. Everything in its right place. Every process has a standard. Standardize color coding of usable items 5. Sustain/ Sustaining the Discipline or Self Discipline (Shitsuke) Not harmful to anyone. Also translates as "do without being told". Perform regular audits. Training and discipline. Training is goal-oriented process. Its resulting feedback is necessary monthly. Self-discipline To maintain proper order Ensure all defined standards are being implemented. Follow the process, but also be open to improvement Two Extended ‘S’ are – 6. Safety & 7. Security Variety Industries with 5S Applications: Industry Sort (Seiri) Straitening or Set In Order or Stabilizing (Seiton) Sanitation/ Sweeping/ Shining/ Cleanliness/ Systematic Cleanliness (Seiso) Standardize (Seiketsu) Sustain/ Sustaining the Discipline or Self Discipline (Shitsuke) Health Care [Delivers health care services] Helps for searching for medicine or for operation tools or other needed things Helps to maintain a relational order say for operation first knife then splitter then cutter then stitching tools Cleaning in proper way so that no germ will be there To set a process how to do when to do a certain thing like operation sugar level/pressure level should under control After operation maintain the situation so that patient improves Education[Delivers Educations] Sort all those material what are the thing to be in syllabus Order those material in related order or chapter wise Maintain cleanliness and a clean environment for study Maintain standard for teacher /study material/students Maintain a good environment for study and a good track record of student which will glorify your institute name Government[Delivers work/services to society] Sort out priorities to work on Order those priorities for implementation, Example: road work Maintain a clean audit book Example: road cost/deadline etc Set a benchmark to achieve. Example: road – durability Maintain the implemented state as much as possible. Example: maintain pothole free rode Information Technology[Delivers services/applications] Sort out priorities to work on as per client’s need Order those so that it can comply with client’s need Maintain a clean code base/clean service Set a benchmark of code/ service/ product to deliver Maintain the product/service such a way so that it continues to deliver as estimated Here, I just gave few example of industries where 5S can be applied, actually 5S can be applied with most industries [which is related with any kind of DELIVERY] with little tweak as per the industry needs like ceramic industry etc . Courtesy: Wikipedia and Google
-
Well, this is the question which was pinching me from long back and I forgot to ask while I did my BB :p. Observation:- What I observed is that it a very old controversy. Few experts said YES, it will stop innovation, few said NO! My Thinking:- Actually, I think there isn't a clear-cut disjunction between innovation and Six Sigma processes say, operational excellence. There must be balance or else the firm will result in bureaucracy or anarchy. If we take the concept of an innovation fulcrum. Imagine the value chain of product development, marketing, operations, and customer service. If product development is uncontrolled in their quest to grow the top-line by "pushing" new products, then complexity grows. Like, for each new product, we will need a new production line to be created, marketing and PR teams mobilized, and customer service enabled -- all at the product level, to support the products. Indeed, all the "downstream" work and added complexity will increase the product costs than revenue. Lean & Six Sigma seek to identify waste, variation, and unnecessary complexity and reduce or eliminate it. This goal can be a great thing for any firm, upstart or mature. So, I think the controversy persists because of the lack of specific definitions for both of these terms Innovation is vague because it was raised that way: the specific eureka moments, the right-brained child, etc. Innovation might change person to person. One very necessary characteristic of the definition of innovation from my point of view is - it must come up with a significant improvement in the process/new creation to the process/people/society/subject. When a process reduce time from 90000 to 90 hrs as per my view its innovation, if it helps some process/people/society/subject. On the other hand, in innovation also we need some structure, if a process is certain, repeatable, reliable & predictable. And if we are speaking about structure - structure connotes Six Sigma. So, one leading to or needing the other. The definition of Six Sigma is also as hazy as that of innovation. "The dumbing down of Six Sigma is real, and Six Sigma does not mean the same thing today for many companies as it was originally intended. According to Mikel Harry, a legitimate founder of Six Sigma, Six Sigma was designed and introduced to generate breakthrough improvement. And that is going to require innovation". Attaining a certain percent time, say, 20 percent reduction in cycle time, for example, is not what Six Sigma is all about. "Six Sigma is about doing things significantly different in order to achieve breakthrough performance levels“. And that will require innovation. If Six Sigma did not mean innovation, Motorola, Amazon.com, Toyota, Mckinsey and, now eBay would not be around today and neither would Xerox, amongst many others. From a pragmatic point-of-view, both work together quite well. Some organisation/people may have generated their own definition of Six Sigma and maybe don’t really know what Six Sigma is all about. Or, perhaps, Six Sigma might have descended upon their domain and imposed some accountability. Here we need a clear balance in between. Six Sigma Needs Innovation, and Vice Versa, with proper leadership. Leaders must nurture the conditions needed to derive the combined power of Six Sigma and innovation and when they are united, innovation and Six Sigma are an unbeatable force Courtesy: http://willprice.blogspot.in/2007/07/3m-six-sigma-vs-innovation.html https://www.processexcellencenetwork.com/innovation/articles/six-sigma-and-innovation
-
Kaizen(change + better) Kaikaku (change + revolution) Kakushin (new or innovation + revolution) Definition Kaizen => Kai (change) + Zen (better) => Change for better. It is Small incremental changes for continuous improvement / evolutionary improvement. Kaikaku => Kai (change) + kaku (revolution) => Change for revolution. More radical, step changes needed to improve the process/business on existing system Kakushin => Kaku (revolution) + Shin (new or innovation) When we need about innovation, reform, transformation and renewal from present situation. Some change will form a complete departure from the current situation. Description Those activities which helps organisation to improve a process or business constantly. Improvement / continuous improvement Implement 5S and removes 7+1 types of Muda/waste In a process or business where transformations needs a big/global redefinition of the system. Transformation / reform / big improvement Allows organisation to reform and transform their culture and work habit Those discoveries that allow changing the status quo of a business. innovation / reform / renewal Allows organization to adapt with new changes/ new things Process to Follow/ Steps 1. Identify an opportunity. 2. Analyze the process. 3. Develop an optimal solution. 4. Implement the solution. 5. Study the results. 6. Standardize the solution. 7. Plan for the future. 1. Set based 2. 3P Kaizen 3. Plan Execution 4. Lean Transformation Support DMAIC Example Update in current software Change both the technical basis and functionality in current software Create new software on the basis of new technology and new business process Comparison 1. Took less time 2. Less costly 3. Continuous process 1. Takes more time than Kaizen 2. More costly than Kaizen 3. Non-Continuous 1. Takes more time than Kaikaku 2. More costly than Kaikaku 3. Non-Continuous How do they complement each other? In any organization Kaizen is the integral part by which we keep the continuous improvement. When we need any big changes to adapt say like in car industry we are moving from LIQUID fuel to GAS/CNG to ELECTRIC car, then we are choosing Kaikaku. But when a car company going to open a new segment say SUV or more luxurious car segment they will choose Kakushin. So if a company want to survive and want compete in each section these three are clearly complement to each other. What would a company lose if one of these as a concept was not utilised? Well change is the only constant in life, if we believe it then we have improve ourselves to everyday, everywhere to survive or to stay up to date. If a company don’t change themselves with Kaizen they will become static/monotonous and loose its charm will lead to death eventually. If we don’t adopt with new things/changes, i.e Kaikaku then we will become like Kodak a certain death. If we don’t adopt with new innovative changes i.e Kakushin, like ”man power to computer/automation” will not be able to survive eventually, until a better competitor comes to market, like JIO comes with “internet data” with 4g technology in India.

-
What is your view on this? Is measurement essential for good management? Why? Why Not? Well, I firmly believe that Mr Drucker is right. If we cant measure we fails almost everywhere- because there will be no mathematics, no statistics, no prediction at all. All we will have is pure GUESS on GUT feeling. Measures of data/measurement gives us a fair guess of a situation and depending upon that today we are sending rockets to other planet. What did Edward W Deming mean by his statement? As per my understanding what Dr Deming is not wrong either, what he wanted to convey is - don't just take decision on the basis of data, consider situations beyond that which is unknown and unknowable, so that, if my mean get shifted still my system will have a fair chance to deliver as per specification/requirement. That is be ready for new challenges where you don''t know what might happen. And here comes the the question of "vision" of management someone who can see future and as per that can take decision. As a example, where other Indian Telcos were fighting for tariff plan, JIO changed the whole scenario/perpective biding on "internet data". Normal/mediocre management of other companies were taking decision based on data, they didn't saw the scope, with LESS or NO vision to think/see beyond. Conclusion: It might seems that both the quotes are conflicting, but in actual these two are complementary to each other.
-
Given Possibilities:- A cause may be necessary but not sufficient for a problem to occur. A cause may be sufficient but not necessary for a problem to happen. A cause may be neither sufficient nor necessary for a problem to occur. A cause may be both sufficient and necessary for a problem to occur. First I will try different RCA techniques Like Pareto and data Analysis, brain storming, Fishbone Diagram or 5 whys, Fault Tree Analysis if I get point D situation I will go for Improve and Control section. If not, like the rest three cases, 1. Will analyse data with scatter charts, Pareto charts, affinity diagrams or histogram properly. 2. Then will go for 5 why/Fish-bone/Fault Tree analysis to eliminate the root cause 3. We might take help six thinking hat or theory of inventive problem solving or systematic inventive thinking and then a tree diagram or force field analysis to implement solution I will follow this: Image Courtesy: http://www.variation.com/6sigma/processes/problem_solving.html

-
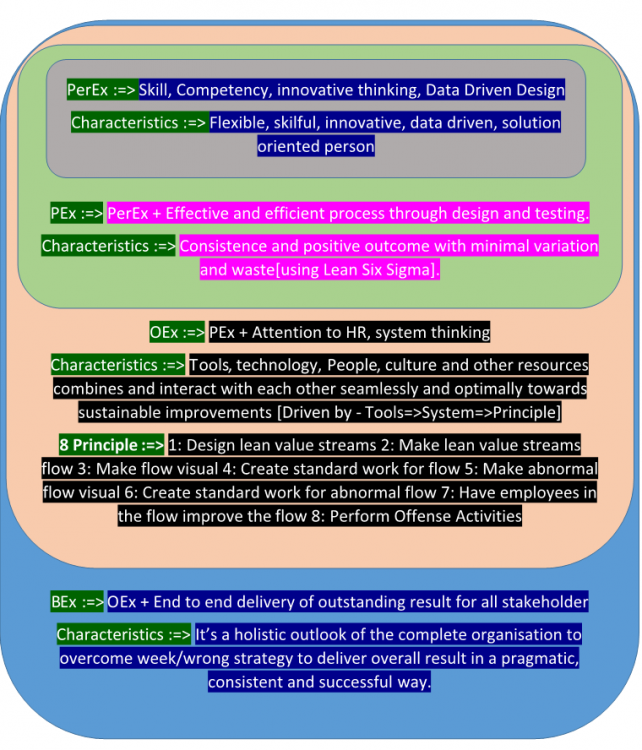
Exc1.docx Venn diagram of PerEx, PEx, OEx & BEx Personal Excellence – PerEx, Process Excellence – PEx, Operational Excellence – OEx Business Excellence - BEx