
Topics
-
OpenAI, which is expected to need about 3,200 megawatts (MW) of power for its new facility, has agreed to provide up to 1,000 MW to the Southern Co subsidiary Georgia Power's systems in times of high demand. View the full article
-
The affected startup, Hugging Face, said it had turned to Zhipu AI's open-source GLM-5.2 model last week to analyze data from the hack after leading US AI models declined the task, unable to distinguish between a defender and an attacker. View the full article


Leaderboard
-
Kaviraj
Members1Points10Posts -
Rahul.Arora2
Members1Points44Posts -
Soji Sam
Members1Points10Posts -
Ashish Kumar Sharma
Members1Points10Posts


Popular Content
Showing content with the highest reputation on 09/06/2022 in all areas
-
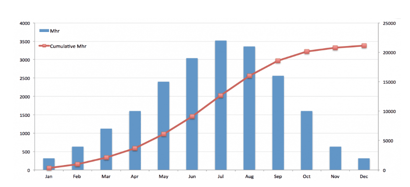
1 pointWhat is an S-curve An S-curve is a mathematical graph in project management that represents relevant cumulative data for a project, such as cost or man-hours, plotted against time. The shape of the graph often forms a loose, shallow "S," thus the name "s-curve." In project management, an s-curve is commonly used to track the progress of a project. In today's fast-paced corporate environment, keeping a project on time and on budget is critical to its success. Because project development is typically modest in the early phases, the s-curve frequently takes shape. The wheels are just starting to revolve; team members are either researching the industry or engaging in the initial phase of implementation, which can be stagnant while working out the problems. Below image is an example of S-curve graph - As progress is achieved, the rate of growth accelerates, forming the upward slope that forms the center half of the "s." The maximal point of growth is referred to as the point of inflection. During this time, project team members are putting in a lot of effort on the project, and many of the big expenses are incurred. The growth continues to plateau beyond the point of inflection, generating the top half of the "s" known as the upper asymptote—and the "mature" phase of the project. This is because the project is nearing completion and is winding down – normally, just finishing touches and final approvals are remaining at this stage. Common Uses S-curves are commonly used to track progress, evaluate performance, and estimate cash flows. An s-curve is useful for tracking project progress since real-time cumulative data of various project variables, such as cost, can be compared to planned data. The degree of alignment between the two graphs reflects the development of the element under consideration. If modifications are required to get back on track, the s-curve might assist in identifying them. S-curves can be used for a variety of purposes during the life of a project. The following are some of the most important applications of s-curves: Performance and Progress Assessment Cash Flow Predictions Comparison of Quantity Output Types of S-Curve The s-curve can be of different types, such as: Baseline S-curve - This s-curve depicts the expected development of the project. A baseline s-curve is the s-curve drawn from the schedule. Target S-curve - After the project begins, changes to the baseline schedule are common. The amended schedule is referred to as the production schedule, and the production schedule is the same as the baseline schedule at first, but it varies as the project continues. The production schedule reflects the project's actual progress and can be used to generate a target s-curve. Costs Vs Time S-curve - The costs vs. time s-curve is useful for projects that incorporate both labor and non-labor expenditures such as subcontracting, hiring, and material supply. It displays the overall cost incurred during the project's life cycle and may be used to determine project cost and cash flow. Value S-curve - Value s-curves can be used to compute the number of man-hours or dollars spent thus far, as well as the number of man-hours or dollars required to complete the project. Percentage S-curve - Percentage s-curves can be used to examine the planned vs. actual completion of a project, as well as the project's percentage growth, contraction, and so on. Man-Hours versus Time S-curve - The man-hours vs. time s-curve is appropriate for labor-intensive projects since it displays the amount of man-hours spent on the project over time. The man-hours are the sum of the personnel required and the number of hours required to complete the work. Actual S-curve - The production schedule is continuously altered during the project's lifespan. These updates provide the completed work's data, which may be used to create an actual s-curve. This s-curve depicts real progress, but it may be compared to the intended baseline s-curve to assess performance. Project example where S-curve can be used - For an example, the progress of construction of a commercial building can be summarized in S-curve, but we will certainly have individual S-curves for tracking various activities. As a construction project manager, you must ensure that the project is completed on time and within budget. You must have complete control over the project's timing and budget in order to do this. Strong control over a project requires clear visibility of how the project is progressing and where it is headed. A construction manager can use an S Curve report to keep track of - Actual progress timeline versus planned schedule Actual costs in comparison to budgeted costs Actual expenses against actual progress - this is a productivity metric. Based on the project schedule, a projected S Curve can be produced before the project begins. First, a timeline is created for each project activity. This shows the activity's cumulative progress over time. The progress of all actions is then evaluated as a weighted average versus the timeline. A planned S Curve is formed when these cumulative progress numbers are plotted as a curve against time. When the project begins, you may create an S Curve for real project progress using actual cumulative progress data rather than projected progress. The green curve in the illustration above represents it. When work on the project begins, the construction crew sends in progress updates. This progress information is updated in a S Curve report. So, at any moment, you may access the S Curve report to learn where your construction project is in terms of progress, expenses, and productivity (or profitability). This provides you with real-time visibility into how your project is progressing and where it is heading. You will then have complete control over those projects.

 1 point
 -
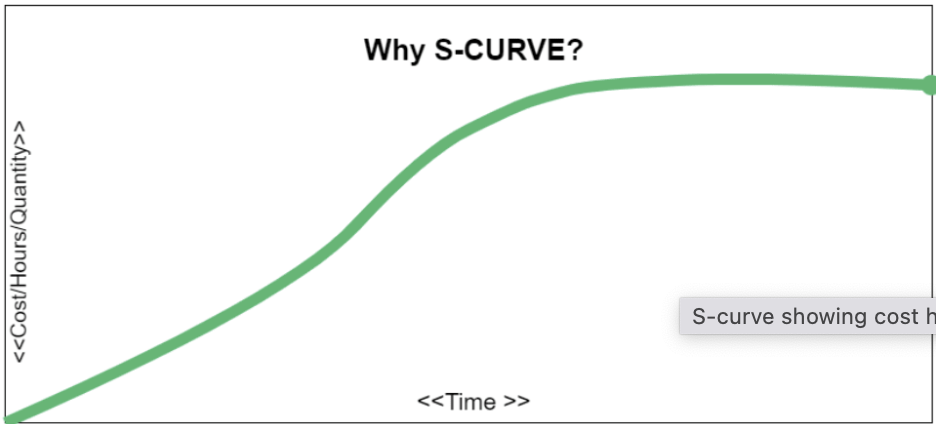
1 pointS Curve – Project Management Background and Need Project Management is a strategic initiative of any organization and has focus and attention of entire leadership and stakeholder. It is not just about the expected impact from Transformation but also about the risk associated with Return of investment while prioritizing ideas that influences stakeholders to invest in the project. Hence effective governance and communication of Project Milestones, Investment, Timelines - planned vs actual analysis takes the center stage. Stakeholders are focused on investment made, planned and related outcome whereas Project Management Organization should have their focus on execution, analysis and proactive communication. When it comes to Project Analysis and Communication, while there are many visual tools and techniques to visually monitor and communicate Project Progress, S Curve stands out and serves to be a perfect tool to showcase comparison of important data sets of a project with Timelines. In simple words, S Curve allows the Project team to monitor project progress at a high level. It is a graphical representation of how the project is trending compared to plan for identified lever and in respect to Timelines. WHY an “S” Curve? Typically, all Projects have a slow start where core teams are formed and stakeholders get on boarded, more of planning stage and less of doing. Investment are needed more as execution begins (point of inflection) and slows down as the project reaches its end stage. Here investment might be Man hours, quantity inventory, Machine deployed etc. show cased cumulatively on Y axis and Timelines is always on X axis. The graphical image is very similar to the Alphabet S and hence it is called as S Curve. Types of S Curve? S Curve is may be used to show case: 1) Target Stage (Milestones) 2) Cost invested 3) Growth, Revenue 4) Man Hours invested 5) Baseline vs Actual Comparison All of the above levers are displayed on Y Axis and Timelines is always shown as X Axis. Uses of S Curve 1) Performance Evaluation and Stakeholder Communication: A lot of performance discussion are around the progress made against the commitment. Often there is an element of best in class and past performances that works like a Benchmark. S Curve has the capability to display Actual, Benchmark, Target and Future forecast in the same graph and displayed against the timelines. It sets the tone around how good or how far the project performance is. 2) Forecasting: The Management team while evaluating progress, would also want to have a close look on the next stage investments and obviously be comfortable with the planning around it. S Curve can showcase the trend around the forecast. Example, S curve can showcase how many man hours are deployed as on date and how much is the expectation for coming month / quarter. Human Resource team would relate to and own the plan well to ensure in time availability of labor. 3) Project Management Organization The PMO team can effectively use S Curve to strategize next steps along with various possibilities. A combination of levers in S Curve graph is a fantastic medium to get a direct representation on the gap in performance, management can identify various possibilities to influence the outcome. It is also called as Banana Graph. 4) Baselining and Growth S Curve in Project Management supports estimating time, cost, material, data to be mapped with expected outcome and often against the best in class. It promotes discussion around what is needed to influence the change rather than reactions and explanations around the delays. 5) Determining Slippage There are often differences observed between the schedule start, baseline and plans for end of the task. This difference is monitored effectively via S Curve and hence reduces the chance of surprise outcomes. Limitation and Conclusion S Curve aids more like a descriptive tool unless it is complemented with a team that can comprehend decisions and tap the variances. S Curve is dependent on the Project team to go deeper and understand the root causes to deviation between actual and plan. But that’s the basic characteristic of most graphical tools. The S Curve is not a great serve to investments in new areas example new software technology replacing old configuration. Project Management requires a lot of matured strategic base in the organization, from winning stakeholders trust to deliver and meet the expectations. Hence it is inevitable for team to track multiple parameters and scale them up to past performance as well as planned future. S Curve is very helpful in displaying the progress and invites comparison. It is a great tool to track cost in comparison with timelines and most of the projects fail or get discarded due to failure in comparing the actual with plan and in time re addressing the execution plan. It is a great way to convince stakeholders and get sign off on future budgets.


 1 point
 -
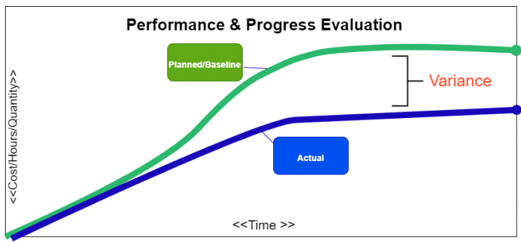
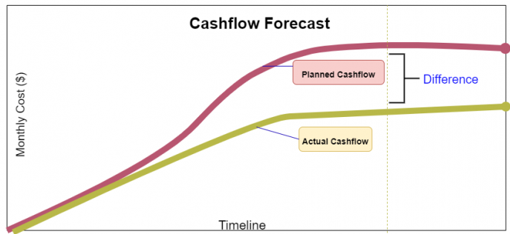
1 pointWhat is an S Curve in project management? Elaborate on its various uses along with an example. In project management, an s-curve is a mathematical graph that portrays relevant cumulative data for a project plotted against time to visualize the progress of a project over time. Visually it is not a proper S-shape but a loose shape that develops slowly at the start of the project (Like a straight line), whereas it grows rapidly when the project progresses. Several internal and external factors throughout the project’s life cycle will impact the shape of an S- curve graph. Types of S-curves: Though a wide variety of s-curves, can be used in project management, some commonly known types are, · Target S-curve · Costs versus Time S-curve · Value and Percentage S-curves · Baseline S-curve · Man-Hours versus Time S-curve · Actual S-curve Common uses of the s-curve in project management: In the project lifespan, s-curves are used for numerous different purposes some of the most important uses of the s-curves are discussed below: 1. Performance and Progress Evaluation First and foremost, S-curves are used to evaluate the project’s progress and performance with respect to the plan/schedule. This is achieved using the concept called Earned Value Management. S-Curve graphs are traditionally generated as a part of the EVMS process and are the basic platform for the evaluation of the project’s progress and performance. There are so many factors that need to be evaluated to find out the current status of the project and future forecasts about the project. They are: PMB - Performance Measurement Baseline, also known as Planned Value. Earned Value. Actual Cost. All the above-mentioned factors need to be compared with the planned S-curve to generate results. This comparison will be very much useful and compelling because when we want to know whether the project is exceeding the budget? or any tasks are behind the schedule? we can glance at the graph, and it will immediately answer our query. 2. Cash Flow Forecasts Another benefit of the s-curves is the development of Cash flow and the prediction of the changes that the cash flow would bring. In detail, Cash Flow is the timing and movement of the cash with respect to the tasks and events that occur during the project execution. This cash flow curve is useful for the stakeholders/sponsors/investors. The most significant advantage of drawing a cash flow curve is that we can evaluate the need for cash and the timing when the payment is due with respect to the obligations agreed by the company. 3. Quantity Output Comparison Another significant use of the s-curves is to estimate and quantify the output that the project will yield. This quantity output comparison is used more prominently in the field of construction and manufacturing industries. 4. Schedule Range of Possibilities, (Banana Curves) T his type of s-curve is also known as the Banana curve which consist of two "S" types of curves. First, the upper limb is made according to the earliest time of the project plan. Second, the lower limb is made according to the latest time of the project plan. These 2 types of s-curves usually overlap at the beginning and at the end of the project. The shape they form looks like a banana. This is probably one the most significant use of the s-curves and the project schedulers can easily sum up the s-curves using the parameters like, Quality Man-hours Cost The banana shape curve tells us the range of possibilities & when we can expect the project to be completed. Conclusion Project management is a very complicated business nowadays since many factors must be monitored if one wants their business to be successful. These factors need appropriate tools and parameters, and the s-curve is just that.


 1 point
 -
1 pointS-Curve is a useful tool for project managers in order to see the progress of a project at a high level.It is basically a mathematical graph that represents the critical data for a project. The information plotted on the graph typically consists of project cost or the number of hours worked compared against time. It is known as S-Curve as the the shape of this curve resembles the letter ’S’. A typical S-Curve is as shown below:- As you can see from the above curve, at the start of a project, the progress is slow & looks more of a straight line as more time is spent in planning & once the project is in full swing, the growth in project activity gets significantly higher & the middle part tends to be steep curve upwards & the point of maximum activity is commonly known as inflexion point. As the project move towards closure, the curve levels out & resembles a shape close to a flat horizontal line. Below are the various uses of an S-Curve in project management:- A project manager can monitor real time cumulative data pertaining to various project elements & compare it with the projected data. During the project lifecycle, he/she can plot the actual resource use & can see how well it matches what’s expected. In case there is a gap, there is an opportunity to make appropriate adjustments. It helps to make budget planning & resource allocation more accurate as plotting the S-Curve indicates when you expect the project to be the most resource intensive. Also it will be easy to communicate to the stakeholders in terms of resource provision such as budget or manpower. It helps in visually engaging the stakeholders & explain to them the pace of work throughout the different stages of a project & also keeps the team members calibrated in terms of deliverables for the project they are involved. Once the baseline S-Curve is created, we can vary the inputs in order to identify their impact on the project thus helping us to plan for different scenarios. Here 2 curves are created that join the start & finish & is known as banana curve. This indicates how much float is there in the schedule in case things change during project execution. Thus we can plot the actual work delivered against the banana curve. If the data points are close to the latest date curve, one can flag the risk of delay in the project & thus prompting the project team to take action accordingly. This scenario is as shown below:- Thus to summarize, an S-Curve graphically displays cumulative parameters plotted over time. The typical parameters that are monitored include Man-Hours, Cost, Progress & utilization of these parameters is represented as shown below:- Let us also look at typical example where we can leverage S-Curve:- Let us consider a scenario where a vacation rental company is slated to launch an important policy change at a designated date to its platform users, since the timelines in this case are non-negotiable due to the leadership commitments done to the users, thus tracking the actual timeline of execution of tasks pertaining to the change as against the projected timelines becomes critical. Here S-Curve will help to monitor any potential delay so that prompt action can be taken to bring the project on track.

 1 point
This leaderboard is set to Kolkata/GMT+05:30