
Topics
-
Jeff Bezos is pushing Prime Video's overhaul to highlight Amazon's AI. The project, known as Lighthouse, aims to showcase AI for millions of users. This initiative seeks to elevate Amazon's standing in the competitive AI landscape. New features will improve content recommendations and respond to spoken requests. Bezos' personal involvement underscores the strategic importance of this AI integration. View the full article
-
Advanced Micro Devices is launching new artificial intelligence hardware on Thursday. This new hardware aims to compete directly with Nvidia's offerings. AMD is targeting the growing data center inference computing market. The company also announced significant deals with AI labs Anthropic and OpenAI. These agreements position AMD for substantial future revenue in the chip sector. View the full article


Leaderboard
-
Vishwadeep Khatri
Administrators1Points6,727Posts -
Mohamed Asif Abdul Hameed
Fraternity Members1Points78Posts -
Venugopal R
Members1Points238Posts -
Natwar Lal
Members1Points50Posts


Popular Content
Showing content with the highest reputation on 09/27/2019 in all areas
-
1 pointIf you are looking for a short answer, read Natwar Lal's response. If you want to go deeper and need to consider more details, read the response by Mohd Asif, Both Natwar Lal and Mohd Asif are winners for this question. Do read Benchmark Expert Venugopal's view which is apt for professionals who are equipped with Lean Six Sigma qualification.1 point
-
1 pointBenchmark Six Sigma Expert View by Venugopal R While the respondents can approach this question from various angles, let me ride upon the principle of control chart to address the discussion on outlier. The control chart is a wonderful tool that helps us in monitoring process stability. To build the limits of the control chart we usually take data points from a process that is considered statistically stable – and the plotted data will determine its own control limits. While the control limits are formed, we would expect all the data points to be contained within the limits – any point that fall outside indicates a high likelihood that it does not belong to the population and is considered as a outlier. Many of you will be aware that there is a practice known as ‘control chart homogenization’, where we remove the outliers and re-calculate the control limits. In the case of charts such as X-bar R charts, where range charts are available, the outliers need to be removed from range chart first and then check whether the data gets homogenized. From the above practice, we can see that for making the data “statistically pure”, we have to ignore the outliers and recalculate. (Here too, we cannot keep removing the outliers beyond a certain point!). The objective here is to establish the mean value and control limits that are representative to the population and may be used for future process monitoring. However, if we are viewing the control chart for improving the process, the first step is to examine the stability of the process. More the outliers, more the instability. Then, the outlying data points need to be analysed to understand their cause, even if there are outliers on the ‘favorable side’ of a control chart. The ‘abnormal’ conditions that caused an outlier could also be a measurement error, that needs to be identified and corrected. For example, if we are studying the pattern of the quantum of fuel being purchased per day for cars from a fuel outlet and we start collecting data for a 3 month period. In between, if there was an announcement for fuel price increase, we will can certainly expect and high outlier point on the day prior to the hike and subsequently a dip, or low outlier immediately after the hike was announced. Such outliers with known reasons may be ignored for our study. To summarize.. In general, outliers are important information that help us identify a problem, (or sometimes a very favourable condition) and need to be examined in detail. Where our interest is to understand the statistical distribution of a set of data (either to set a baseline, or to validate an improvement), we may not want to get biased due to few stray outliers – hence we may exclude them from our calculation with discretion, though we may still analyse them. While monitoring a process, If we know the exact reason of particular outliers and such reasons being very extra-ordinary and usually not in our control, we may exclude them from to prevent mis-representation of a normal situation.1 point
-
1 pointOutlier – is a data point that is significantly different from the rest of the data point. Another definition of an outlier is a data point that significantly varies from the distribution of the data set. It is a common phenomenon to get outliers in any data one collects. There can be many reasons for outliers in a data set. Some of the more common reasons are as below 1. Experimental error 2. Measurement system error (either the gauge gave an incorrect reading or it was noted down incorrectly by the operator) 3. Data collected from 2 or more distributions 4. Special Cause occurrences or anomalies 5. Attempts of fraud Outlier management may be a thesis topic in itself. However, I will try to keep it simple and practical here How to identify the outliers 1. Box Plot: It is the most common method to identify the outliers. An outlier will be marked in * in a box plot. These star marks are observations which are smaller or greater than 1.5 times IQR (Inter Quartile Range) 2. Control Charts: Any point outside the control limits is considered as an Outlier. Applying Nelson rules, one could also identify the unusual observations though these may not be significantly different from the rest of the data points 3. Modelling (like Regression Analysis, Probability distribution fitting etc.): whenever a model or a probability is fitted using historical data, it lets us know if there are any data points that do not fit the model. Usually such data points are outliers in the dataset which do not follow the fitted model There are other statistical methods also to identify the outliers in any data set. The ones listed above are the basic ones. What to do if you encounter an outlier? First do not panic And I write this because I have seen people panicking about outliers in their data sets. Getting outliers in a data set is not an outlier (it is very common) Second, take a structured approach to resolve the Outliers 1. Find out the reason for the outlier. Best and the easiest method is to do a 5 Why analysis 2. Determine if the root cause is a part of the nature of the business or process (say a seasonal or cyclical effect etc). One will need common sense and business knowledge for this determination. If one does not have either then it is advisable to work with an SME while doing this step. E.g. – the daily transactions during a month end show an unusual spike. However this spike is in the nature of banking business. Compare it with spike of transactions that happened due to demonetisation (Demonetisation is not the usual nature of business) 3. If the root cause is part of the nature of business, then the Outlier CANNOT be removed from the data set. Removing such an outlier would result in undesired data modification. If the outlier cannot be removed from the data set, then there are two possibilities a. Outlier is beneficial for the process – in which case the root cause for the outlier should be replicated b. Outlier is bad for the process – in which case the root cause for the outlier should be eliminated from the process (eliminating root cause is different from removing the data point. Elimination would ensure non recurrence of a bad outlier) 4. Alternatively, if the root cause if not part of the nature of business, then it may be EXCLUDED. It can be done in following two ways a. Trimming i.e. deleting the outlier from the analysis b. Winsorising i.e. replacing the outlier with the border case values (these border case values are not outliers) If there is outlier or any data point that is excluded or winsorised, it should be clearly called out in the reporting1 point
-
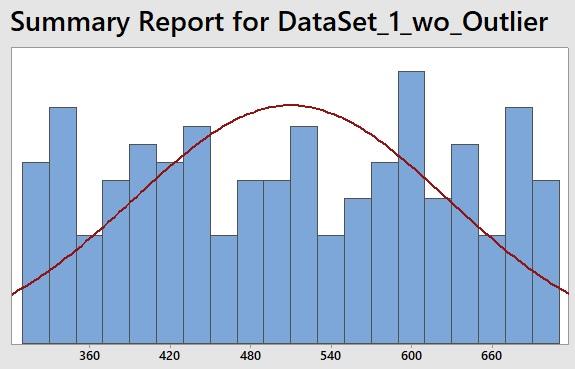
1 pointOutlier is Anomaly, an extreme observation. It is any observation that is outside the pattern of the overall population distribution. Simply any data point that is more than 1.5 * IQR, either below the First Quartile or Above the Third Quartile. Many a times, the indication of outlier is considered as mistake in data collection and it can skew the statistical relationship. However, we could get an outlier because of the following reasons: Data entry/Type errors Measurement errors Experimental errors Intentional/dummy data Data processing errors (due to formula) Sampling errors Natural (not usually an error, it could be novelties in data) We can find outlier by, Foremost, when we use common sense Visually find the outlier (Graphical Summary out help to find outliers, or boxplot / scatterplot) Using statistical tests (There are many tests to find out outlier, listed below are few) Grubbs test for outliers (also called extreme studentized deviate) Dixon Q test for outliers Cochran’s C test Mandel’s h and k statistics Pierce’s criterion Chauvenet’s criterion Mahalanobis distance and leverage Methods of detection includes: Z-Score / Extreme Value Analysis Probabilistic and Statistical Modeling Linear Regression Models Proximity Based Models Information Theory Models High Dimensional Outlier Detection Methods In SAS, PROC Univariate, PROC SGPLOT can be used to find outlier. Statistical Tests can be used to detect an Outlier. However, it should not be used to determine what to do with them! (Ignore / Remove). One should have a good Domain Knowledge when Analyzing Outliers. Below is the example data set with Outlier and Without Outliers: Data set with Outlier Data set without Outlier We could have either have Univariate or Multivariate outlier. Univariate outlier: Data point with outlier on one variable Multivariate outlier: Combination of outliers on at least two variables Other forms of Outlier includes: Point outliers: Single outlier Contextual outliers: Can be noise in the data Collective outliers: Can be subset of uniqueness in the data (novelties) We can ignore outliers when, it is Bad Outlier, and We know that it is wrong data (Common sense) We have big data set (ignoring outlier doesn't matter at this situation) We can go back and validate the dataset for accuracy When the Outlier does not change the result, however influence change in assumption When Outlier influences both result and assumption, it is better to run analysis with and without outlier (as we are not sure whether it is because of mistake or misclassification of the data). Post analysis investigating both results to find the significance is minor or major. When outlier is a data from an unintended population We should not ignore outliers when, it is Good Outlier, and Results and outcomes are critical We have too many outliers (Usually when it is not unusual) Before Ignoring we will have to run through this checklist (for cautious and safe removal) Is Outlier because of data entry typo error? Identified Outlier value scientifically impossible? Assumption of Gaussian distribution on the data set is uncertain? Is the Outlier value seems to be scientifically interesting? Do we have substantial information about Outlier that we need to retain it? Are there any special circumstances / situations / cases for the data points? Are there any potential measurement errors? Under multi Outlier situation, can Masking be a problem? (In Masking - "outlier” is not detected) If the Answer to above questions is No, then Either, (Situation A) the so called, outlier, could have resulted from the same Gaussian population, it is just that we would have collected the observation from either the top/bottom tail of the population data. Or, (Situation B) the identified outlier, could be from different distribution. However, we would have collected the data due to mistake or bad sampling technique. For Situation A, removing outlier would be mistake For Situation B, We can remove the outlier cautiously Removal of Outlier can be dangerous. However it may improve the distribution and fit, but most of the time some important information is lost. So Points to remember, if we remove outlier: Trim the data set Do Winsorization (Replace outliers with nearest good data) Transform the data, Discretization Top, Bottom and Zero Coding Replace outlier with mean / median (Extreme Outliers will influence Mean, but not he Median; Ref to below example), random Imputation While we run Experiments and observe many Outliers in the data, we should repeat the data collection instead of simply removing them and when the Outliers are significant, then consider using Robust Statistical Technique. Outliers are not always bad data points, however, when the data set is small, then outlier can greatly influence the data statistics (We could have Skewed data, inflated or deflated means, distorted range and type I and type II errors). So it is better to do through investigation and also have background domain knowledge while performing this analysis. Case to case the analysis differs and based on that we should take cautious decision whether we have to Remove, Keep or change the Outlier.

 1 point
This leaderboard is set to Kolkata/GMT+05:30