
Topics
-
Humanoid, a UK robotics firm, secured $152 million in Series A funding. This investment fuels the development of next-generation platforms and proprietary AI software. The company plans beta robot deployments at customer sites later this year. Humanoid has established partnerships with major technology and manufacturing companies. Bosch will serve as the contract-manufacturing partner for the new robots. View the full article
-
German authorities warned Tuesday of the "growing influence" of AI and digital technology on the sexual abuse of children, saying in a report that criminal abusers are increasingly using those tools. Sexual abuse of minors is "increasingly shifting to the digital realm," driving overall statistics "upward", said Holger Muench, the head of Germany's Federal Criminal Police Office (BKA). View the full article


Leaderboard
-
Shraddha Sequiera
Lean Six Sigma Black Belt2Points10Posts -
Rahul.Arora2
Members1Points44Posts -
Soji Sam
Members1Points10Posts -
Ashish Kumar Sharma
Members1Points10Posts


Popular Content
Showing content with the highest reputation on 09/13/2022 in all areas
-
2 pointsPMP DMAIC Comparision Project phase Typical artifacts Project phase Typical artifacts Initiation Business case Define phase Project Charter PMP uses various documents in the initiation phase DMAIC model uses a Project charter which covers business case, vision and team details along with emphasis on dollar saving or impact it would make for that specific project project. Project vision statement Value Stream Map VSM help us understand the entire process and understand the current process v/s future state that we anticipate it to be Project charter Roadmap Team charter Planning Assumption log Measure Process Maps Capability Analysis Pareto chart PMP may have a list of artefacts to be created but for DMAIC project the artefacts list is fairly simple. During the planning stage of PMP and Measure stage of DMAIC we create documents to record the activities performed, ability of the process to meet the client standard and record any variations Risk register Issue register Change log Stakeholder register Comms management plan Release plan Scope management plan Test plan Quality plan Logistics plan Work breakdown structure Analyse & Improve Root Cause Analysis Failure Mode and Effect analysis Variation charts Kaizen events The data gathers in the measure phase to used for further analysis to identify the main causes and assess any risk that could be mitigated or accounted for. We will aslo use the data to assess the level of variations in the X that we have which can be tracked through variation charts, and other data points dereived from baseline studies Product breakdown structure Organizational breakdown structure Risk breakdown structure Budget baseline Milestone schedule baseline Scope baseline Performance measurement baseline Gantt chart Requirements and requirements traceability matrix Execution Dashboard Flow charts or process maps as needed MOU, contracts and agreements (but could be earlier in the life cycle depending on the type of vendor) Monitoring and Control Quality report Control Control plan 5 S Poka Yoke Handover documents The control plan works hand in hand with the quality and risk reports that are shared during the Monitring phase of PMP. A step further to DMAIC will be how do we address these and pu the necessary contrls on place to sustain consistent performance. Once the process is capable and stable the project is decomissioned and handover to the relevant stakeholder is initiated. Risk report Status report Ad hoc stakeholder reports Closure Project closure document Handover documents2 points
-
1 pointWhat are Project Artifacts - Artifacts are documents related to project management since project management requires complete documentation of deliverables and projects. These documents integrate projects with business goals, handle client and sponsor criteria, and define expectations for your team members. They are living in certain ways, which implies artefacts are subject to change and are formally updated. They exist for a reason: to disseminate project-related information. These documents are created by teams to explain and support the work they are undertaking. On the other hand, deliverables, documentation, and templates are all terms that may be used to describe artefacts. The word mostly applies to the project documentation you provide that clarifies and supports the job you are performing. Artifacts are always related to the task of managing the project, not the product you are producing as the project's output. For an example, a new app is a project deliverable, but a project closing document is an artefact. What are the different types of artifacts - Strategy - Documentation pertaining to strategy and project beginning falls under this category. For an example - Business Case | Project Vision Statement | Project Charter | Roadmap These documents are created at the beginning of the project and are often fixed. This category refers to the project's high-level strategy material and isn't something you'd need to update frequently after it's finished. Logs and registers - This category is related to the numerous project management logs and registers that we use to manage the process on a daily basis. For an example - Assumption log | Risk register | Backlog | Stakeholder register These documents are a collection of documents that are constantly changing. Throughout the process, they will be updated. Plans - Plans of various kinds are included in the third category of project artefacts. Which includes: - Comms management plan - Release plan - Scope management plan - Iteration plan - Test plan - Quality plan - Logistics plan They can either be contained in a single document or be spread across several, and they are created to assist you in determining how to manage the project. Hierarchy charts - The hierarchy charts come next. These explain the connections between different project components. - Work breakdown structure - Product breakdown structure - Organizational breakdown structure - Risk breakdown structure In essence, they provide high level information that is broken down into specific pieces. These are often gradually developed as you go through the project, allowing you to return to them and make any necessary changes. Baselines - Throughout the project, baselines are established. They serve as official iterations of the corresponding plans. Here are few examples: - Budget - Milestone schedule - Scope baseline - Performance measurement baseline As the project develops and significant changes take place, baselines will be established and updated. Visual data and information - The following list of possible forms of visual data for projects. - Cycle time chart - Dashboard - Flow chart - Gantt chart - Requirements traceability matrix - Velocity chart - S-curve The ideal case scenario is that you have the ability to update them automatically. You'll normally make them after you complete some type of data analysis to assist you assimilate the information. Reports - There appear to be a lot of reports involved in project management. Here are a few examples of common project reports: - Quality report - Risk report - Status report Agreements and contracts - Although you might not have contracts or agreements pertaining to your project, you might have internal agreements with other departments. Few examples are - - MOU (Memorandum of Understanding) - Fixed price contract - Cost reimbursable contract - Time and materials contract - Indefinite delivery indefinite quantity contract - Any other type of legally-binding agreement Other – a bucket category for anything else. Here are some artefacts that are difficult to place in any other category. - Requirements - Team charter - User stories - Bid documents We can use these project management artifacts in different phases of a DMAIC project - Below table shows few artifacts which can be used in the different phases of DMAIC project
 1 point
 -
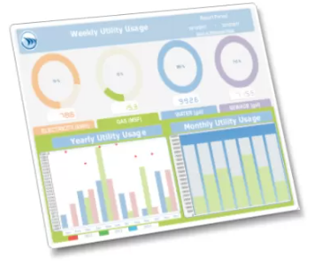
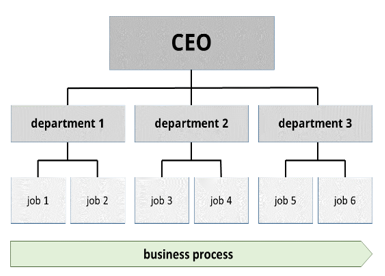
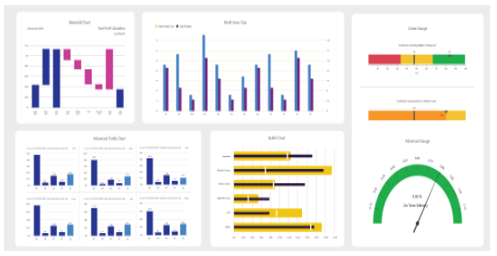
1 pointArtifacts in Project Management Background and importance Project Management involves extensive planning, execution and effective communication within teams and with stakeholders. Documentation holds the soul of any effective project management skill. Artifacts are the documents that provide relevant information to project that may be Vision and Need for project, from Business case, VOC, VOB, VOP, VOE to Scope, Specification and Stages of project along with timelines, expected impact, templates, analysis reports, etc. All these elements are of high importance for the team and all related parties to the project keep referring back to artifacts during various stages of project. Management can do a comparison between planned and actual status, take corrective actions, be proactive in taking decisions and enhance effective and efficient closer of the project. Type of Artifacts There are 9 different types of Artifacts known and extensively used in project management. 1) Strategy Artifact Client expectation, Need of the project, Scope and Metrics, Charter etc are documents created at the beginning of the project. These documents basically define the objective of running a project. Stakeholder’s agreement, commitment and sign off for investment is generally initiated with these set of documents. This artifact is vital as it allows the team to refer back to Strategy decided in the beginning and allows them to course correct the execution plan to deliver the desired result. DMAIC – prepared mostly in Define stage but is referred back at each stage. 2) Communication Plan Most of the projects will have their focus around ARMI and Communication. Starting with the core team responsible to participate / deliver to sponsors, champion and aligned Quality team, the frequency, content and medium of communication varies. A well lay out plan and shared with the interested team improves credibility, expectation, transparency and ensures accountability. DMAIC - prepared mostly in Define stage but is referred back at each stage. 3) Logs and Register Projects has dependency of various types of data gathering and its analysis. This is important for team to focus on the identification of relevant potential aspects and create an action plan to improve the performance. A project manager should always keep a record of all data analysis and records used and mentioned during decision making and execution. Risk, Assumptions, Historical output data, Stakeholder feedback etc all should be documented in form of a standard register. DMAIC – Mostly prepared during measure and analysis phase but is quite relevant in Improve and control stages 4) General Plans Ensuring in time progress and expected outcome is Project Manager’s core responsibility. Usually, manager will prepare multiple plans aligned with the core vision and committed objective. Example logistics, accuracy, iteration and exception handling, UAT results etc all should have an exclusive plan. This allows focus and continuity to the project progress. DMAIC – most used in Improve phase but often is important in all phases including Measure to Control. 5) Reports Periodic report submission is an integral part of stakeholder and team management. A summary view on how project is progressing against target, influences the authority to take decisions and ensure success to the project. Investments, Quality, Risk etc are some of the examples that gets officially submitted as record for stakeholders. DMAIC: Created in all stages of the project mostly from Measure stage 6) Organization Hierarchy Charts Depending on the scope, landscape and characteristics, a relationship exists between various process, departments, products, teams and stakeholders. A well-defined representation via a chart shows the value flow and inter dependency between various parties. This also helps to establish an Escalation channel, ownership of process breakdown and associated risk. DMAIC – Most often prepared in Define stage but it keeps getting updated and at different layers during every stage of the project. 7) Visual Dashboarding and information Day wise performance, month on month comparison, inter operator level performance etc all are considered to be live documents. The visual representation of performance and status is an easy way to communicate all teams on how progress is compared to defined targets. An excellent tool for Operations as well as stakeholders, enables GENBA and documented response and explanations serves in Root cause analysis and appraisals. DMAIC – Improve and Control stage has most relevance but can also be leveraged for various stages of Analyse phase. 8) Baseline Baseline is the defined set and approved version of how the project should perform. Budget allocation and usage, man power deployment, timelines to milestone and performance are some examples where Baseline is used extensively. Baselines can get updated as the project progresses during each stage of the project starting with Define stage. DMAIC – used in all stages of the project but Improve and Control stages has most focus and attraction as it facilitates a performance comparison for team and stakeholders. 9) Agreement and contracts Depending on project, the various binding and agreed clauses in an agreement are documented. The only one assurance cover or guard that both the service provider and investor to a project may have to resolve the dispute in the eyes of law. Price, delivery time, material quality and reimbursement contracts are various example of agreement that stakeholders get into either before or during the course of project. DMAIC – Often the generic agreements are signed off during Define / Pre-define stage of projects but dependent on the outcome and progress, agreements can be made between the interested parties. Measure and Analyse phases would witness most the real time document. A quick summary of Artifacts adaption in DMAIC Define Measure Analyse Improve Control Strategy P R M R R Communication P M M M M Log and Register P P P P P General Plans P P P M R Reports R P P P P Hierarchy Charts P M M M M Dashboards R P R P M Baseline P R M R R Agreements P R M P P P – Prepared, Maintained and Referred, M – Maintained and Referred, R – Referred mostly The chart is a directionally generic recommendation and with the assumption that all the artifacts can be prepared and maintained during any stage of DMAIC and need be.

 1 point
 -
1 pointOne of the most common requirements for statistical test procedures is that the data used must be normally distributed thus it is very important to understand whether the data belongs to a normal distribution or not. In order to achieve this, there are various normality tests available for testing the normality of the data, the common ones are:- Anderson Darling Test Kolmogorov Smirnov Test Chi Square Goodness of Fit Test Shapiro Wilk Test However there are graphical methods also available such as normal probability plot or Q-Q plot for assessing normality of a data set, for this discussion we will be focussing our attention on the tests mentioned above. Let us understand each of these along with examples:- Anderson Darling Test : The Anderson-Darling Goodness of Fit test basically compares the empirical cumulative distribution function or ECDF (an estimator of the cumulative distribution function which allows to plot a variable in order from least to greatest & see how the variable is distributed across the data set) of the sample data & compares it with the expected distribution if the data was normal. If the observed difference is sufficiently large, the assumption of normality is rejected. Below is the null & alternative hypothesis : Ho : The data follows a normal distribution Ha : The data does not follow a normal distribution The Anderson-darling Test Statistic is defined as : A^2 = -N-S where S = Σ[i = 1 to N] (2i-1)/N (ln F(Yi) + ln(1-F(Y(N+1-i)) & F is the CDF of the specified distribution & Yi is the orderd data. Also ECDF is given by : E(N) = n(i)/N where we have N order data points Y1, Y2, …, YN. This test is a one-sided test with the hypothesis that the distribution is normal is rejected if the test statistic A-Sq is greater than the critical value. Amongst all the above test, the Anderson Darling Test is the most effective when non normality is due to variation in the tails of the distribution & also the tails are the most critical part of the distribution when it comes to checking its normality. Let us say we generate 1000 random numbers each for four different distributions Y1, Y2, Y3, Y4 & apply the test to ascertain whether the data follows a normal distribution. Below are the results:- H0: the data are normally distributed Ha: the data are not normally distributed Y1 adjusted test statistic: A2 = 0.2576 Y2 adjusted test statistic: A2 = 5.8492 Y3 adjusted test statistic: A2 = 288.7863 Y4 adjusted test statistic: A2 = 83.3935 Significance level: α = 0.05 Critical value: 0.752 Critical region: Reject H0 if A2 > 0.752 Looking at the above results the data sets Y1, Y2 & Y4 follows normal distribution as we fail to reject the null hypothesis in these cases. Kolmogorov Smirnov Test : Similar to Anderson Darling Test, the Kolmogorov Smirnov Goodness of Fit Test is also used to decide whether a sample comes from a normal distribution. Here also we compare the ECDF of the sample data with the expected normal distribution if the data were normal & we reject the assumption of normality if there is a significant difference observed. This test has the same set of null & alternate hypothesis as mentioned above for the Anderson Darling Test. However there is a marked difference in terms of its sensitivity as it tends to be more sensitive near the center of the distribution compared to Anderson Darling Test which tends to be more sensitive at the tails of a distribution. Also this test does not depend on the sample size in order for the assumptions to be valid thus making it an exact test. Also the critical value of the test statistic does not depends on the underlying distribution being tested as opposed to the Anderson Darling Test. The Kolmogorov Smirnov Test Statistic is defined as : D = max[1 <= i <= n](F(Yi) - ((i-1)/N), i/N - F(Yi)) here F is the theoretical CDF of the distribution which is being tested. Also the parameters for distribution i.e. shape, location & scale must be fully specified & cannot be estimated from the data. Let us again generate 1000 random numbers each for four different distributions Y1, Y2, Y3, Y4 & apply the test to ascertain whether the data follows a normal distribution. Below are the results:- H0: the data are normally distributed Ha: the data are not normally distributed Y1 test statistic: D = 0.0241492 Y2 test statistic: D = 0.0514086 Y3 test statistic: D = 0.0611935 Y4 test statistic: D = 0.5354889 Significance level: α = 0.05 Critical value: 0.04301 Critical region: Reject H0 if D > 0.04301 So the null hypothesis got is not rejected for the first data set Y1 & got rejected for the remaining three which is Y2, Y3 & Y4. Thus the data set Y1 follows a normal distribution. Chi-Square Test : The Chi-Square Goodness of Fit test is used to test if a sample of data come from a population which follows a specific distribution , in our case it is the normal distribution. It is applied to binned data where the data is put into classes & we calculate the Chi-Square Test Statistic & compare that to the critical value in order to reject or accept our hypothesis which is whether the data follows the normal distribution or not. The Chi-Square Test Statistic is defined as : Chi-Sq = Σ[i= 1 to k] (Oi - Ei)^2 / Ei where data is divided into k bins & Oi is the observed frequency of the bin & Ei is the expected frequency of the bin. Here Ei = N(F(Yu) - F(Yl)) where F is the CDF of the distribution being tested, Yu is the upper class limit & Yl is the lower class limit & N is the sample size. The test statistic follows approximately a chi-square distribution with (k-c) degrees of freedom. Let us again generate 1000 random numbers each for four different distributions Y1, Y2, Y3, Y4 & apply the test to ascertain whether the data follows a normal distribution, here we applied the chi-square test with 32 bins, also c = 2+1 = 3, as we have two parameters in a normal distribution i.e. mean & standard deviation. H0: the data are normally distributed Ha: the data are not normally distributed Y1 Test statistic: Χ 2 = 32.256 Y2 Test statistic: Χ 2 = 91.776 Y3 Test statistic: Χ 2 = 101.488 Y4 Test statistic: Χ 2 = 1085.104 Significance level: α = 0.05 Degrees of freedom: k - c = 32 - 3 = 29 Critical value: Χ 21-α, k-c = 42.557 Critical region: Reject H0 if Χ 2 > 42.557 From the above results, we can infer that for data set Y1, we fail to reject the null hypothesis, thus we can conclude that the data set is normally distributed. Shapiro Wilk Test : The Shapiro Wilk Normality Test basically quantifies the similarity b/w the observed & normal distributions by superimposing a normal curve over the observed distribution. It then computes which percentage of our sample overlap with the normal curve. Thus this test computes the probability of finding this similarity percentage. It calculates the W statistic that tests whether a random sample comes from a normal population. Small values of W showcases the evidence of deviation from normality. This test statistic is calculated as shown below : W=(∑ni=1aix(i))2∑ni=1(xi−x¯)2 where xi are the ordered sample values & ai are constants generated from the means, variances & covariances from these ordered sample of size n from a normal distribution. Let us take an example where we collected the reaction times of a sample of people who have appeared for a typing test. Let us analyze the descriptive statistics computed for these samples:- Reaction Time : N = 233, Mean = 969.97, Median = 932.00, Std Dev = 275.32, Skewness = 0.341, Kurtosis = -0.394 Here we can observe from the results that the skewness & kurtosis are closer to zero, thus resembling data closer to a normal distribution, next the actual test is performed & below are the test results:- Reaction Time : Statistic = 0.984, df = 233, Sig(p) = 0.075 Since p > 0.05, we can conclude that the data follows normal distribution.
 1 point
This leaderboard is set to Kolkata/GMT+05:30