

Yogesh.
Members
-
Joined
-
Last visited
-
Cross-functional teams involved in projects/programs don’t speak the same language. What are the customer requirements & how they are delivered may be understood differently as per the functionality of the team. Output of one team could be a input for other teams. SIPOC is a tool (or a data collection template) which helps to understand the scope of the project; provide a high-level business requirements & workflow to ensure every one on the project see the customer requirements/deliverables in the same way. SIPOC is a high level view of process & is a simple data collection template which facilitates gathering of relevant information of Supplier; Inputs; Process; Output; Customer. Which also known as COPIS. Why to use: 1st starts with understanding the Process/processes. Then what will be inputs & outputs of the process. Once you understand the inputs, it helps understand who will be Suppliers for the inputs. Every process will have a output, this output has to meet atleast one Customer requirement. Benefits: 1. it is a template to define a process 2. It sets a boundary of the problem to be analysed, defines a scope of the project 3. Provides a visual repesentation of problems/requirement
-
Automation Autonomation Definition Technology by which process or procedure is performed without human assistance Intelligent automation or automation with Human assistance (supervisory). It is a process of detecting automation errors Aims 1. Cost savings 2. Improve the quality (Accuracy & precision) 1. To detect product defects or process malfunction 2. Stop the process 3. Fix or correct the immediate condition 4. Investigate the root cause & fix it before starting Example To produce a sheet metal part (multistage operation). 1. Cut the part to right size 2. Pick and place the part in next station 3. Bend it to the right dimensions 4. Transfer the finished part to conveyor to assemble to make a final product Before step 04, if a camera is fixed to check for the critical dimensions & give an error feed back to the operator & stops the production to root cause the problem fix it Summary: Autonomation (Jidoka) helps in: Improves the speed of detecting defects Reduces costs by reducing damage to work-in-progress and equipment, and by preventing further processing on flawed work-in-progress Improves operator morale, particularly if the operator is trained to resolve problems (rather than simply calling for a technician) May reduce direct labor costs by permitting one worker to "supervise" several machines
-
Decision making is very crucial in every business and are taken based on experience, assumptions, judgment. Most of the time businesses are trying to arrive at a conclusion for below questions: Is the new design proposed is more robust? Is the new process is cost-effective, increase the productivity, improve the performance? Does adding new features to the product will increase the sale? Mostly decisions for the above questions are made on judgement. Accuracy of the judgement is based on data. Statistical methods will help us take data based decision. After a problem is identified, then a make a hypothesis about what will happen during the testing. In other words, the purpose of the hypothesis is a proposed solution to the problem. Hypothesis cannot be proven correct from the data obtain in the experiment, instead hypothesis are either supported by the data collected or refuted by the data collected. Hypothesis is used in analyze phase: It helps develop a criteria (educated guess) to accept or reject a decision based on data obtained from experiments. Hypothesis Testing Errors: Type I Error – P (Reject Ho when Ho is true) = Alpha Type II Error – P (Accept Ho when Ho is false) = Beta Confidence Level – The probability of correctly accepting Ho Power of Test – The probability of correctly rejecting Ho Reality Ho is true Ho is false Decision Ho not rejected Correct Decision (confidence = 1- alpha) Type II error (Beta Risk) Ho is rejected Type I error (Alpha Risk) Correct Decision (Power = 1- Beta)
-
Yes, there is a value in using Lean Six Sigma in the world of product innovation. As product innovation in not just a spark of idea, but also to have knowledge to look at insights of variables and experiences involved that translate to creating real value. S.No. Product Innovation Steps: Lean Six Sigma enables 1 Identifying your customer requirement - opportunities & problem Customer requirements to Technical requirements 2 Creating a solution – think out of box Concept selection 3 Build Prototype – develop an optimal solution & launch market to get feedback of the solution Risk mitigation 4 Launch Product & keep learning Deploy planning, performance optimization & control Lean Six Sigma compliments & provides a rational for execution/implementation of product innovation by data driven decisions.
-
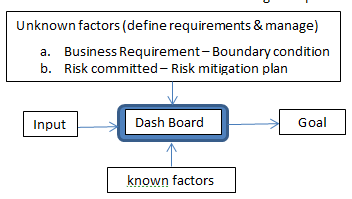
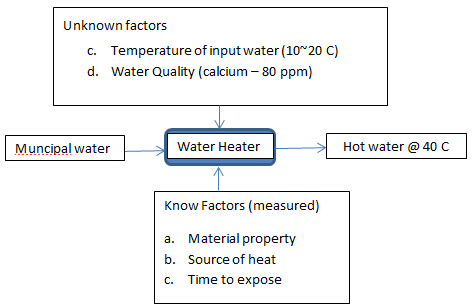
Q3. Dashboard, Numbers, Metrics, CTQs are commonly used terms in the domain of Business Excellence. Here are conflicting views by two management Gurus “if you can’t measure it, you can’t manage it” – Peter Drucker “It is wrong to suppose that if you can’t measure it, you can’t manage it. The most important numbers are unknown and unknowable” – Dr. W. Edward Deming What is your view on this? Is measurement essential for good management? Why? Why not? What did Edward W Deming mean by his statement? I feel measurement is essential for good management, unless you can measure you cannot predict/forecast the business requirements or set Business Goals. The success or failures of Business Goals/requirements are based on how well Dashboard/Metric is defined. Known Factors & Unknown Factors both control the outcome of the Dashboard/metric. Know factors can be measured & managed. Unknown factors need to be defined to business requirement and which should be measureable to be managed. I think Edward W Deming meant by his statement is as follows: The success of a goal depends on how well you manage both known parameter & unknown parameters. Known parameter can be measured & controlled. Unknown parameters to be decided based on business requirements & how much risk business wants to take (should be an educated decision may include testing). a. Once requirements are defined we can set a boundary condition (Range of parameter business want to define) or b. Risk are defined – Then we can have a risk mitigation plan Example to explain the concept:
-
Q2. Root cause analysis is essential to problem-solving. However, there are four possibilities - (you may watch this video to understand more - https://tinyurl.com/ybtjmnof ) A cause may be necessary but not sufficient for a problem to occur. A cause may be sufficient but not necessary for a problem to happen. A cause may be neither sufficient nor necessary for a problem to occur. A cause may be both sufficient and necessary for a problem to occur. How should our approach to problem-solving change for each of the above situations? Root Cause Analysis is to identify the all the factors & find a co-relation between them to provide a corrective action to either eliminate or reduce the risk of occurence of a defined problem. Steps for Root Cause Analysis: 1. Define the problem or the objective 2. Gather data & evidence of the occurrence 3. Identify the factors & classify the factors as critical & non-critical factors 4. Generate a theory to co-relate identified factors for the occurrence of the problem 5. Verify/Validate the theory (may identify multiple critical factors for the problem) 6. Provide the final solution The approach for problem solving may change for each situation: 1. A cause may be necessary but not sufficient for a problem to occur Approach: a. Re-visit Assumptions b. gather more information & investigate further to identify existence of multiple factors which increases the risk of occurrence of the problem c. Re-validate to find a correlation with new factors identified to provide solution 2. A cause may be sufficient but not necessary for a problem to happen Approach: a. May be there are multiple ways to provide a solution to the problem. b. Identify the easy way, minimum risk or cost effective solution to implement the solution after alignment of stake holders 3. A cause may be neither sufficient nor necessary for a problem to occur Approach: a. re-visit the assumption, b. gather more information & re-classify the critical & non-critical factors c. Further investigate is required to identify existence of multiple factors which increases the risk of occurrence of the problem & eliminated not necessary factors d. Re-validate to find a correlation with new critical factors identified & eliminated factors to provide solution 4. A cause may be both sufficient and necessary for a problem to occur Approach: a. Confirm assumption, b. Validate the correlation of all the factors & provide solution
