

Natwar Lal
Members
-
Joined
-
Last visited
Everything posted by Natwar Lal
-
4 Eyes Principle - it is a risk control method where a set of 4 eyes (or 2 people) must approve or check something before it could be done. The fact that no human being is perfect led to the use and popularity of method. The concept is simple - the odds of two different people making the same mistake at the same time are very very small and NOT ZERO. This is the reasons that there have been instances where some errors have happened even when 2 or more people have checked the same thing. If implemented in the process, will it be value adding or non-value adding? Ideally, it will be a non value adding activity. However there are instances where the customers are willing to pay for multiple people checking the same thing. In such scenarios, 4 or 6 or even 8 eye checks become value adding. Barring it, 4 eyes principle is a non-value adding activity usually made mandatory by the regulator for safety concerns and hence is classified as value enabling activity. Examples where 4-Eyes principle is value adding 1. Authors usually want multiple reviews (copy edits, proof reads etc.) of their work before publishing and they are willing to pay for such reviews. 2. Managed services (outsourcing work), clients sometime warrant dual data entry and pay for the same (imagine the cost arbitrage - cost of 2 outsourced FTEs is less than 1 onshore FTE) 3. Patients willingly take second opinions before major medical procedures. In the above it is clear that the customer is willing to pay for the multiple reviews or checks. Examples where 4-Eyes principle is non-value adding 1. Banking transactions need to be approved by 2 or more people depending on the ticket value (usually called as maker-checker process) 2. Presence of 2 pilots in the cockpit. Both should check and confirm the same thing before an action is taken 3. Closing of doors on the plane. 2 crew members should check and confirm it 4. Presence of team of doctors and nurses during surgeries. Doctors ask for the instrument by calling its name, the junior doctors or nurses hands over the instrument by calling its name again. Double confirmation that correct instrument is being used 5. Presence of two people for opening of bank safes and lockers All these examples have a cost of failure and hence 4-Eyes principle is implemented so that the risk of failure is minimized. In such cases this becomes an example of a value enabler activity. Example where 4-Eyes principle is a complete waste 1. Putting additional layers of audits in service industry because of customer complaints and escalations
-
Pseudo continuous data as the name suggests is pseudo continuous i.e. it is actually not continuous (or discrete) but it considered as continuous. Advantages 1. More powerful analytical tools can be used on the data 2. Continuous data tends to follow normal distribution and if it does, we could apply its properties 3. As a Lean Six Sigma practitioner, you need to remember less number of tools :) Dis-advantages 1. Conversion of statistical solution to practical output have a chance of going wrong as the properties of discrete and continuous data are different 2. Misinterpretation and misuse of tools and techniques Guidelines to consider discrete data as continuous 1. There are many (read as uncountable) possible values of discrete data. This is one reason why percentage is usually considered as pseudo continuous. Considering discrete data as pseudo continuous is a powerful method that can be used aby LSS experts in data analysis. However discretion is required by the project leader in using this method.
-
Control Impact Matrix is a 2D tool which helps in comparing items against two parameters 1. Control that we have over the items 2. Impact (expected) that the item could have on solving the problem In a DMAIC project, this tool is primarily used in Analyze phase for prioritizing the causes that can be focused on. Typically the priority order is as follows 1. Causes in High Control High Impact 2. Causes in High Control Low Impact 3. Causes in Low Control High Impact 4. Causes in Low Control Low Impact There is debate on the order of points 2 and 3. However, I feel point 2 should have higher priority wrt to point 3. It may also be used in Improve phase to prioritize for solutions however, there is another matrix tool that is more suitable for this purpose. We could use an Effort Impact Matrix for solution prioritization. Therefore, I feel that Control Impact matrix is better suited for Analyze phase.

-
In order to answer the question 'Why is the problem occurring?", below steps are done in Analyze phase 1. List all potential causes 2. Analyze potential causes 3. Identify critical causes There are 2 approaches that can be deployed for analyzing potential causes. I have summarized both in the table below P.S. the usage of tools is not exclusive i.e. tools can be used either for process or data door depending on the situation. The table only highlights the preferred or the most commonly used tools.

-
Let us consider two numbers a and b where a is greater than b. If the ratio of the sum of these numbers (i.e. a+b) to the larger number (i.e. a) is same as the ratio of the numbers (i.e a is to be), then these two numbers are said to be in a Golden Ratio. Golden Ratio => (a+b) / a = a / b This is denoted by Greek letter phi ( or ). This ratio comes to an irrational number = 1.618 Applicability of Golden Ratio is found in 1. Nature - sunflower, position of leaves 2. Architecture 3. Art 4. Music 5. Technical Analysis of Stocks 6. Design Thinking - laptop screens, mobile screen size 7. Book layouts and publishing 8. Logo designs - Twitter and Apple 9. Computer algorithms 10. Mathematics - fibonacci series 11. Geometry - spiral shapes
-
Interrelationship Diagram is a tool that helps identify the drivers and effects (same as Cause and Effect). Prior to using this tool, one would need to identify the potential causes (use any of the tools - Cause and Effect Diagram or an Affinity Diagram). In C&E diagram, the relationship is well established, however, in an Affinity diagram we only get clustered categories of similar ideas. The relationships between these clusters may not be evident. Hence the need for an interrelationship diagram. Instances where this could be used 1. Establish cause and effect relationships between lot of categories (could be a mix of multiple causes and multiple effects) 2. Establish the root cause or the cause that causes many effects. Sequencing can give us insights on this
-
Box-Cox Transformation is the most commonly used method to transform non normal data to normal data. It transforms the original data by applying a power to it (usually denoted by lambda). The value of lambda varies from -5 to 5. Why will we need to transform the data? Short answer to the long theory is because of following two reasons 1. Properties of normal distribution 2. Normality is a pre-requisite condition for parametric statistical analysis If we expect the data to be normally distributed, but it is not, then before we apply the transformation, we should first check for data entry issues. But then most of the times the process data does not tend to follow normal distribution and hence the transformations come in handy. Analysis that can be performed after applying Box-Cox transformation 1. Stability Analysis - one of the pre-requisite for continuous data control charts is that the data should follow normal distribution 2. Capability analysis - the original data will get transformed, however the capability of the process is still usable. If one knows the underlying distribution of the data, then this transformation may not be required, however not everyone knows the multiple types of distributions 3. Regression analysis (or any of its variants) where the residuals are non normal due to heteroscedasticity (i.e. data does not have constant variance) Analysis that should not be performed after applying Box-Cox transformation 1. Descriptive Statistics - there are measures that can handle non-normal data (Median and IQR) 2. Inferential Statistics - there are non-parametric tests (median tests) that can be performed for non-normal data. These tests do not require one to understand the underlying distribution and are robust enough to handle non-normal data
-
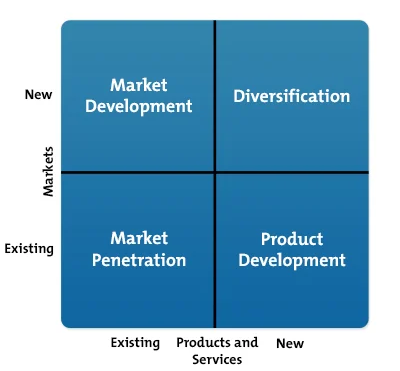
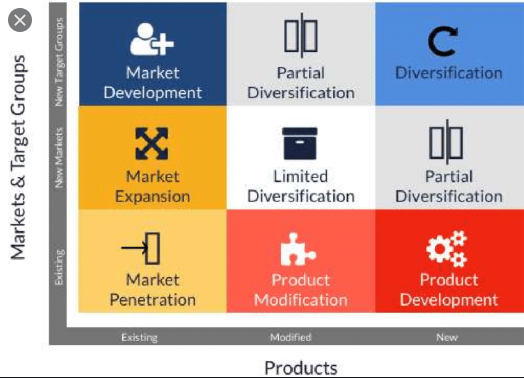
Ansoff Matrix is a marketing tool that is used for deciding the expansion or the growth strategy of an organization. It has been named after Igor Ansoff - the person who first proposed it. In the traditional matrix, there are 4 options for growth. These 4 options are bases on two parameters - Markets and Products. Source: https://www.google.com/search?q=ansoff+matrix&rlz=1C1JZAP_enIN732IN732&source=lnms&tbm=isch&sa=X&ved=2ahUKEwjSi_jlq_noAhXBX3wKHY1jACEQ_AUoAXoECBMQAw&biw=1366&bih=657#imgrc=KKD2JCntBwvxYM The 4 strategies are 1. Market Development - develop new markets for your existing products 2. Market Penetration - increase market share in the existing market for the existing product 3. Diversification - develop new markets for new products 4. Product Development - develop new product for the existing market The extended Ansoff Matrix looks like below Source:https://www.researchgate.net/figure/b-Extended-Ansoff-matrix-The-fourth-activity-is-related-to-planning-of-new-business_fig2_334965141
-
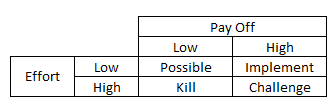
PICK stands for Possible, Implement, Challenge and Kill PICK chart is basically a visual tool used for decision making. This tool could be used after brainstorming and may be used not only in Define phase but other phases of Six Sigma Project as well. In fact one could use it without doing a Six Sigma project as well. PICK chart helps ideas that are Possible, Implement, Challenge and Kill basis two criteria 1. Effort in implementation 2. Pay off after implementation Depending on the quadrant where a particular idea falls, that specific action is taken. Areas where this could be useful for businesses 1. Project selection 2. Solution selection 3. Investment option selection 4. Strategic decision making
-
As per Wikipedia, Ben Franklin effect is - a person who has already performed a favor for another is more likely to do another favor for the other than if they had received a favor from that person. This effect appears to be the result of cognitive dissonance, because if we have done a favor for someone, how can we possibly not like the person. Given that this phenomenon works, businesses or individuals could use it to their advantage in following ways 1. Good inter-personal relations 2. Good client vendor relations 3. Customer loyalty 4. Good supplier relations 5. Good team bonding In all the above cases, the approach would be to first ask for a favor from the other party. One the other party obliges and fulfills the favor, they will inherently start liking you (as per the Ben Franklin effect) resulting in good relationships.
-
Agile development methodology is a process where the product or the service is build up in an incremental and iterative manner. This methodology is successful because of following reasons 1. It breaks the total work into smaller units - called sprints 2. Frequent review of the progress of the work on smaller units - called scrum Sprints are supposed to be closed within a specific time frame and because these are short duration projects, the review and decision making has to be swift. This is where scrum gets introduced. Scrum is a daily team huddle where the progress of the sprint is reviewed and course corrections are done (if required). Kanban on the other hand is a signal from the downstream process to the upstream process to give them work. Scrumban - is the combination of Scrum and Kanban and thereby it utilizes the benefits of both scrum and kanban. The key benefits of using Scrumban in a software development are 1. Changing customer requirements could be managed well 2. The flow of the sprints is made visible using kanban which makes it easier for the team to understand their priorities and deliverables 3. Reduced chances of a deliverable getting missed 4. Better management of backlog items
-
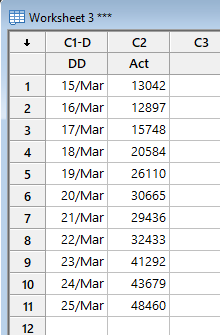
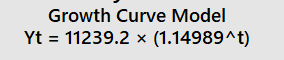
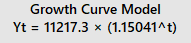
Excellent way of applying the teachings with the current affairs - using Time Series and Forecasting to forecast the number of new cases for Coronavirus. Basis my research (and I am sure by now everyone knows), that pandemics follow an exponential growth. So, when governments say they want to flatten the curve, they basically mean that the exponential growth should be controlled. Exponential growth happens when base grows not be addition or multiplication but by powers. A to the power of B is an example of exponential growth. E.g. let's assume 1.01 to the power of 2 Day 1 => 1.01 to power of 2 = 1.0201 Day 2 => 1.0201 to power of 2 = 1.04 Day 3 => 1.04 to power of 2 = 1.08 ... ... ... Day 10 => value becomes 26612.57 Initially the growth is relatively smaller, but as the time passes, the exponential growth results in very high numbers. Regarding the forecasts for Coronavirus, I picked up the actuals data that was published. Picked up the data from 15th Mar as you are using that as the base value (as below) After running the trend analysis in Minitab for Exponential Growth and using the same for forecasting, below are the results. Growth Model for 26th March forecast Using the above growth model, the forecasted value for 26th March = 60064 Doing the same analysis for 27th March, but this time added the actual figure for 26th March. Growth model for 27th March Using the above growth model, the forecasted value for 27th March = 69336
-
Confidence Interval is the interval in which the population mean is supposed to fall. Confidence Intervals are determined in all hypothesis tests as we infer something about the population from the sample. Prediction Interval is the interval in which an individual value is supposed to fall. Prediction Intervals are determined when we use statistical tools for predictions. Since Confidence Intervals are estimates for means, there are less chances of going wrong and hence it is smaller. On the contrary, since prediction intervals are point estimates, there are higher chances of going wrong and hence it is bigger than confidence interval. Examples 1. Estimating the Sensex or Nifty level at the month end will be like determining Confidence Intervals, whereas, estimating the price of a particular stock at month end is like determining Prediction Intervals 2. Confidence Interval - estimating the overall sales for the product mix. Prediction Interval - estimating the sales for a specific product Regression analysis when used for forecasting or predictions will yield both confident and prediction intervals. Usage of one over the other would depend on the output / variable that the organization is forecasting for. I would believe that most organizations work with confidence intervals, while prediction levels give them an indication of the best and the worst case scenarios.
-
Process Capability Assessment is the main step in Measure phase where the Baseline Metric is calculated. Following are the metrics that can be used for assessment 1. Sigma Level Long Term (Zlt or Zoverall) and Sigma Level Short Term (Zst or Zwithin) 2. Pp, Ppk (using overall standard devaition) and Cp,Cpk (using within standard deviation) 3. DPMO, DPU and Defective % Zwithin uses the within standard deviation for calculation while Zoverall uses overall standard deviation for calculation. The difference between within and overall standard deviation is how you perceive the collected data. If the entire data set is (or the population data) is used, it results in Overall Standard Deviation. While if we divide the entire data into rational subgroups then we get Within Standard Deviation (which is also known as Pooled standard deviation) Another common method to understand the difference within overall standard deviation is when only common cause variation is considered overall standard deviation is when both common cause and special cause variation is considered Sub-grouping or Rational subgroups is the collection of data under similar process conditions thereby resulting in lesser variation leading to the following concept within standard deviation < overall standard deviation Following are few scenarios where sub-grouping is NOT preferred 1. Rational sub-groups do not make sense while working with discrete data. For e.g. if we do weekly sub-groups and are collecting data on defects. For a particular week, if there are no defects (though unlikely but still), then within standard deviation will be 0. Hence does not make much sense to use sub-grouping when dealing with discrete data. On the contrary, one should check for possibility of sub-grouping in case of continuous data 2. Consistent and standardized process that does not change very often. E.g. Temperature control for stem cells. Assuming that it is maintained at -4 Celsius, it is unlikely that it will show a lot of common cause variation. In such cases, even if we do sub-grouping, the variation within and overall will be more or less same (unless there was a presence of a special cause) 3. Project scope deals with a specific product or service being delivered to a specific client. E.g. delivery time of same kind of pizza by only one pizza outlet and to a specific corporate customer (assuming this corporate customer orders almost on a daily basis and orders the same pizza everytime from the same outlet) 4. All process inputs are well controlled. If all the process inputs are all well controlled, then there are less chances of variation in the process. In such a scenario, one could avoid doing rational sub-grouping. Closest example I can think of is the process of making a burger at McDonald's. All the process inputs are well controlled and hence we get the same taste of the burger. One could argue that it is not a perfect example. And I tend to agree because it is very difficult to find a process where all inputs could be controlled. There will always be fatigue, wear and tear etc. Like they say, there is no "perfect process" Important thing to note here is that irrespective of whether you do sub-grouping or not, one should be consistent with the approach for doing a pre vs post project comparison. If baselined with Zwithin, then compare the improvement with Zwithin only. P.S. - If all of this is too tedious, one could simply use the empirical formula Zwithin = Zoverall + 1.5 (however, one should remember that if the data is continuous, both these can be determined independently as well)
-
Genchi Genbutsu - "Go and See" to investigate the issue and truly understand the customer situation. It basically refers to go and observe the process where the actual value is being added. As the question suggests, it makes perfect sense to use in in manufacturing however it is a myth that it is only used in manufacturing. As a concept Genchi Genbutsu is domain and industry agnostic. While preparing process maps, we usually tell the participants to create a map of "What the process is" and not "What it should be" or "what you think it is". One of the best means of understanding "What the process is" is to pick up a transaction and do a walkthrough of the process with it. This is Genchi Genbutsu for you as when you do a walkthrough of the process with the transaction you actually go to the process and see how it works. I am providing some examples below where the idea is same "Go and See". 1. Issue Resolution: when you raise an issue, the first thing that the agent / engineer will do is try to replicate the issue. They might do a screen share or take control of your computer and replicate the issue to understand where to attack and what to do 2. Software Testing: The first one happens when the code is compiled. The compiler does a walkthrough of the entire code and highlights the section of the codes that could not be compiled due to incorrect coding. Second happens during the multiple stages of testing - unit testing, integration testing and UAT. If a particular test case fails and the code is sent back to developer, the developer will first recreate the situation to see the failure (this is Genchi Genbutsu) 3. Medical conditions: Various invasive and non-invasive screening methods are used to first go to the specific location in the body and see the extent of the problem. E.g. X-ray, MRI, CT-scans, angiography etc. 4. Servicing of car: when you take your car for its regular service, the mechanic will first take a test drive of the car. What he is trying to do is to get a feel of how the car is driving so that he could pinpoint the issue which he will not be able to do unless he drives it himself.
-
Looking at the above differences, it becomes clear as to why Test of Equivalence is considered as opposite of Hypothesis testing. Having laid down the differences, there are some similarities as well 1. Both work with samples and apply the concepts of Inferential Statistics (Significance Level, Confidence Intervals etc.) 2. Researcher is interested in Alternate Hypothesis in both (even though the alternate hypothesis are opposite in the two) Choice between hypothesis testing and equivalence will depend on the purpose of the study. Equivalence tests are most commonly used in pharma industry to check if a generic drug (lower cost option) has the same efficacy as the patented drug. To summarize, equivalence tests could be used wherever we want to use substitutes to an original item without significantly impacting the final outcome. Some e.g. that I could think off 1. Construction - Substituting building materials without impacting the compressive strength 2. Chemical / oil / pharma - Substituting chemicals without impacting the reaction time 3. Medical devices - substituting the type of laser without impacting the burning efficiency and precision 4. Tyre industry - substituting the rubber components without affecting the grip or the life of the tyre

-
Not sure if Mark is on the Mark this time. It is relatively easier for a BB and/or MBB to switch domains basis their knowledge in business improvement methodologies, however, companies tend to prefer BB / MBBs who have specific domain knowledge as well. Only if companies followed Mark's view.....what say?
-
Sampling Errors are of two types (as already mentioned in the question) - Biased and Unbiased. Biased Sampling Error - is one which results in a bias in the sample. The effect of this bias is that the result of the sample will not reflect the true nature of the population. There are three sources of such bias 1. Survey Bias: where the survey questionnaire or the process of collecting data is biased 2. Researcher Bias: bias introduced by the researcher of the study 3. Respondent Bias: bias in the responses if the respondent chooses not to give the correct answer Unbiased Sampling Error - is one which is the resultant of chance. The sample will never reflect the population simply because the observations will vary from each other. Selecting a large sample size is one way in which both these biases could be avoided. However, since our analyst has decided to choose a smaller sample size, he should take care of the following things 1. Sampling method: choose the one which gives a random representative sample 2. If there is a questionnaire involved, then ensure that there are no leading questions or questions for which the respondents might have a tendency to not give the right response. Make the survey anonymous so that respondents could give correct responses 3. Determine which is more important - alpha or beta error? Since sample size is fixed, he could then determine either the significance level or Power of the Test that he is going to get and whether it is ok or not
-
One of the reasons for project failure is 'Lack of Planning' and this not only includes planning for what one is going to do in the project but it also involves planning on how to check that the project is on track. Doing effective tollgates is an excellent mechanism to check the progress and ensure that project is still on the right path. For the tollgates to be effective, one basically has to seek answers to 5W and 1H (What, Why, Where, When, Who and How) Let us look at each element in slightly more detail 1. WHAT - Determine the requirements. What is the purpose of the tollgate? What is the information / artifacts that are required? What questions have to be asked? 2. WHY - Determine the objectives of the tollgate. Why are we doing tollgate? Why is it important to do the tollgate? Is the purpose only to review or also to approve? 3. WHERE - Determine the logistics of the tollgate. Where are we doing the tollgate? 4. WHEN - Determine the frequency, duration of the tollgates. When should the tollgates be set up during the project lifecycle? 5. WHO - Determine the participants in the tollgate. Who should be presenting the progress? Who should be audience during the tollgate? Who should be asking the questions? Who is going to take down the action items and meeting minutes? 6. HOW - Determine the decision criteria for acceptance / rejection of the tollgate. How are we going to judge the success of the tollgate? How many tollgates are required in the project lifecycle? If the team has thought through the above indicative questions, the chances of having an effective tollgate increases manifold. An effective tollgate will have following benefits 1. Keep the project team honest and true to the project objective 2. Ensure that scope, cost and schedule creep DO not happen 3. Effective communication across various levels in the organization (as the sponsor and/or other stakeholders may not be too close to the project) 4. Any issues / challenges are brought to notice at the right time and to the right people so that solutions could be identified
-
This is so on the spot. This snapshot excellently captures the true essence of Lean Six Sigma!!
-
Customer Satisfaction is a key metric for all organizations but more so for any marketing company. It is commonly known as CSAT score and is an average of ratings provided by customers who have used the organization's service / product. CSAT happens to be most common way of capturing Voice of Customer (VOC). Business to Customer (B2C) company is where the product or service is offered directly to customer. E.g. Uber, Fast Food Joints, Netflix, FMCG companies, Airtel DTH etc. Sometimes the CSAT captured for such companies could be misleading. Below are the reasons and how best to tackle it 1. Intermediaries between the company and customer: Following a typical value chain, you will have Manufacturer --> Distributor --> Wholesaler --> Retailer --> Customer. Ideally speaking the immediate customer for Manufacturer is the Distributor, however it is a very narrow view by the organization and is not a good idea. In this value chain, the customer experience is influenced by a lot of other factors as well which may not be in direct control of the the manufacturer. However, it is only the manufacturer that captures the CSAT. 2. Customer does not provide unbiased and specific CSAT score (even if there are not too many intermediaries between the provider and customer) 3. Average of scores is used to check for overall customer satisfaction. Even though average works in most cases, sometimes it ignores the extreme scores which might be of importance 4. Capturing of CSAT is outsourced to a third party which might not give it the due importance. Even if it is done inhouse, one should be vary of the below a. Customer segments or sample not selected appropriately: With B2C companies the customer base is very big and hence selecting the right sample sometimes becomes a challenge as the service offering could be different for say different regions b. Questions in CSAT survey not designed effectively: CSAT could be done for multiple reasons. One of the most common drawback in a CSAT survey is that it usually focusses on the overall satisfaction of the customer. At times, the company might want to know about the additional features that they want to provide and if the survey does not capture these correctly in questions, then the effectiveness of the survey becomes a challenge c. Inappropriate rating scale in the CSAT survey: Giving too many options to the customer might confuse them. Also it might possess a challenge in inferences d. Too small a sample to make any meaningful inferences e. Purpose of capturing CSAT is unclear f. Data cleansing not performed. There are methods in which you could actually check if the customer feedback is consistent or not as one would ideally want to filter out those customers who have just filled the survey without giving due attention to it. Certain questions may not be answered etc. and these have to factored in during reporting How to overcome the above: 1. Do not outsource the work that is core to the organization. E.g. You may purchase an Airtel DTH set from any electrical shop. However, it is only the Airtel servicemen who will come and install it 2. Ask the customer to be more specific when capturing feedback. E.g. If a less than 5 star rating is given in Uber, they ask customers to choose from multiple options for giving low rating. Some of the parameters are linked to driver while rest are for Uber 3. Increase the touch points with the customer i.e. the company should be easily accessible to the customers who want to give a feedback 4. If CSAT is a key performance indicator for the organization, do not outsource it and have competent team plan and execute on how CSAT has to be captured 5. Requesting customers to register the product. This could not be done for all B2C companies, however, it gives an opportunity to the organization to know about the customer 6. Value chain integration i.e. the manufacturer works with various partners in the value chain to inculcate the same values and attitude towards customer service. E.g. automobile companies 7. Keep the questionnaire relevant to the purpose of seeking the CSAT
-
Outlier – is a data point that is significantly different from the rest of the data point. Another definition of an outlier is a data point that significantly varies from the distribution of the data set. It is a common phenomenon to get outliers in any data one collects. There can be many reasons for outliers in a data set. Some of the more common reasons are as below 1. Experimental error 2. Measurement system error (either the gauge gave an incorrect reading or it was noted down incorrectly by the operator) 3. Data collected from 2 or more distributions 4. Special Cause occurrences or anomalies 5. Attempts of fraud Outlier management may be a thesis topic in itself. However, I will try to keep it simple and practical here How to identify the outliers 1. Box Plot: It is the most common method to identify the outliers. An outlier will be marked in * in a box plot. These star marks are observations which are smaller or greater than 1.5 times IQR (Inter Quartile Range) 2. Control Charts: Any point outside the control limits is considered as an Outlier. Applying Nelson rules, one could also identify the unusual observations though these may not be significantly different from the rest of the data points 3. Modelling (like Regression Analysis, Probability distribution fitting etc.): whenever a model or a probability is fitted using historical data, it lets us know if there are any data points that do not fit the model. Usually such data points are outliers in the dataset which do not follow the fitted model There are other statistical methods also to identify the outliers in any data set. The ones listed above are the basic ones. What to do if you encounter an outlier? First do not panic And I write this because I have seen people panicking about outliers in their data sets. Getting outliers in a data set is not an outlier (it is very common) Second, take a structured approach to resolve the Outliers 1. Find out the reason for the outlier. Best and the easiest method is to do a 5 Why analysis 2. Determine if the root cause is a part of the nature of the business or process (say a seasonal or cyclical effect etc). One will need common sense and business knowledge for this determination. If one does not have either then it is advisable to work with an SME while doing this step. E.g. – the daily transactions during a month end show an unusual spike. However this spike is in the nature of banking business. Compare it with spike of transactions that happened due to demonetisation (Demonetisation is not the usual nature of business) 3. If the root cause is part of the nature of business, then the Outlier CANNOT be removed from the data set. Removing such an outlier would result in undesired data modification. If the outlier cannot be removed from the data set, then there are two possibilities a. Outlier is beneficial for the process – in which case the root cause for the outlier should be replicated b. Outlier is bad for the process – in which case the root cause for the outlier should be eliminated from the process (eliminating root cause is different from removing the data point. Elimination would ensure non recurrence of a bad outlier) 4. Alternatively, if the root cause if not part of the nature of business, then it may be EXCLUDED. It can be done in following two ways a. Trimming i.e. deleting the outlier from the analysis b. Winsorising i.e. replacing the outlier with the border case values (these border case values are not outliers) If there is outlier or any data point that is excluded or winsorised, it should be clearly called out in the reporting
-
I couldn't agree more to the statement "not every customer is worth the time and effort". Some of the most common reasons for denying business with a potential customer are as follows 1. Business ideologies or work ethics do not match 2. Product is developed for a specific customer segment. E.g. Credit cards are issued basis the annual salary of an individual. Some of the high end credit cards might not be available to some customers 3. Financials do not work out between the service provider and the customer 4. Regulatory restrictions. E.g. tobacco products could not be sold to people below the age of 25 5. Customer does not follow the guidelines laid down by the service provider. E.g. in some fine dine restaurants, they require the customers to be dressed up in formals and if the customer is not dressed up accordingly, the restaurant may deny entry 6. Customer is too demanding and/or is finicky and/or is unruly. E.g. recently airlines have become intolerant to unruly customers and they might blacklist such customers from flying 7. Background of the customer. E.g. Services not being sold to people or companies with criminal background 8. Sanctions (economic or financial or military). E.g. Financial transactions are prohibited with companies in OFAC countries
-
Kanabn Board is a tool that is used to depict the position of work in the process. As the question mentions itself, Kanban boards were primarily done for work allocation, monitoring the progress, decision making and reporting (at the end of the day). The most common usage of these boards were found in the daily huddles / daily team meetings / stand up meeting (what ever you might want to call it). It is mostly done on a white board where columns are created to track progress. These days there are multiple online versions of Kanban boards (but the joy of doing it is using post it notes or a marker pen on a white board - the good old way). The selection of manual or a systemic Kanban board is of lesser significance. What is more important is to track the progress. The simplest of Kanban board looks like Source: Google Images (smartsheet.com) Source: Google Images The best feature about the Kanban board is how it has evolved across various industries and domains and how it is being utilized these days. The underlying feature of allocating work, tracking progress and decision making remain the same. 1. Kanban Board in Agile Software Development / Project Management Source: Google Images search 2. Kanban Board in sales Source: Google Images search 3. Kanban Board in Hiring Source: Google Images search 4. Kanban Board in Incident Management Source: Google Images search 5. Kanban Board in aviation (flight progress strips) Source: Google Images search Automated version of flight progress strips Source: Google Images search 6. Kanban Board in Food Ordering Source: Google Images search You notice that there are multiple variations of Kanban board (manual or systemic) with all trying to help the business and/or customer know the progress of their product/service through the various process stages. A more advanced or recent variation of Kanban board is a Swimlane Kanban Board where additional characteristics could also be tracked. Source: Google Images search


-
Imagine you got to choose a solution from a list of probable solutions with the following conditions 1. all solutions will be evaluated one after the other 2. a solution if evaluated and rejected cannot be selected again 3. each solution has a different reward or benefit associated with it which you are unaware of. You will be aware of the rewards for only those solutions that have been evaluated 4. probable solutions are in no particular order 5. If you reject all solutions, by default the last solution will be selected even though it may no give you the best result In such a scenario, the biggest challenge is to determine where to stop? Ideally you want the maximum reward or the best solution. However, you do not know if it is still to be evaluated or whether you have already rejecting it assuming that there is a better solution yet to be evaluated. Optimal Stopping Problem provides a solution in such situations. It says that if you have to choose from 'n' solutions, always reject the first 'n/e' (where e = 2.71) solutions. Let us call this number as 'x'. Then select the next solution which is better than the 'x' solutions already evaluated. Working with this rule, you will select the best solution in about 37% of the cases (which as per Wikipedia is a very good success rate - i have not gone into the validation part of it yet). 'x' is basically a sample that is drawn from the population 'n'. And 'n/e' ensures that we have a sufficient sample size to consider. E.g. picked from the classic 'Secretary Problem' associated with Optimal Stopping Problem (source: Wikipedia) You have 100 applicants for the position of Secretary. All the above rules (points 1 through 5) apply here and you have to select the best candidate. As per the Optimal Stopping Problem, one should reject the first 100/2.71 ~ 37 candidates and then select the next candidate who is the best fit from among the candidates interviewed so far. P.S. This will ideally not happen as the interviewer will always have the option to go back to any candidate. I do not have examples of any practical application of this this concept is new to me. Hoping someone shares practical examples here.

