

Sujoy
Members
-
Joined
-
Last visited
-
Sujoy changed their profile photo
-
SQDC board is a visual management used at the production floors in manufacturing. It stands for Safety, Quality, Delivery and Cost. This board depicts the metrics and the performance of the process against each of the elements of SQDC for each day. Implementation steps: 1. Define Metrics Metrics used for each SQDC elements are defined , few examples as below : Safety Quality Delivery Cost No near misses RTY > 90% 100% on time customer delivery Warranty claims < 5% of sales in last 3 months No safety violations Defects < 5 per day Complete units per day >10 Rework < 5% of sales No absentee due to injuries DPMO < 50 Scrap < 3% of the total cost 2. A blank SQDC board is displayed at the beginning of the month. 3. Daily performance is measured against the metrics baseline and the day is marked Green for goal achieved and Red for goal not achieved. 4. Leader or the manager visits the SQDC board, after each production day, to check on the latest markings on the board. 5. Discussion is held and “genchi gembutsu : Go and see for yourself” is prioritized and performed for improvement, basis markings on the board. Following are amongst the many benefits of using SQDC board : 1. Quick and easy understanding of the performance status. Red and Green markings on the board on the daily performance leads to quick and easy understanding of information at a glance. 2. Ensure process running as per the designed flow. The board leads to identify any deviations from the designed process flow. The deviations can be in the form of defects, breakdowns, non – compliance to steps etc. and can be depicted using tools like Pareto, bar chart, histogram. 3. Reduced miscommunication. SQDC board enables to reach common level of understanding on the focused areas for improvements. It reduces miscommunications among managers and leaders on the gaps and priorities. 4. Increased attention to gaps and their closures Deviations are identified and recorded as Red marks on the SQDC board. This pushes for immediate discovery of the causes and the action plans for their closure.
-
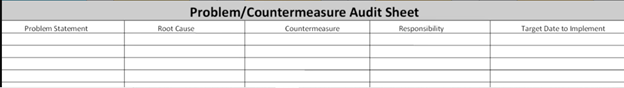
Kamishibai board is a visual management tool. It is a process confirmation method that plays an important part in a daily management system. It is a system of autonomous maintenance vide daily, weekly, monthly audits which are performed by the different levels management. Kamishibai audits management systems and standards. These audits detect slipping standards and prevent breakdowns of the Lean management system. Kamishibai board offers strong visual controls and clear standards during Gemba walk and structure every part of the walk. This ensures that leaders perform process confirmation of key standards every day. Origin The kamishibai is a paper theater storytelling system common in Japan. This paper theater originated in the 12th century as Buddhist moral dramas for the illiterate. The audience of the kamishibai saw and heard what happened to characters in the story. They could compare their lives to the “standard” in the kamishibai story to check if they were living their life in a moral way. It was a self audit system. How to use 1. Cards, mentioning the task to be performed, are put up on the Kamishibai board. 2. One side of the card is Green colored which indicates that the task is complete and the other side is Red colored indicating that the task is incomplete. 3. Daily, Weekly and Monthly tasks , to be performed, are initially put up as red cards on the board. Red cards indicate that the task is incomplete. 4. The leader / manager, picks up the Red colored cards and perform the tasks. 5. After the task is completed, the card is turned to Green side and put up on the board. 6. During the performance of the task, if abnormalities or deviations are observed, then the task is listed as incomplete and card for that task is kept as Red. 7. For tasks which are incomplete due to observed abnormalities and deviations Problem statement, Root cause, Counter Measure, Responsibility and Target Date to Implement are recorded in the audit sheet. 8. At day end, week end or month end, the Green cards are again turned to Red. This opens the tasks to be performed again on the next day, next week or next month.

-
Takt time is the average time between the start of production of one unit and the start of production of the next unit, when these production starts are set to match the rate of customer demand. For example, if a customer wants 10 units per week, then, given a 40-hour work week and steady flow through the production line, the average time between production starts should be 4 hours, yielding 10 units produced per week. Takt time can be determined with the formula: T=Ta/D Where T = Takt time, e.g. [work time between two consecutive units] Ta = Net time available to work, e.g. [work time per period] D = Demand (customer demand), e.g. [units required per period] Net available time is the amount of time available for work to be done. This excludes break times and any expected stoppage time (for example scheduled maintenance, team briefings, etc.). Example: If there are a total of 8 hours (or 480 minutes) in a shift (gross time) less 30 minutes lunch, 30 minutes for breaks (2 × 15 mins), 10 minutes for a team briefing and 10 minutes for basic maintenance checks, then the net Available Time to Work = 480 - 30 - 30 - 10 - 10 = 400 minutes. If customer demand were 400 units a day and one shift were being run, then the line would be required to output at a minimum rate of one part per minute in order to be able to keep up with customer demand. In reality, people and machines cannot maintain 100% efficiency and there will be stoppages for other reasons. Allowances should be made for these instances, and thus the line will be set up to run at a faster rate to account for this. Also, takt time may be adjusted according to requirements within the company. For example, if one department delivers parts to several manufacturing lines, it often makes sense to use similar takt times on all lines to smooth out flow from the preceding station. Customer demand can still be met by adjusting daily working time, reducing down times on machines and so on. Benefits : The product moves along a line, so bottlenecks (stations that need more time than planned) are easily identified when the product does not move on in time. Correspondingly, stations that don't operate reliably (suffer frequent breakdown, etc.) are easily identified. The takt leaves only a certain amount of time to perform the actual value added work. Therefore, there is a strong motivation to get rid of all non value-adding tasks (like machine set-up, gathering of tools, transporting products, etc.) Workers and machines perform sets of similar tasks, so they don't have to adapt to new processes every day, increasing their productivity. There is no place in the takt system for removal of a product from the assembly line at any point before completion, so opportunities for shrink and damage in transit are minimized. Downsides : When customer demand rises so much that takt time has to come down, quite a few tasks have to be either reorganized to take even less time to fit into the shorter takt time, or they have to be split up between two stations (which means another station has to be squeezed into the line and workers have to adapt to the new setup) When one station in the line breaks down for whatever reason the whole line comes to a grinding halt, unless there are buffer capacities for preceding stations to get rid of their products and following stations to feed from. A built-in buffer of three to five percent downtime allows needed adjustments or recovery from failures. Short takt time can put considerable stress on the "moving parts" of a production system or subsystem. In automated systems/subsystems, increased mechanical stress increases the likelihood of breakdown, and in non-automated systems/subsystems, personnel face both increased physical stress (which increases the risk of repetitive motion (also "stress or "strain") injury), intensified emotional stress, and lowered motivation, sometimes to the point of increased absenteeism. Tasks have to be leveled to make sure tasks don't bulk in front of certain stations due to peaks in workload. This decreases the flexibility of the system as a whole.
-
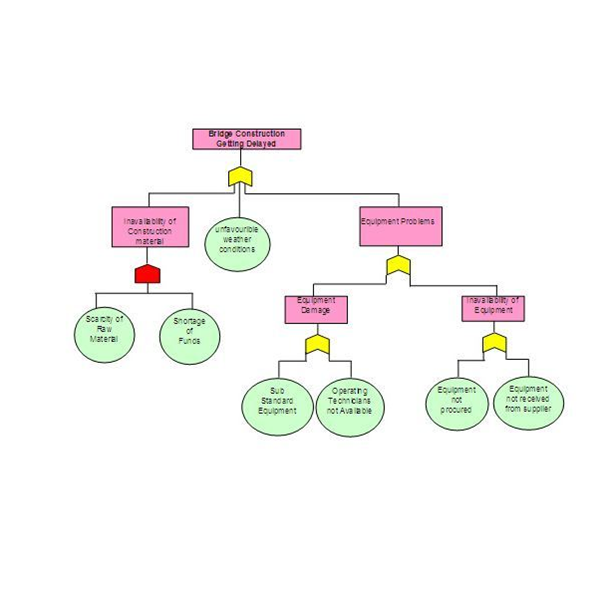
Fault tree analysis is a method used to analyse any defects or accidents or undesired event that happens in an industry. This method looks like an inverted tree. That is why it is named as fault tree. In many cases there are multiple causes for an accident or other loss-making event. Fault tree analysis is one analytical technique for tracing events which could contribute for an accident or other loss making event. It can be used i. In an accident investigation ii. In a detailed hazard assessment The fault tree is a logic diagram based on the principle of multi-causality which traces all branches of event which could contribute to an accident or failure. A fault tree creates a visual record of a system that shows the logical relationships between events and causes lead that lead to failure. It helps others quickly understand the results of your analysis and pinpoint weaknesses in the design and identify errors. A fault tree diagram will help prioritize issues to fix that contribute to a failure. In many ways, the fault tree diagram creates the foundation for any further analysis and evaluation. For example, when changes or upgrades are made to the system, you already have a set of steps to evaluate for possible effects and changes. You can use a fault tree diagram to help you design quality tests and maintenance procedures. It uses sets of symbols, label and identifiers displayed and described as below : There are two basic types of fault tree diagram notations: events and logic gates. The primary or basic failure event is usually denoted with a circle. An external event is usually depicted with a symbol that looks like a house. It's an event that is normal and guaranteed or expected to occur. Undeveloped event usually denotes something that needs no further breakdown or investigation or an event for which no further analysis is possible because of a lack of information. A conditioning event is a restriction on a logic gate in the diagram. These gate symbols describe the Boolean relationship between outcomes. Ø Gate symbols can be the following: Ø OR gate - An event occurs as long as at least one of the input events takes place Ø AND gate - An event occurs only if all input conditions are met Ø Exclusive OR gate - An event occurs only if one of the input conditions is met, not if all conditions are met Ø Priority AND gate - This is probably the most restrictive scenario when an event occurs only after a specific sequence of conditions Ø Inhibit gate - An event will only occur if all input events take place as well as whatever is described in a conditional event Approach : Ø A fault tree diagram is drawn from the top down Ø The starting point is the undesired event Ø The immediate contributory fault conditions leading to that event is then logically worked out and drawn. Ø These may each in turn be caused by other faults and so on. Ø The trickiest part of the whole thing is actually getting the sequence of failure dependencies worked out in the first place. In the above Fault tree analysis, the undesired event is “Bridge construction getting delayed”. This event is found to be caused by either of “unavailability of construction material”, “unfavourable weather conditions” or “equipment problems”. Hence these three events are connected to the main event through an “OR gate”. That is any of the three events, individually, can cause delay in the bridge construction. Further “Unavailability of construction material” is drilled down and found to be caused by basic events “Scarcity of raw material” or “shortage of funds”. Unfavourable weather conditions cannot be drilled down further and hence have no basis events leading to it. “Equipment problems” was found to be related to other two events (equipment damage or unavailability of equipment) through an OR gate. “Equipment damage” was then found to be caused by either “substandard equipment” OR “Operating technicians not available”. “Unavailability of equipment” was found to be caused by either “equipment not procured” OR “equipment not received from the supplier”. Thus from this analysis, it was possible to get to the root cause/causes that was/were leading to intermediary undesired events which in turn were leading to the main undesired event.

-
A value added activity is an activity that meets a specific need of a customer, at a specific time, at specific cost and with specific capabilities. Any value added activity aims to eliminate three enemies of Lean, namely Muda, Mura and Muri. Muda = Wastes. There are 8 different forms of wastes, namely Defect, Over Production, Waiting, Non-Utilized Talent, Transport, Inventory, Motion and Excess Processing. These wastes can be put in short form as "DOWNTIME". Mura = Unevenness, for example an uneven work pace in an operation causing operators to hurry and then wait. Muri = Overburdening equipment or operators by requiring them to run at a higher or harder pace with more force and effort for a longer period of time than equipment designs and appropriate workforce management allow There are three checks for value addition activity, namely 1. A value adding activity is one that customer is willing to pay for. This is a top pre-requisite for labelling any activity as value add or otherwise. Any activity If a customer is not willing to pay for it, then there is no value. For example, let's say a company A manufactures widgets and offers free 24-7 customer support for widgets. To provide the best customer service it always has at least one knowledgeable technician available to answer customer questions 24 hours a day, seven days a week. On the other hand, its competitor, company B, only offers email support, with a guarantee of getting an answer within 48 hours, and they sell their widgets for 5% less than the price of widgets of Company A. Because of their lower price the company A is losing several major customers to its competitor every month Let us elaborate this further by taking an example of a patient. A patient who comes in with suspected hip fracture would value the steps directly required for diagnosis and treatment. Time spent directly with caregivers, such as nurses, and surgeons, would be valued. However, it would be a waste if the customer has to give the same information to different caregivers. Having x-rays reviewed would be valued, but the time spent waiting because the radiologist is too busy would be considered waste. 2. A value adding activity is transformational by nature. This definition describes changing the “form, fit, or function of the product/service” that brings it closer to its final state. For example, installing a car door changes the product in a value added way as customers are willing to pay for doors and the product changes from a door-less chassis to one with doors. Time spent moving doors in the factory or waiting to assemble them would be non-value added because nothing is changing with the product. A transformational activity will be considered value add only if it fulfils a specific need of a customer and for which the customer is will to pay for. Mere transformation of a product or service may not be considered a value add if the customer is not willing to pay for it even if it is deemed as important by the company As an example, in call center, merely transforming the call handling process by adding verbiage, new application and short codes , will not create any value if it does not fulfil specific customer requirement specified through a specific query/complaint by the customer as and when the customer connects with the call center agent. 3. A value adding activity is done first time right. An activity might meet the requirements of the first two rules, but if something was done incorrectly at the first time, requiring rework and additional motion, then that activity will not be considered a as it will double up the time for doing the same activity.value add For example , if a call center agent handling balance deduction query of a customer only provides the reason for deduction and the amount deducted, then the resolution may not be considered as a value add. The agent did provide information on the reason of deduction and the amount deducted but did not provide the way to avoid such any unwanted deduction further on. The customer may again loose his/her balance due to the similar reason and may end up calling call center again. Thus the initial call handling activity by the call enter agent was not a value add as it did not provide first time fix which led to repeat interaction.
-
Kaizen Kaikaku Kakushin Explain the meaning Kaizen is evolutionary, focussed on incrmental improvements. Minor update in a piece of software can be equated to Kaizen. Kaikaku is revolutionary, focussed on radical improvements. Following the software example, Kaikaku would be the upgrade of an application currently in use from a release level to a new release level. Software providers will often substantially change both the technical basis of the software and its functionality. For both IT and the user community, this means a large step change. Kakushin is improvement through innovation and renewal. Again, in our software example, this may mean replacing a complete application with a different application that supports the process in a completely different way, for example a web-based application that fully automates the registration of orders, the submission of invoices and the generation of a picking order at order fulfilment. How are they three different from each other? These are minor and continual improvements Lean initiatives or events with cumulative planning and execution timelines of hours to weeks • Smaller project scope • Small to medium staff and resource allocation • Quicker results with small, individual contributions to the bottom line of the organization or value stream • Tactical These are large scale and wide ranging improvements A lean initiative or event with a planning timeline of weeks to months and an execution timeline of hours to weeks (value stream dependent) • Larger project scope • Medium to large staff and resource allocation • Results realized more slowly but with larger, concurrent, multiple contributions to the bottom line of the organization or value stream • Strategic These are revolutionary improvements and breakthroughs How do they complement each other? Organizations get benefit from these through continual improvement of their processes, transformation of their organizational culture, and becoming an innovative entity. Effectively applying these three essential concepts of Kaizen, Kaikaku, and Kakushin is the right solution for any organization which wants to deliver a sustainable high quality product or service and ensure a steady growth in the global market. What would a company lose if one of these as a concept was not utilised? All these three concepts are essential for the success of an organisation. Depending upon bussiness requirement , all these three are crtical and utilized. Not doing kaizen keep the organisation from benefits of small incrmental improvements thereby keeping organisation away from the major benefits in efficiency, safety, as well as employee and customer satisfaction. Kaikaku encompasses more activities and addresses systemic waste.When executed well, Kaikaku creates a momentum that transforms the entire “value stream” of material, information, people, and actions required to bring a product from concept to launch to delivery. Kakushin renews way of thinking in the organisation . When followed leads to new revolutionary and breakthrough ideas, products or services.
-
"If you can't measure it, you can't manage it" - Peter Drucker. "It is wrong to suppose that if you can't measure it, you can't manage it. The most important numbers are unknown and unknowable" - Dr. W. Edward Deming Measurement is critical & necessary for the success of business as through it useful information about the performance of products, processes and services are received. Measurement of any process,product or service, when mapped against the set standard, provides opportunities for continuous monitoring, control, management and improvement towards meeting key customer specifications, hence towards business excellence and success. Measurement helps in identification, tracking and fixing of deviations through corrective actions real time or at an defined interval thus removing any room for guesswork. Deming was a very strong proponent of data driven approach for business solutions. He is best known for the Plan Do Check Act ( PDCA ) cycle. However, through the quote, "It is wrong to suppose that if you can't measure it, you can't manage it. The most important numbers are unknown and unknowable", he is emphasizing the business impact of any special & unseen cause, natural calamities, advancement in technology. Such impacts cannot be outrightly measured but can have massive impact upon the sustenance and continuation of any business. Such unseen , special or any futuristic cause can at best be visualized and managed through personal ingenuity and discernment. Merely relying on data and measurement for such will reign havoc and destruction for the business.
-
Personal Excellence Personal Excellence is the excellence which a person continuously strive to achieve in his / her emotional, physical, mental and spiritual realms. It involves factors like commitment and adherence to discipline, will, habit transformation through daily routine and rituals, meditation, self-awareness,, mindfulness , self –control, self-improvement. Personal excellence is the root. Success of individual in his personal and professional realms seems in direct proportion to the level of personal excellence that he/she has achieved. It is a continuous journey. Process Excellence Process Excellence is related to excellence in a specific process. It strives to achieve continuous flow in a process through the identification and removal of wastes, bottlenecks and constraint shifting. Output of process excellence is cycle and lead time reduction, waste reduction, increased process throughput, profit, employee & customer satisfaction. It is a continuous journey. Operational excellence An operation may consist of several processes or a single process. Operational excellence is similar to process excellence if only a single process is involved in an operation. However. if multiple processes are involved, then operational excellence will comprise of excellence in individual processes involved in the operation. Business excellence A business may comprise of several operations. Business excellence is similar to operational excellence if only a single operation is involved in a business. However. if multiple operations are involved, then business excellence will comprise of excellence in individual operations involved in the business. Output of business excellence is maximization of effectiveness of business in meeting or exceeding customer value expectations and using continuous improvement to drive business results. All of the above mentioned are strongly related to each other . All of them are continuous. Wherever people are involved, all excellence starts from personal excellence which in turns positively drive process excellence. Process excellence in turn drives operational excellence which in turn drives business excellence. Aim of all improvements projects should be business excellence !!!
