

Venugopal R
Members
-
Joined
-
Last visited
Everything posted by Venugopal R
-
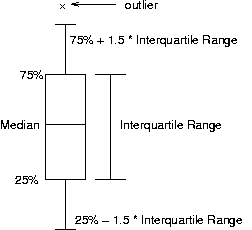
While dealing with a data set, the term “Outlier” refers to data points that are relatively away from the majority of the data points. Many of the statistical tools and methods work on identifying and differentiating data points that are considered as part of mainstream and that which are considered or suspected as not belonging to the mainstream data. The science of data management has defined many statistical distributions to which the behavior of data is associated, depending on the type of process or activity from where the data is generated. These distributions have their characteristics and properties, based on which we can decide the probability of a data point belonging to the population represented by the distribution. For any data-point that is picked up as the outcome of a process, if the probability of that data-point falling within the distribution is lower than a set threshold, then such data-points are suspected as “Outliers”. Now the question comes “If such improbable data-points (Outliers) do occur, is there something abnormal going on?” “Could it be a measurement error?” “Could it be a mix up of data?” It calls for an analysis. Outlier influence on Central tendency Consider a simple set of 10 data points representing the cycle time in seconds for a process. 30, 30, 32, 33, 30, 31, 60, 32, 30, 32 The average of the above data is 34. You can see one data point, 60, which evidently appears abnormally high, compared to the rest of the data points is apparent as an outlier. If we take the average of this set of data, ignoring this point, then it comes to 31.11. Now, if we ask which one, 34 or 31.11 represents the realistic cycle time of data set, the obvious answer would be 31.11. Thus, even one outlier could seriously impair our interpretation. On the other hand, if we take the median value, without ignoring any value, it come to 31.5, which is reasonably close to the mean value that was calculated excluding the outlier. So median is a better choice to represent central tendency, when we suspect outliers in a data set. Need for identifying an Outlier Outliers will indicate the possibility of assignable or special causes to be influencing the process from which the data is generated. It will help focus our attention to investigate such special causes and address them. If we are generating the data to decide the control limits for a control chart, then it is important to identify the outliers, exclude them and recalculate the limits. This process is called ‘homogenizing’ the data. However, if the amount of exclusion exceeds a certain threshold, the data will have to be discarded and taken afresh. If we are using data as input for machine learning, it is important that outliers do not confuse the data and the decision boundaries for the machine learning process. Methods for identifying outliers: 1. Box and Whisker plots The distance between the quartile I (Q1) and quartile 3 (Q3) is known as IQR (Inter Quartile Range). A data point falling below the Ist quartile or above the 3rd quartile at a distance of 1.5 times the IQR, then it is called as an outlier. 2. Normal distribution principles When dealing with variable data that is expected to follow a normal distribution, constructing a frequency distribution and plotting the normal curve will help in identifying outliers using the principles of normal distribution. (Only 0.27% data is expected to fall beyond the 3 sigma limits). The Z score method to determine outliers is based on this principle. 3. Statistical Control Charts: While using a data set to decide the control limits for a control chart, the data points that fall outside the control limits are eliminated as outliers and the control limits are re-calculated. To conclude, identification of outliers in a data set help in understanding and studying special causes and addressing them as appropriate. When we use data for setting up a baseline, standard or for machine learning purpose, it is important to identify and isolate the adverse influence of outliers. It is possible to associate data sets with applicable statistical distributions and identify outliers with high degree of objectivity.
-
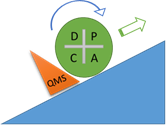
We may start responding to this question by having a brief look at the levels of maturity for a process. The concept of maturity levels have been widely popularized by the Capability Maturity Model (CMM) brought out by Software Engineering Institute (SEI) at Carnegie Mellon University. The 5 maturity levels as per CMM model are Initial, Repeatable, Defined, Managed and Optimized. Though CMM is associated with software processes, the concept can be seen with a generic outlook. The levels of maturity for a process may be defined as follows: Level 0 – No formal process exists In this level, there is no process documented, but the activity still happens. High amount of human dependency and no repeatability is assured. Predictability in terms of achieving results within specified time line is poor. Any change in people can seriously impact the outcome and no formal knowledge transfer exists. Level 1 – Documented process: Basic level documentation exists for the process that would even have been approved by supervisory staff. However, compliance to this process is not guaranteed. It is not sure that even if the documented process is adhered the process will deliver well, because, the documentation might not have been updated. Level 2 – Partial Deployment: In this level, the documented process is deployed, but with inconsistencies and incompleteness. The inconsistencies could be result of poor deployment discipline or due to lack of realistic updating of the documentation. Level 3 – Full Deployment: In this level, the deployment inconsistencies no longer exist and the process has been deployed with compliance and completeness. Better inter functional co-ordination and communication will be seen. Level 4 – Measured and Automated: This is a stage of maturity where process metrics are available being used for tracking the effectiveness and efficiency of the process against set standards. The process may also be governed by IT tools such as automated workflow or enterprise resource planning applications. Level 5 – Continuously Improving This is considered the highest state of maturity for the process. Not only are the metrics monitored for ensuring the process goals are met, but are also tightened for continual improvement using programs such as Kaizen and Lean six sigma. Continual improvements are done for automation and mistake proofing as well. Governance systems are in place for meeting the goals of the process as well as for driving continual improvement of the process efficiencies and effectiveness. From the above discussion on the Process Maturity levels, it is seen that the highest matured state (Level 5) actually calls for inbuilt system to ensure continual improvement of the process. Hence a matured process by definition does not imply that there is not further scope for improvement. In fact, a good level of process maturity is a pre-requisite for driving continual improvements. if we try to do a improvement on process that is not matured, we are likely to slip back on our gains and end up doing the same effort repeatedly. As depicted above, the famous PDCA (Plan, Do, Check, Act) wheel, (Deming Wheel), where, while we need to take the improvement wheel up the ramp, the gains have to be sustained by placing the wedge in the form of QMS (Quality Management Systems) to sustain the gains and prevent it from slipping back. Here the QMS represents the Process Maturity, which is a important pre-requisite for supporting continual improvement and also supports to sustain the improvement.
-
The Voice of Customer (VOC) is one important element during the Quality Function Deployment exercise. VOC includes stated and implied requirements of the customer. The QFD helps in ensuring that all the elements of the VOC are addressed by the process and also provides a quantitative expression as to how much of each characteristic is addressed by the associated process / process steps. The Critical to Quality (CTQ) characteristics are also identified and subjected to the extra attention and care required from the process. The Strategic Business Objectives form one of the key starting points for the Policy Deployment exercise as part of Business Process Management. Here the Voice of Business (VOB) forms a key input, being the primary need of a business and its stakeholders, including profitability, revenue, growth, market share etc. Some situations where we encounter conflict between VOC & VOB 1. Pricing of a Product / Service: This is one of the commonest factors where the VOC and VOB will undoubtedly have very strong negotiations. VOB will seek to maximize the margin of profits, but will have to maintain competitiveness. VOC seeks to get best price and this expectation will get calibrated by comparing with the prevalent competing offers. Here, one of the most important term that is used by VOB is that we should ensure that customer gets “Value for Money”. I would like to state the quote I picked up from one of my mentors “When we provide a product of service worth Rs.1, the customer should end up feeling that they obtained a service worth Rs.2”. However the same leadership also expects the VOB to be fulfilled. This is the challenge. 2. Quality requirements: For industrial products, Quality requirements are expressed quite clearly and in detail through specifications, drawings and standards. In the case of consumer goods and durables, Quality standards are set by the manufacturer based on various inputs from market and focused customer groups and past customer feedback. In the case of service industry, Quality requirements are expressed as part of service level agreements and are likely to be quite voluminous and subject to higher interpretation variations. Conflicts arise when interpretation variations and alterations crop up in quality expectations, especially after a contract is signed off. The VOB is likely to raise concerns relating to the feasibility of agreed pricing and delivery times, if there are differences in the Quality levels initially agreed. Close involvement of all concerned stakeholders, transparent discussions are key to reach a consensus. 3. Scope creep: Scope creep refers to changes, continuous or uncontrolled expansion in a project's scope, at any point after the project begins. To a large extent businesses will accommodate changes that creep in after the initial agreement, honoring the customers’ needs and considering long term relationships. However, beyond a certain point of time, the VOB is likely to raise questions upon accepting such scope changes without reviewing or revising other contractual agreements. Again, the fairness of the expectations would also have to be seen, considering the competitive offerings available to the customer to strike the right balance between VOC and VOB. 4. Overbooking: This situation is commonly seen in flight bookings where the airlines tend to overbook in anticipation of certain amount of last minute cancellations. The VOB wants to maximize capacity utilization as much as possible. Sometimes, it results in some customers with valid reservations to go without seats. Although the airlines try to compensate by providing accommodation and other benefits, not every customer would be happy about such deprivation. The same analogy may be made for other businesses, where anxiety of not losing the order could trigger over commitments, but sometimes end up with under delivery. The ‘over ambitiousness’ of VOB rubs VOC. 5. Forecast vs Actual: There could be cases where we have an ongoing customer contract for which a monthly forecast would have been provided by the customer to their vendor. It could be an Auto manufacturer giving a monthly forecast to supplier or it could be a Health Insurance company providing forecast for claim volumes to be processed every month. The vendor invests and plans capacity, hires resources and sets up equipment as per the forecasts. Where the demand exceeds the forecast for a particular month, it puts the vendor under pressure and where the demand falls short of the forecast, the vendor suffers capacity utilization. Such conflicts are seen between the VOC and VOB. If the vendor, as part of their business do their independent homework on the market / customer trends, apart from the forecast provided by the customer, they would be able to apply realistic flexibility on their plans and investments. 6. Change requests: Change requests from customer for a running business could require investments from the supplier organization. Carrying out changes in a running business may not be very easy, without disrupting the flow. Change management system has to ensure that the effectiveness of the change is ensured, at the same time no adverse impact is resulted. The VOB may sometimes find it tough to accept the demand of the VOC, but considering the priority for an existing customer, will have to take risks and yield. Elaboration of the change management related terms and conditions in the Service Level Agreements could help bridge such expectation gaps between VOC and VOB. 7. Long term business interest: Several situations would require the VOB to adjust itself consciously considering the long term business relationship with a customer. For instance, if we are provided multiple business accounts by one customer with varying profit margins, we might consciously undertake with discretion, to serve some business accounts that may not be profitable at all. Such decisions are taken in the larger interest of maintaining the overall set of accounts in the long term. The P&L heads for such accounts will feel the conflict between the VOC and VOB. Appropriate prior communication and involvement of such P&L heads in such strategic discussions would help ease out these situations. 8. Moments of truth: Moments of Truth (MOT) is a phrase that refers to instances where the customer is provided an opportunity to form / change his/her impression about the company (or service provider). These could be very customized instances to deal with unique situations with customer; and sometimes one may have to deviate from the usual VOB. I can recall one instance when I had to be bold enough to host a customer, very upset due to product performance, to my organization and give him an audience by key functions in the organization and get the product fixed right in his presence. This is not an activity that is normally permitted and obviously cannot form a precedence; neither was I authorized to do so. However, it worked magic with the customer whose impression was transformed and it also helped to gain a sizable order. Hence, MOT is something every organization needs to sensitize its employees, and should have a way of getting it exercised with employee discretion, when a situation demands, although it may temporarily appear as a conflict between VOC and VOB. 9. Competitive rivalry, predatory pricing: These wars are common especially with consumer products and services. We do see competing companies, usually large organizations with multiple business lines, offering what appear to be unreasonably low prices for selected products / services, to rapidly gain market share. This puts huge pressure on the VOB for the smaller organizations that are more dependent on that particular line of business. It is very important not to falter on addressing the VOC under such circumstances. One has to be very patient, but focused on providing the best value to the customer, who finally takes the call. To conclude, both VOC and VOB and very important for the successful sustenance of a business. While the intention of VOB is to satisfy the needs of VOC, sustenance is possible only with business growth. So long as the ' VOC vs VOB' conflicts help in constructive decisions and strategies, it will be Win-Win in the long run.
-
The set of seven wastes of Lean, popularly known as TIMWOOD (Transportation, Inventory, Motion, Waiting, Over production, Over processing, Defects) is certainly a good concept to keep tab on continual opportunities for efficiency improvement. The question about putting these concepts into good use in the organization will have to be responded depending upon its timing. i.e. if we address this question: While setting up a new operation, or new process, then we can think and plan in a preventive manner Otherwise if we are dealing with a well-established process, we have to think in a corrective manner, unless we can afford for a full-fledged process re-engineering For the first case above, where we are setting up afresh, the set of activities would be as follows: Start with understanding the product, the customer requirements, and specifications and perform a QFD (Quality Function Deployment) exercise. Every requirement needs to be understood and clarified so that we then design the process to address the customer requirements as precisely as possible. This will help in controlling the wastes; viz. Defects and Over processing. (Here an example of over processing could be making a surface more glossy than required, due to inadequate understanding of the specifications) Obtain the detailed process mapped along with the locations as per the floor layout. Identify the opportunities to reduce Transportation. If the process layout is designed to reduce transportation, it also helps to control Inventory to an extent. During study of the process and floor layout, another waste, i.e. Motion may also be addressed to the extent possible. Good work station ergonomics, selection of right equipment for each job, form part of the preventive steps to reduce avoidable Motion. Another issue that need to kept in mind during the process design review is the balancing of production line, otherwise would result in another waste; i.e. Waiting. Apart from balancing, the choice of equipment to reduce breakdowns, set-up time etc. would also help preventing waiting time. Not having adequate flexibility to have quick setup changes can lead to another waste; i.e. Overproduction. Due to higher setup change over times, we may tend to overproduce to avoid running out of stock of any particular part. For the second case, where we have an already established process: As the first step concentrate on the waste, Defects. Here we are considering even a delayed delivery as a defect. It is important to ensure whether the defect rate is under control; and whatever work that we undertake to reduce the other wastes should not result in an adverse impact on defect rates. The next step is to look at those waste elements that can be dealt without having to do a major re-engineering of the process or layout. It may sometimes not be easy to segregate those waste categories, since this element may be part of each category. Simple workplace modifications, training and ergonomics could bring down the unwanted Motions. Adhering to work instructions and compliance to process control would contribute to reduction of Defects. A good production planning system on “pull” basis can help in Inventory control, as well as Over Production Uncomplicated modifications in the layouts could reduce Transportation. If we are engaging vendors, they can be encouraged to set up shops close by to reduce Transportation. A good preventive maintenance schedule and compliance will help in reducing Waiting due to downtime. Inexpensive line balancing methods like resource planning, additional stations for critical bottlenecks could help in reducing waiting times as well as Over processing. The decision of going for a major re-engineering of the process and layout has to be taken, considering the cost-payoff and tenure of the business
-
By and large, we come across situations where we favor the mean value of the outcome of a process (central tendency) to be focused around a specified targeted value with as less variation as possible (dispersion). There are situations where the variation assumes relatively higher importance than the central tendency; mostly because higher variations are more intolerable than some shifts in central tendency. Interestingly, there may be certain situations where variation or controlled variation is advantageous as well. Study of Process Potential: The process potential index Cp is used to study the variation, or spread of a process with respect to specified limits. While we study process potential, we are interested in the variation and not in the central tendency. The underlying idea is that if the process is able to maintain the variation within specified limits, it is considered to possess the required potential. The centering of mean can always be achieved by setting adjustments. Or in other words, if Cp is not satisfactory, Cpk (process capability) can never be achieved, since Cpk can never exceed Cp; it can at best equal Cp. Many examples where the variation is generally considered unfavorable to the outcome: 1. Analysis of Variance While evaluating whether there is a significant difference between means (central tendency) for multiple sets of trials as in ANOVA, the variation between sets and within sets are compared using F tests. Thus in such situations, the variation comparison assumes high importance. 2. Relative grading systems For many competitive examinations, the concept of ‘percentile’ is used, which is actually a relative grading system. Here, more than the absolute mark by a student, the relative variation from the highest mark is more important, thus the relative variability becomes key decisive factor. 3. Control chart analysis While studying a process variation using a control chart, first the instability and variation are given the importance. Only if we have control on these parameters we will be able to meaningfully study the ‘Off-target’ i.e. the central tendency. 4. Temperature variation in a mold While performing certain compression molding process, temperature variation across different points on the surface of the mold does more harm than the mean temperature. Here the mean temperature is permitted to have a wider tolerance, but the variation across mold does more warping of the product. 5. Voltage fluctuations Many electrical appliances get damaged due to high variation (fluctuation) in the voltage, although the mean voltage (central tendency) is maintained. Controlled variation is favorable: 1. Load distribution in a ship While loading a ship the mean value of the load can vary, but the distribution of the load is more important to maintain the balance of the ship on water. 2. Science of music Those who understand the science of music would agree that more than the base note, the appropriate variation of the other notes with respect to the base note is extremely important to produce good music. Some examples where variation is favorable: Systematic Investment plans (SIPs) take advantage of the variation in the NAVs to accumulate wealth. Here even an adverse shift of the central tendency is compensated by the variation! Law of physics states that Force = Mass x Acceleration (F = ma). Thus, if we consider speed as the variable, it is the variation of speed that decides the force and the mean speed (central tendency) appears to have little relevance.
-
It is true we have learned that “Continuous Data” is always preferable when available than “Discrete” data. More precise statistical analysis would be possible with continuous data. For process analysis, identifying improvement and for comparing and measuring improvements, continuous data, is more amenable. However, it is quite surprising that there are many situations where we actually deliberately present a discrete representation of continuous data. Let us examine a few assorted situations as below: One of the most common examples that comes to our minds is the usage of “Go / No go” gauges, where a variable parameter is converted as attribute for quick decision purposes. A control chart uses continuous data, but when it comes to a decision for action, it is based on a set of discrete rules like “whether the point has fallen outside limits or not”? Hypothesis tests for variable data such as‘t’ tests, finally rely upon a ‘Yes / No’ decision of whether the P-value is greater than 0.05 or not. There may be occasions where we prefer to pay for certain commodities say apples, oranges, on a count basis, even though it is possible to weigh them. In Supermarkets all items are packed and barcoded, so the count method is used for billing than the exact weights We say that “I am 30 years old” and do not say that “I am 15,768,213.34 minutes old” Although time is a continuous data, when we talk about our age, we are actually ‘counting’ the number of years, and not using a continuous scale! Schools prefer to use grade system than the actual marks to denote a student’s performance. When someone asks a question “How punctual is he?” we would not answer by providing a frequency distribution of his arrival times, but rather provide data on ‘how many days did he arrive on time during a month’. Turn Around Time (TAT) can be measured as a continuous characteristic; however most customers who outsource data capture process, specify TAT requirements on discreet basis. For eg. “96% of production should meet TAT of 24 hours and 99% of production should meet TAT of 48 hours”. Although volume of fuel is measurable in the tank of a vehicle, a discrete method of a warning light coming up when it reaches a certain level is highly preferred. A ‘dip stick’ with the high and low indications marked on it is commonly used to check the engine oil levels (and not a volume meter!) Pulmonologists use an equipment to test lung capacity, where 3 colored balls re used in a blowing device, and displacement of the balls is observed upon blowing. This discrete method replaces the otherwise continuous data on the rate of air displacement Interestingly, a histogram is a tool used to represent continuous data in a discrete fashion. Each class interval is counted and the represented by each vertical bar of the histogram. This method allows easy representation and interpretation. Ready-made dresses are classified for sizes as S, L, XL, XXL etc. which actually represents different ranges of measurable dimensions. The above examples illustrate the fact that: Even though we use continuous data for various purposes, when it comes to the final decision, we have to go discrete. For certain objective decision making in our day to day activities, discrete data would be easier to measure and interpret.
-
About ‘Tribal Knowledge’ In the Business World, Tribal Knowledge refers to certain information that is restricted to the minds of certain people in an organization. Unfortunately, such information has not been documented and thus not known by many others, whereas such information may be very important for the successful business outcomes, say, Delivery, Service and Quality. I remember one of my leaders once saying “Much of what we have can be built by someone else, be it our buildings, our machinery, our technology, our process and so on. But what would be most difficult to replicate is what goes on in the minds of our employees; the knowledge, the unique set of skills, experiences and the organization culture”. This clearly addresses the importance that has to be attached to the experience of a workforce in the organization, that is built over the years. It is very important to continually attract fresh and younger talent in an organization. However, instilling a culture that will foster a healthy collaboration amongst the fresh resources, experienced resources within the organization and experienced resources who have joined from other organizations. Unlocking, Capturing and Harnessing ‘Tribal knowledge’ For various reasons, Tribal knowledge prevails in any established organization, despite the best efforts of documented systems. Some thoughts on Unlocking, capturing and harnessing tribal knowledge are as below: 1. Has to be an ongoing activity: Many a time the need for specialized knowledge will be felt when the concerned individual is not available or has decided to leave the organization. The scramble for knowledge transfer or desperate attempts to retain the individual are not uncommon. It is important to take stock of ‘Tribal knowledge’ from time to time in all areas of the organization, and proactively get them addressed. 2. Identify the pockets of such knowledge: Some of the typical areas where we may have such confined knowledge are Technology, Customer relations, Quality, Maintenance etc. Software applications developed and maintained for years would have undergone several revisions and modifications and would have resulted in a complex set of coding that may be difficult to decipher for a new engineer. Very often any change attempted on such codes result in unwanted adverse results that could trigger Quality and delivery issues. Customer relations would have long term experience and rapport established with specific individuals with the customer, all of which are difficult to transfer as knowledge. Maintenance folks would have attended to numerous problems and helped to restore equipment to avoid downtime and production loss. At time of emergency, everyone would have been anxious to get the production up and running and the discipline of maintaining detailed documentation might not attained the priority. This results in the growth of ‘tribal knowledge’ with the maintenance staff. Areas like Finance and cost accounting are usually covered by robust documentation, internal and external audits, which help to keep them at relatively higher transparency levels. However, these ‘knowledge pockets’ would vary from organization to organization and need to assessed periodically. 3. Map such knowledge pockets with the individuals who hold them The question “what could get impacted if this person quits the organization?”.. Needs to be asked for all employees, especially those with longer tenure. Once the knowledge reserves are associated with the individuals, we will be in a position to work on them before it is too late. 4. Examine whether the ‘Tribal Knowledge’ accumulation was unintentional or intentional? Each case of the ‘knowledge pockets’ identified need to be examined to understand whether it is intentionally being created or not. Over time, employees holding on to specialized knowledge could be an effect of insecure feeling. The possession of such knowledge or skill makes them critical in the organization and could lead to tendencies of confining such knowledge. However, in many other situations the ‘tribal knowledge’ accumulation would not be intentional and could have been the result of lack of organizational systems and planning. In the latter case, once the organization decides on a knowledge transfer program, we would not have any ‘will’ issue to be tackled. 5. Decide upon pro-active knowledge sharing programs: Functions like HR, Training, TQM along with concerned functional leaders need to embark on a time targeted program to continually convert the confined knowledge to organizational knowledge. Some of the stratification that may be done are: Number of employees nearing retirement age in near future - assess potential tribal knowledge residing in them Employees whose critical knowledge could be tempting for competitors to lure them Possessors of knowledge that prove critical in times of an emergency Other knowledge pockets that are important but may not be as urgent as the ones above. This will help in setting the priorities for the Knowledge sharing / transfer program. 6. Knowledge conversion – Execution Retirement employees – Plan for retention / extension of retiring employees with required knowledge. Some of them may welcome such extension and could even work out flexible working arrangement to suit mutual convenience. If the retired employee extension is not workable, explore the possibility of hiring them on contract basis for providing the knowledge transfer. For knowledge intensive processes, introduce ‘buddy system’ where such jobs will be performed by 2 or more employees together to ensure larger spread of knowledge and skills. Where the ‘tribal knowledge’ dependency is for process or technology applications that are due for updating, institute program for replacing them with newer applications that will not only be more updated but also be better supported for service. Leverage systems like ISO 9001 and other Quality Management systems where adequate multi-tier documentation is mandated and subjected to periodic internal / external audits. Procedures, methods and technologies could be documented to a large extent, but ‘skill’ is something, where documentation is necessary, but may not be sufficient. For this, many of the human related actions discussed above will have to be performed pro-actively on an on-going basis. 7. Importance for harnessing and preserving ‘Tribal Knowledge’ Knowledge, tacit or explicit, has to be considered as a treasure for the organization. Adequate management attention and priority has to be allocated for ensuring on-going capture, harnessing and preserving this knowledge in the organization. This activity should be included as part of the annual budget exercise and reasonable funds allocated. It is sure to pay back and more important, control and prevent erosion of the knowledge treasure.
-
What would an excellence practitioner lose if he does not utilize the concept of rational subgrouping in the pursuit of process improvement? The principle underlying the concept of Rational Sub-grouping As per the Central Limit Theorem, the distribution of sample averages taken from a population will be normal distribution. The sample mean value of the sample averages will equal to the population average and the standard deviation of the sample averages will be σ / √n, where σ is the population standard deviation and n is the sample size. This principle is used for deriving the control limits for a control plan. By Rational sub-grouping, we mean samples taken in succession during a particular time. Usually the number of samples in a rational sub-group (i.e. the sample size) will be very small, say, 4 or 5. The next such sample has to be taken after a time interval. The reason for taking the samples in succession is to ensure that they will (predominantly) have only variations due to chance causes, since they are produced under very similar conditions. The reason to keep the sample size small is to minimize any assignable variations that could creep in due to too much time gap between samples. The below table gives a representation of how data may be organized in sub-groups. What if an excellence practitioner does not utilize the concept of rational subgrouping? Let’s consider the following possibilities, instead of picking up the rationalized sub-group as explained above. 1. If he picks ups one large set of samples with no sub-groups: Using such a sample, he will be able to prepare a frequency diagram with class intervals and study the characteristics such as mean and overall variance. The two types of variation, i.e. due to chance causes and assignable causes will be combined and he would not be able to distinguish them separately. He will not be able to construct a control chart to assess the different types of variabilities. 2. If he picks up sub-groups with large no. of samples in each sub-group: Each sub-group is likely to exhibit variations other than chance causes. This can magnify the range and widen the control limits, if a control chart is constructed using this data. This will reduce the sensitivity of the control chart to detect instabilities. 3. If he picks up the samples for the sub-group with larger time interval: Any variability due to special causes that could have happened between the intervals could be missed out. The causes that lead to any drift of mean value or expansion of variation (range) could get unnoticed. This could impact the correctness of the control limits derived. 4. If he does not give sufficient intervals between picking up each sub-group: The conditions of samples in one subgroup are likely to overlap with that of adjacent sub-group, depriving the practitioner from obtaining a realistic ‘between’ subgroup variation. This could result in reduced R values and lead to narrower control limits. 5. If he picks up just one (or two) sample each time: In the case of picking just one sample, the range will not get estimated and there will be no possibility of working out the control limits. In the case of picking just 2 samples, he is at risk of narrowing the range and hence the control limits. Thus, by not using the concept of rational sub-grouping, practitioner will fail to come up with the best assessment of the 3 types of variabilities viz Instability, Off-target, and Variation the existing process

-
The key elements for any business excellence program will include Leadership commitment, Strategic focus, customer orientation, Fact based Management, Human capital management, Process management, Result orientation and Continuous Improvement. Keeping the above in consideration, a Business Excellence Sponsor (referred to as B.E. Sponsor) would be expected to possess certain qualities, of which, some are discussed below. 1. Visionary thinking: Business Excellence is all about bringing positive change and transformation. A B.E. Sponsor should be able to imagine and envision the kind of transformation that is to be expected through the business excellence program. This would require constant exposure to industry best practices and leading success realities, based on which the vision may also undergo continual updating. 2. Strategic Thinking: Strategic Thinking is going to help convert the vision to missions that would be executable. Such thinking is futuristic and assists to conquer and overcome obstacles that come in the way of proceeding towards one’s goals. Many a time the strategic thinking will propel modifications and improvisation of the approach and methodologies to reach the business goal. 3. Business Acumen: Any Business Excellence program is going to be considered value adding only if it aligns and help achieve business goals. It is important that the sponsor is keen and quick in understanding and dealing with a "business situation" (risks and opportunities) in a manner that will steer the business excellence program accordingly. 4. Team Leadership: The B.E. Sponsor will have to closely work with the organization’s leadership team and help them translate the Strategic business goals to objectives that are deployed as Projects and Programs with accountability. An effective policy deployment exercise could bring out clear linkage between set of projects that are aligned to the overall business goals of the organization. 5. Perseverance: Getting a set of projects deployed and effected through a group of leaders may not prove an easy task and will certainly encounter challenges and resistances, even from stakeholders. Progress may not come by every time as planned and committed. The sponsor will have to be patient, good listener and perseverant to follow the progress of the programs and provide support as required. 6. Objective Decision Making Decision making and getting decisions made are important qualities for a B.E. Sponsor to overcome issues and to keep the program moving. Many a time we say that “Making some decision may be better that remaining indecisive”. This quality also aids the quality of adapting and managing change. Objective decision making also associates with “Fact Based Management”, which is an essential element of a Business Excellence Program. 7. Persuasiveness: Especially when the sponsor is nominated by the Executive Leadership Team, he / she will have to approach them to obtain certain decisions, approval. Providing appropriate justifications and convincing them requires persuasiveness. Similarly this quality is essential to get many teams at peer or other levels to accept decisions and changes as may be required from time to time. 8. Change Acceptance: Despite fixing the objectives and approaches, there could arise the need to change priorities and programs due to various factors, some of them could also be unprecedented. The ability to accept, adapt and manage change successfully to get the organization back on the B.E. track is an important Quality for the B.E. Sponsor. This quality is connected to the decision making quality and also the persuasive quality. 9. Process and Result Orientation: Process Management is key for sustained results. The entire Business Excellence Program is going to be considered any good and supported only if it links up to positive business results. Sometimes it may be important to show ‘quick wins’ to secure the confidence of the Top Management to continue support the program. Good balance of process and result orientation is an essential quality for the B.E. Sponsor. The above are some of the typical traits that are expected from a B.E. Sponsor and would not be exhaustive. It may be kept in mind that the styles of management differ from individual to individual and when we observe many successful sponsors, we may expect variations in the manifestation of these qualities.
-
About Baseline One of the requirements of the Measure Phase in Six Sigma DMAIC cycle is the Baseline measurement, sometimes expressed as Baseline Sigma. In fact it is hard to tell whether the baseline data is required as part of the Define phase or Measure phase. Ideally, if we need to give the problem statement, which is expected to cover What, When, Magnitude and Impact. The ‘When’ portion is expected to show the metrics related to the problem for a time period as a trend chart, so that we can see the magnitude of the problem and the variation over a period of time – and acts as a baseline. Baseline certainly helps to act as reference to compare and assess the extent of improvement. Baseline is important to get a good measure of the quantum of improvement and in turn to quantify the benefits in tangible terms. However, the following discussion brings out certain practical challenges related to Baseline. 1. Baseline metric did not exist, but is it worth post-creating it? Suppose we are trying to improve an electronic product, based on certain customer complaints, our project objective will be to ensure that the incidents of customer complaints should be reduced or eliminated. Upon subjecting the product to a special lab evaluation, we could simulate the failure. However, a reasonable baseline metric will be possible only if we subject a set of sample units for a certain period of time. This could prove quite costly and time consuming. On the other hand the solution to the problem is known and we may proceed with the actions. Since our goal is to ensure zero failure, under the given conditions and duration, comparison with a baseline is not important here. Many a time, when the company is anxious to implement the improvement to get the desired benefits, be It cost or Quality, it may not make much sense to build up a baseline data, unless, it is readily available. 2. New measurement methodology evolved as part of improvement Let’s take an example of Insurance Claims processing, where the payment / denial decisions are taken based on a set of rules and associated calculations. The improvement being sought is to reduce the rate of processing errors. However it was only as part of the improvement actions that an appropriate assessment tool was evolved to identify and quantify the errors by the processors. By this time, the improvement has already begun and it is not practically possible to trace backwards to use this tool and get a baseline measurement. 3. When improvement is for ‘Delight factors’ Often we introduce enhancement features on product, for example, new models / variants of smart phones. In such cases, the emphasis is more on the delight factors for customers, for features that they haven’t experienced earlier and any baseline comparison may not have much relevance. 4. Integrated set of modifications Let’s examine another scenario where a series of modifications were implemented on a software application and was released together as a new version. Here, the set of actions taken influenced multiple factors, including performance improvement, elimination of bugs and inclusion of new innovative features. In such situations, any comparison with a baseline performance to the current will be very difficult and would have overlapping impacts. If we still need to do a comparison before vs after, we may have to do so after factoring and adjusting for such interaction effects on the pre / post improvement outcomes. To conclude, in general, a baseline metric is an important information that we require to compare the post improvement results – However, it has to be borne in mind that certain situations challenge the feasibility and relevance of using a baseline measurement.
-
Rework, as would many verbs that begin with “Re”, signifies that there has been a related preceding activity. In the industrial world, rework is immediately associated with poor Quality and efficiency. Most lean programs aim to reduce wasteful efforts, of which Rework is one. The most common reason for a rework could be because of limitations of the process capability, due to which a percentage of products will fall outside certain specification limits. It may not be desirable to go for zero rework always. The decision to improve the process capabilities to reduce the rework will have to be based on certain considerations viz. Investment cost, tenure of the business, the cost of rework etc. Sometimes, it could be a result of an assignable variation that ended up with non-conforming parts by the time the process could be restored within its limits. Let’s also consider the following different examples that denote activities that arguably fall within the definition of “Rework” 1. Post shipment reworks: Many a time Product recalls happen based on field failures or based on information about some possibilities of reliability issues realized after a product has been shipped. We have seen even major auto manufacturers recalling vehicles for certain part replacements. Many software products have the practice of providing update patches to overcome bugs or deficiencies on already launched products 2. Customized products: Certain products require the customer to perform trials / evaluation, only after which the corrections will be made before the final release. Popular example is how a tailor provides a ‘trial’ session for the customer, based on which the dress may be reworked before the final stitches. Several “made to order’ products are subjected to a site inspection by the customer and some reworks may be performed. Some times for complex products say “a special production equipment”, the final requirements may get clarified after the product has been built to a certain extent. Important documents, books etc. are subject to ‘proof reading’ and edits before the final print is done. For the above kind of situations, attempting to avoid rework fully, may prove costly. 3. Avail automation benefits: Today’s world we have automated methods of data recognition and capture, which greatly speedens the process, but will have to go through manual verification and edits to reworks some errors. We would have seen the fast billing method in supermarkets using bar-coding technology. However, occasionally this could fail on certain products, which forces the billing agent to do a manual keying. For above kind of situations, the benefit of automation exceeds to cost / effort of limited rework. 4. Not fully certain about outcome of the process: Certain medical treatments are changed or modified based on the reaction of patients, and this could vary from patient to patient. A method called progressive evaluation is used for Training processes, where based on the scoring pattern of the recipients, the training process may have to be reworked. 5. “Made for each other” parts: Certain processes need the product to be fitted upon its counterpart to decide the kind of rework to be done. Eg. Gears need to be lapped with the mating part; engine valves need to be polished based on the seating with the engine base. A dentist reworks a dental crown to final dimensions after placing and checking on the patient’s gum These parts are made for each other and need to continue to operate together 6. Unpredictable market expectations: Sometimes a finished product may have to be modified to suit the varying taste of market. For eg. The change color of a consumer durable product. Rework may also happen on the design of a product that has been launched – This could be an ongoing change to incorporate market feedback or changing needs. To conclude, the term “Rework” does imply a job being not done ‘right the first time’. However, the scope and type of improvement efforts will have to be decided appropriately based on the situation
-
Let me start with interpreting the 3 types of analytics in the BA world as per the below table. With the brief understanding of the 3 types of Business Analytics as above, we assess their coverage in the prevalent Lean Six Sigma practices. Descriptive analytics is an area that is widely covered by lean Six Sigma approach in terms of data collection for past events and interpretation, during the Define to Measure phase. The popular tools such as histograms, descriptive statistics, control charts, all perform the task of providing insight into the past performance, which will be useful for proceeding to diagnostic analytics and determine the causes. In today's world, with high data aggregation, mining and computing capabilities, the descriptive analysis is possible using big data and make it more 'real time'.This could further support and enhance the descriptive analytics that is already a part of lean Six Sigma program. Predictive Analytics is also an area covered in our existing Six Sigma cycles. Control charts are examples that use a predictive approach to prevent the occurrence of non-conformance using the statistical control limits and the probability based rules for instability. Regression exercises using multiple variables are good examples of predictive models. Response Surface Methodology is a collection of statistical techniques giving rise to an empirical model to predict the settings for optimum output response. Through Prescriptive Analytics, we expect a best course of action under given situation. While Lean Six Sigma tools, be it Design of Experiments, Value Stream Analysis etc. do provide with actions or optimal settings for getting the best outputs, this could be an area for vast improvement. In the modern world prescriptive analytics looks for patterns and inter-relationships based on large amount of historical data, which could be unstructured, which is dynamic in nature. The prescriptive analytics also combines the algorithms and business rules along with established patterns based on descriptive analysis. There is the concept of "machine learning", though which we season a computerized system to continually modify predictions and prescribe the best and up to date options.

-
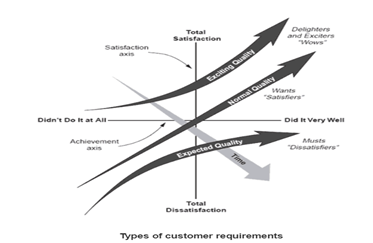
I am depicting the Kano model below for reference and to proceed with the question Customer Requirements & Expectations Gathering The first step would be to gather all the customer needs, stated and implied, based on various methods. For a typical engineering product, customers provide detailed requirements as per drawings, specifications sheets and reference to standards. For a new consumer durable kind of product, the requirements will have to be collected using market surveys, focus groups and existing national and international standards. For service industries, it would be Statement of Work, Service Level Agreements and customer surveys. Classifying the 3 needs Once the requirements are gathered, the needs have to be classified into the 3 groups’ viz. Basic expectations, Performance requirements, Delighters. While the basic needs (expected Quality) and the Performance Needs are relatively easier to identify and list down, to identify delighters we need sharper thinking, higher exposure to market and customer sensitivity. The delighters are very relative to what happen to be the prevailing normal expectations in that region for that kind of product or service. Sometimes, whatever is considered as basic appears as a delighter due to compliance levels. For eg. If most auto rickshaws in the city do not comply with the metered fare requirements, one who just complies with it will give delight to a customer!! But once we had taxis available using the mobile apps, more people started preferring them, as the fares became more fair and predictable! Hence, one has to be careful about deciding the delight factors and they must be watched very carefully, as they may no longer be a delight factor depending upon any other competitive offerings or other market changes. Approach for Basic needs Having carefully classified the customer requirements, the exercise of QFD has be carried out. The highest level of reliability and process robustness has to be ensured for the basic expectations, since any failure in meeting them can not only erode the customer satisfaction, but can result in serious loss of credibility from customer, that would be very difficult to recover. We have seen how certain popular branded food products lost customer confidence overnight based on reports of not satisfying laboratory test requirements. Pharma companies have lost market and had stock prices plummeted due to non-compliance based on certain FDA audits. Approach for Performance needs The requisite design and process controls need to be developed and ensured for the Performance related parameters (termed as Normal Expectations in Kano). While these are parameters that will certainly cause a linear improvement in the levels of satisfaction, any repeated dips or failures could be considered equivalent to failure of basic needs. E.g. A refrigerator that fails to cool during the warranty period, but was attended promptly and restored – would still retain the satisfaction levels without much damage. However, if the service was not provided on time, it could result in serious dissatisfaction levels. Approach for Excitement Needs While the “Basic Needs” and the “Performance Needs” are taken care as discussed above, it is important to offer some “Excitement needs” at the time of launch itself, to give the Product or Service an edge over competitiveness. Unfolding of new “Excitement features” will have to be done in a planned and timed manner in cognizance with the market expectations and the competitive offerings. Timing is a very important factor for handling the “Excitement Needs”, since most of them will migrate as “Basic Expectations” over period of time. E.g. In today’s world offering a camera along with a cell phone is no longer an exciting feature, but a basic expectation.
-
Case for Statistical Significance – an example Let’s consider the following data that is the age of 10 employees. 42, 35, 24, 31, 33, 41, 33, 31, 33, 32. Assume these 10 data points are a sample that represents a large population of say, over 5000 employees. Now, using this available information we are asked a question “whether the average age of the employees in this population can be considered equal to 30 years?” The quickest thing that anyone would do is to compute the average of the samples, which comes to 33.5. Since this is 3.5 more than 30, can we say that the population average age will be more than 30? These are situations where there is bound to be judgmental subjectivity and likelihood of reaching incorrect conclusions. This is a simple example of a situation where a test of hypothesis may be done and the concept of statistical significance helps to reach an objective conclusion. Statistical Significance – what does it imply? Statistical significance implies that the difference that is under evaluation, (whether it is a population average being compared to a specified value, or the averages of two populations are being compared, or the variances of two populations are being compared, etc.) can be considered as a difference that is significantly larger than what a chance cause variation would have caused. Since what we have is a sample data, it is to be noted that for different set of samples, the sample average is expected to vary with in certain limits for the same population (and same population average). The limits are governed by the variance of the population. The test of significance will evaluate, with the given set of data, whether the sample average is falling within the confidence limits or not. So long as the sample mean falls within the confidence limits, the conclusions will be that there not sufficient reason to believe that the population average represented by this sample is different from the specified value. Usage of Statistical Significance In today’s world the application of tests of significance has been simplified using statistical software such as Minitab. Once we give the inputs depending upon the case being studied, the application comes out with a P value, which is used to determine the significance of the results. Smaller the p-value, the evidence against the null hypothesis becomes stronger. Usually a p-value < 0.05 is used as the criteria for rejecting the null hypothesis; i.e. the difference is considered significant. As part to problem solving, tests of significance are integral part of Hypothesis testing, Analysis of Variance, Design of Experiments and other tools. It helps to take objective decisions with small samples. These methods are particularly useful during the Analyze phase where it helps to narrow down on short listed causes; and improve phase where the effectiveness of identified solutions could be validated.
-
Process stability A process is considered stable if its output is within predictable limits. The most popular method used for assessing process stability, when its output is a variable data, is by studying the frequency distribution of the output and ensuring that it follows a normal distribution. For example, the commuting time from my home to my office varies between 25 to 35 minutes, with an average time of 30 minutes. If I collect the data for a period of 100 days and plot a frequency diagram and see if I get a normal distribution, I can consider this commuting process as stable and predictable. The normality can also be tested statistically. Stability and Capability However, if I set an expectation that I have to always maintain a commuting time of less than 30 minutes, the above process, though it is stable, is not capable to meet my expectation. A car which is giving a consistent mileage for fuel consumption may be considered as a stable process, since it is predictable within a range, but need not be considered capable with respect to a certain expectation. Thus, it is possible to determine the stability of a process by using the output data generated by the process itself. However, the capability of the process is always by comparing the operating range of the process output with respect to certain specified expectation. The process capability could be impacted either due to a “mean shift” or due to “Excess variation” or both. When the overall variation of the process is less than the limits (USL – LSL), then the process potential is good. However, only if the process is centered in such a way that the variation is contained well within the specification limits, the process capability is considered as good. The range reference that is used for calculations pertaining to process potential and process capability is 3 standard deviations on either side of the mean. Illustration of Process Potential & Capability For example, the room housing a complex medical equipment requires a temperature setting between 16 and 18 degrees. However the data based on the existing air-conditioning equipment gives a range of 15 to 16 degrees. Here, since the range (2 degrees) is maintained, we may believe the process has the potential to meet the requirement, however the setting can to be altered to bring it within the required range to make it capable. On the other hand if the existing equipment’s performance varies from 14 to 17 degrees, we cannot bring the process within the required range by changing the settings. Then the process does not even have the potential to meet the requirement Process stability – is it a pre-requisite always? Process stability is always desirable, however it need not be a pre-requisite in all cases. Let us examine the following cases with examples: Spec limits wide enough to accommodate Suppose we have process whose overall variation is very low compared to the specification limits. The non-normality or the mean shifts would classify the process as statistically in-stable, however, it may not have a practical adverse effect. Eg. pneumatic clamps for holding a job in position. The air output from the compressor may not be stable due to the cut-off settings, but as long as the minimum clamp pressure is attained, it is acceptable. Robust designs Another example is the way many of the modern electrical appliances are built to work under a wide range of input voltage variations. Hence, even if the input voltage fluctuations do not constitute an output of a stable process, the equipment design is robust to work with those instabilities. Storage and release methods Where we depend upon certain natural inputs, which are subjected to spikes of variations challenging their process stability, we have little or no control. In such cases we no longer expect the stability of these inputs as a pre-requisite, but design our recipient processes suitably. Examples: · Wind is an instable input that is made use of by Windmills and subjected to storage systems that help in generating useful energy. · Natural water resources need not be stable but are consumed by a hydroelectric station to provide consistent power. · Varying Solar energy is harnessed by solar panel and batteries to ensure useful supply of electricity

-
Just because two variables have a strong correlation, it does not form a sufficient condition for a cause-effect relationship. Let us consider two events P and Q that have shown a correlation. The various possibilities may be examined as follows: 1. Event P may be dependent on Event Q (Direct causation) This is the straight forward and genuine conclusion that one may derive from a correlation. For eg. Days and Nights are caused due to the rotation of earth. 2. Event Q may be dependent on Event P (reverse correlation) How will it sound if we conclude that the rotation of earth is caused by Days and Nights? This being an obvious example, one may not make such a mistake. However, for not so familiar events, going just by correlation, the cause-effect relation may be mistaken in the opposite understanding. 3. Event P and Event Q may both be a resultant of a third variable, that acts as a common cause for both these events, but they do not impact each other. For example, we see a negative correlation between the number of people travelling by public transport and the farmers’ Productivity. In reality they are not correlated to each other but both the factors are influenced by another factor, viz. shortage of fuel. Hence more people started switching to public transport than using their own cars, and farmers were hit by the diesel shortage impacting their productivity 4. Event P causes Event Q; and Event Q causes Event P (bidirectional or cyclic causation) When more people invest in stock market, the market indices go up, which in turn would make more people to invest. 5. Event P causes Event R which in turn causes Event Q (indirect causation); Longer hours of work results in consuming more junk food, which in turn causes obesity. So we cannot generalize the expectation that obesity can be reduced by reducing long work hours. 6. In reality there is no connection between Event P and Event Q; it is a spurious correlation We find a correlation between the no. of cellphone users in India and the number of women joining yoga classes in UK. Practically they are not related, hence it is a case of spurious correlation The above scenarios and examples bring out the fact that while correlation exercise is a tool that would help us to eliminate certain suspected causes, it may not help us to ascertain a real cause unless we have a good understanding of the events and processes under study, the underlying logical or scientific possibilities of relationship. Many a time the relationship that is indicated by a statistical correlation may have to be validated by other tools or trials before we establish the cause-effect relationship.
-
Voice of Customer is an important factor while we work on understanding and deploying the customer requirements to design and process requirements. VOC is an essential input in preparing the HOQ (House of Quality) as part of the QFD (Quality Function Deployment) exercise. To illustrate certain situations where overemphasis on VOC may not be practical or desirable, the following examples are discussed: 1. Varying or even contradicting customer preferences: Consider an case of designing the features for a consumer durable product... eg Washing Machine. One of the varying preference could be the color combinations on the machine. Another varying preference could be on the capacity requirements. While the range of preferences may be addressed to certain extent in the design and product mix, it has to be limited to a certain meaningful scope that will ensure return of investment. 2. Feasibility, cost and technological competency: There would be times when the expectation of the VOC may not be reachable considering the gap in technological and process competency that may prove too much to bridge within a given span of time and investment power. For eg. If a normal passenger car manufacturer gets a requirement for a racing car, it practically may not be a requirement that they may want to attempt. 3. Statutory and safety standards: Irrespective of the VOC, certain statutory and safety related requirements, regulations. Upon overall interest for compliance to regulatory requirements, companies may have to override customer expectations. In such cases the company should have the ability to explain and educate the customer for such decisions. Eg. Contain engine performance in an automobile to meet the pollution norms; exercise adequate pre-conditions for withdrawing money from bank account, which might result in exceeding the expected waiting time. 4. Innovative Products: Innovative products could be a game changer for consumers where the design has to be conceived differently from the prevailing VOC. For eg. How the concept of Smart Phones emerged based on the innovation by Apple. Here, there is always a risk due to straying away from the existing VOCs, but if it succeeds, the payoffs could be tremendous. 5. Customers rely on supplier expertise: For certain products, the customers might rely on a popular brand that has been in existence and proven for long. Many a time the customer may not be knowledgeable in all features and would rely on the branded product, which would offer features beyond the expectations of a normal customer. This is a case where the company would like to provide features that were not even known by the customer. This would apply to various consumer durable products, electronic appliances, cars etc. and could result in customer delight.
-
Of the various types of Process Maps that are being used, I would focus my discussion on four of them. Viz. High level Process flow diagram, Swim lane Process map, SIPOC and Value Stream Mapping. However, the objective of each one of these mapping are also different. I will try to explain each as follows: The order of usage could be debatable, with some suggesting that we may start with SIPOC and then move into detailed work flow, Swimlane mapping and Value Stream to be done, when we want to do a lean study. I would recommend that we start with the simplest method, i.e. the high level process map, then enhance it to a swim lane mapping with responsibilities included. The SIPOC may then be developed. It would be a good idea to maintain the Swim lane mapping and the SIPOC for the specific advantages that each one is offering. The VSM will certainly require higher skills, insight and information gathering. Hence, the VSM should be a task that needs to be undertaken once we decide to do a Lean study and are prepared to undertake the same.

-
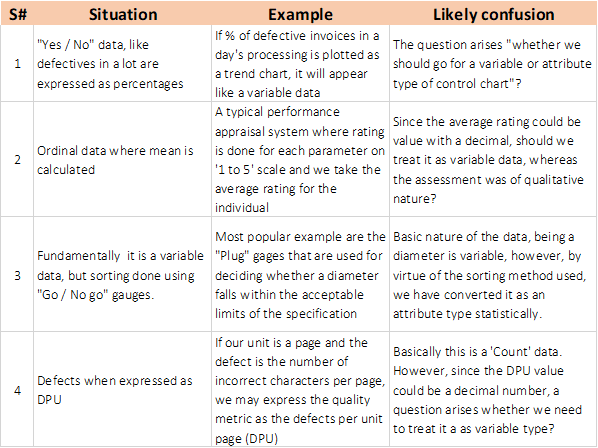
I am skipping the basic definition for Continuous and Attribute data, since all Excellence Ambassadors will be very knowledgeable on those. The following are 4 situations that I would like to discuss, where there is likely to be debate on the data type classification. It is to be noted that the basic nature of the metric alone may not be sufficient to determine the data type, but the assessment methodology also matters. The example of the diameter, when measured using a micrometer will be a variable data output, whereas when screened using a plug gage, becomes an attribute data output. However, the debates do continue on the other examples, where people do get confused when they see numbers with decimals, which they tend to associate with a variable type of data.
-
Correction is a reaction to a problem or undesired situation to provide an immediate remedy to save a situation. We need to put the "fire out" immediately to prevent immediate damages. The correction related action gives no guarantee on fixing the cause of the problem and hence recurrence of the problem is very likely. Correction, which may also be referred to as "Damage Control", once performed, we need to immediately attend to the corrective action that needs to be taken to avoid recurrence of the problem. Identifying an effective corrective action will be possible only if we know the right cause for the problem. For instance, if a fire broke out due to an electric fault, we may trace the cause as the use of inferior cables whose insulation resistance was not up to the required standard. Then, the corrective action would be to replace all the cables with the right insulation standard. However, the same action of determining the right insulation material in the first place could have prevented the fire altogether. Thus, the same action, which is termed as "Corrective action", could have become a "Preventive Action", had it been done pro-actively at the right time, in this case while selecting the cables. It would have been a complete preventive action if an FMEA had been done to identify all the possibles of a potential fire and taking the right precautions, be it on the design, materials or controls. Any of these actions if done, after a fire breaks out, will only become a corrective action, or at the best, if the lessons are carried over, a preventive action for any future installations. The below table gives a few more examples of failures, with the typical correction and corrective actions. The preventive action, that could have prevented the failure, is also given in the last column. It may be noted that the preventive actions are described as "should have been". It is hard to think of a situation where we need only correction and no corrective and preventive action. However for a new innovation, where we would be exploring something completely new with very limited background information and limited knowledge about failure modes, we are left with no option other than keep proceeding and attend to any failures that would crop up. Even then, there would be a learning from the failure and a causal analysis can lead to corrective action for similar situations. Another thought that crosses my mind based on our understanding about the types of variations, if a failure happens due to a common cause error, where the cause may not be easily controllable, it may be debatable whether it is worthwhile taking a corrective action, which might not prove cost effective. For instance take for instance the missing baggage in an airport. If the rate of missing baggage is very, very low, it may be better to do a correction on the failed instances, which would involve efforts in tracing out the baggage, re-transporting it, payment of compensation etc. as against implementing a systemic corrective action. However, such effort vs pay-off decisions will have to be taken depending upon factors viz. criticality of the failures, safety implications, impact on business credibility etc.

-
It is true that advanced Business Process Management Softwares are available that help handling of complex data and Big Data, whereas the Check sheets that we have learnt as part of the seven QC tools were meant for quick handling of data in an organized manner to derive inferences, especially in the shop floor. During the days when the check sheet was originally included as a tool for organizing data, so much of computer power or software were not available. For example, the check sheet with tally marks had the innovative way of grouping the data under a class interval in sets of five that enables easy counting as well as representation of the distribution pattern, which will evolve as the data is collected. In today’s world all this can be easily attained for much larger volumes of data using the computer software such as the BPM tools. However check sheet as a simple and quick way of data gathering will continue to have its relevance, existence and use, considering the fact that the availability of BPM tools may not be there in all situations. Even if available, one may not want to make use of the tools for certain one-off situations. Hence Check sheet will continue to have its place as one of the QC tools. Along with it, the existence of such BPM tools that are capable of handling complex and big data should also be included. I do not think that we have come to a stage where we can declare the check sheet as obsolete yet.
-
Kanban - Origin Kanban is popularly considered as a key term in the world of Lean processing and is referred to as a "Pull” system. It started off as a "Signaling Card", which controls the production flow using "Pull" system, that requires to release materials and resources into production as and when the customer demands them. The origin of this system, also often referred to as JIT (Just In Time) method, may be traced back to 1940s, when a Toyota engineer, Taichi Ohno developed Kanban to improve operational efficiency. The Kanban "pull" system helps in keeping the inventory of materials and resources under control. However the “Pull” system works only when the business is well dependent on the customer orders. Whereas if we are producing "to stock", it is referred to as a "Push” system”. “Pull” and “Push” systems Supply chain Management in today's world is greatly supported by the advances in Information Technology that greatly enables to move towards as much "Pull" systems from "Push" system. One interesting analogy that I came across was... the example for "Pull" system is an elevator that starts operating only if a passenger calls it. It could be even a single passenger for whom the process will be performed by the elevator. Whereas, if you consider an escalator that keeps moving, irrespective of whether there are passengers or not is more akin to a "Push" system. (Not considering the fact that even elevators, nowadays are equipped with sensors to start them only when a passenger steps on to it!) Very often in various businesses, there could be combination of "Push" and "Pull" systems. In an ideal "pull" system, when the order comes from the customer, the signal moves up the supply chain and the processes are activated to produce that part or product. This is possible if all the processes are synced up and able to feed their subsequent processes to meet the order delivery requirements, without having the need to pile up inventory. However in reality, there could be issues between processes to get a perfect synchronization to line up the materials and resources and could result in delay in fulfilling the order. This would necessitate to follow a combination of “pull” and “push” systems, maybe to maintain inventory of critical parts or high lead time parts. The more we are able to overcome these issues, we will tend towards more perfect "Pull" system. More examples on “Pull” and “Push” systems One of the modern world examples for pull system is on IT enabled services. For example, in the processing of Health Insurance claims, the entire supply chain (predominantly human resource based), is activated based on the order received. Similarly if there is an order for a major software development, a specific project plan is charted and the resources engaged accordingly until the order is fulfilled. There could be situations where we could be working based on forecast. One example is on having to stock up consumer durable goods, whose demand may surge during festival seasons. Here we do not wait for each customer order to execute a "pull' system. Another example could be on cultivation and processing of certain foods that are very seasonal dependent. Since the availability is in abundance during a certain season, maximum processing will be done and preserved as either in-process or final inventory. Conclusion To conclude, a "Pull" System is always a better one, but is constrained by certain practical factors. We should make attempts to overcome these factors by good governance and usage of Technology and move as much as possible towards a “Pull” system. However, a forced fit of “Pull” system may be detrimental in certain instances, where it makes sense to live with certain “Push” systems, fully or partially.
-
Understanding Chance causes and Special causes In our day to day life, we come across several variations and do our own judgement on what we want to consider as a "normal" or "abnormal" variation. If your son travels from his school to home every day by bicycle, and usually takes 30 minutes to travel the distance, you would not sense anything abnormal if he takes up to 40 minutes on certain days or if he makes it in 25 minutes on some days. However you will be worried if he doesn't turn up even after 50 minutes... or you might be surprised if he turns up within 10 minutes. This is because you have set in your mind a certain amount of variation that you consider as 'normal' , this time variation maybe due to evarying traffic conditions, slight variations in the energy level of your son's pedaling, variations in the tyre pressure and other conditions of his bicycle etc. The range of variation of the time that is considered as 'normal' is believed to be caused by "Common Causes", and we usually do not worry much about it. However, if the range of variation is beyond this expectation, say it took 60 minutes on a particular day, you are sure to get concerned and would expect that such a variation has occurred due to a specific assignable cause such as an unusual traffic jam, or his bicycle had a puncture to be attended etc.... and you are certain to enquire about the reason for the delay and would expect a specific answer. Such causes are also referred to as "Special Causes". A special cause may also result in him arriving earlier than usual expectation... Eg. the roads were free of traffic due to some strike and he could ride fast. Thus, the "Common causes" are expected to prevail every day, whereas the "Special causes" are not expected to prevail everyday. This concept of variation is applicable to all processes and statistical methods have been used to quantify and induce objectivity in the decision whether any process is under the influence of special causes, or just common causes. This is very important in a production process, where objective decisions have to be taken as to when to act, when not to act. When under the influence of common causes only, the behavior of a process is more predictable than when influenced by special causes. Significance of Control Charts One of the most popular tools that has been evolved by Walter Shewhart for distinguishing between Chance causes and Special causes is the statistical Control Chart, which has its limits and decision rules evolved based on the probability of an error happening outside the range of variation based on the standard deviation based limits. The expected behavior of sample means based on the central limit theorem, combined with the range charts (used for the variable data) set the criteria to decide when our actions for an 'special' cause occurrence will be highly justified. Why is it important to distinguish the special causes from the chance causes? This takes us back to a part of the discussion we had on the "False alarm" and "Missed alert". If we keep tweaking the process setting for variations that are actually happening due to Chance causes, we may end up drifting the process unnecessarily, and it could lead to more adverse consequences. Whereas if we fail to identify a genuine mean shift (or range shift) of the process, we would allow the process to operate in the non-optimal setting leading to creation of higher number of errors. Real world examples Let me illustrate with a real life example of a retail store. If we have to decide the number of salesmen based on the volume of sales, we would collect the volume of sales for such a product in that region for a period of past few years. We might see that the there could be certain instances of high volumes sales due to panic buying, say.. due to certain unprecedented natural calamities. Those data points (spikes) need to be treated as ones due to "Special causes". When we evolve estimated average sales volume, we need to remove such data points and do the working. Such a process is called 'homogenizing' the data, i.e. we are removing the influence of the special causes from the data. Otherwise, we would end up with over staffing and overall utilization will be poor. However, if we take a situation that involves a critical characteristic such as safety, we may have to consider the factor of safety to take into account even an abnormal situation that may arise out of a 'special cause'. For example, if we are designing the braking system for a vehicle, it will not be sufficient to design it based on the chance cause factors alone. We will have to accommodate in the design, the possibility of dealing with an extreme adverse situation, even if it falls into a 'Special Cause' category.
-
Why SIPOC is useful? SIPOC (Supplier, Input, Process, Output, Customer) is a tool that helps to channelize the thought processes while we do a process analysis. Very often we live with many processes around us. Each process will have its process steps and whether we mention it or not, each step will have a source of input and a recipient (or recipient process). It is quite common to see that the output of a previous process step will form one of the inputs to the next process step. Many a time the process steps and the associated inputs and outputs may be too complex to visualize, unless we do a systematic process mapping. SIPOC is an excellent method to do such a mapping. SIPOC mapping is very helpful in situations where we already have a process, but we wish to study it for identifying areas for improvement. Constructing a SIPOC The best order of developing SIPOC is to deptict the Process first by drawing the process steps in the right sequence. Then visit each process step and identify the outputs and the recipient for each output (customer). Then move to the input side and determine the inputs for each process step. Once inputs are identified, decide the source of these inputs (supplier). SIPOC as applicable in Six Sigma projects Usually while preparing the Project charter and definition for a six sigma project, we identify the overall objective as Big 'Y', and the sub-objectives as small 'y's. We may refer to these as 'Outputs' i.e. the Overall output and the intermediate outputs. The quantified metrics that indicate each of the outputs are referred to as KPOV (Key Process Output Variables). The SIPOC acts as a valuable tool to determine the KPOVs, both at the final and intermediate stage. Then, we need to identify the input factors (x) that influence the output factors. These input factors are the metrics relating to the inputs that feed into each process step. They are referred to as KPIV (Key Process Input Variables). Inserting additional columns for the KPIV and KPOV in the SIPOC, helps in our process analysis to depict the input variables as part of the potential causes identification exercise. How to handle SIPOC to be felt effective Determining the Process steps, the outputs and inputs for each step, has to be very hands-on exercise with involvement of the right stakeholders at the right levels of involvement in the process. Otherwise, the SIPOC may not be very reflective of the reality and could make one feel that it is not serving any purpose. Again, the SIPOC needs to be maintained as a live document for a given process, as long as the process is in existence and should undergo periodic assessments and updating as may be required. Further benefits of SIPOC A well made and maintained SIPOC serves as an important guide to clarify the various "Supplier / Customer" roles in a process. It will help new employees to quickly understand the whole process and exactly how their role fits into the overall process. The excellence ambassadors may recall that one of Deming's 14 principles was "Next Process is Your Customer". The SIPOC helps one understand who their immediate and subsequent customers are, and what is expected by them. COPIS COPIS (Customer, Output, Process, Input, Supplier) is the reverse of SIPOC and has been introduced with a customer centric mindset. Some consider SIPOC and COPIS as same. However, as explained earlier, when we have a known process, it is easier to develop a SIPOC, since we will start by outlining the process steps. When we have a situation where the process is not known, e may adopt COPIS.. here we start with the customer, understand the customer's output and then decide which process (process steps) will deliver them.... and then move on to the inputs and suppliers. Once developed, be it SIPOC and COPIS, all the benefits as explained above will apply.

-
Autonomation (or Jidoka) Autonomation (or Jidoka) is referred to as “Automation with a human touch”. Autonomation refers to automation of those tasks that are mundane or important from safety or Quality point of view, but still requires human attention. The idea is to minimize the operator intervention. A problem gets automatically detected, stops the machine (or process) and alerts the operator to take action. The expectation is that the action will involve not just restoring the process, but to also perform the root cause analysis. This helps to prevent a Quality or Safety problem, at the same time improve productivity with less human employment. Autonomation vs Automation Shigeo Shingo says there are 23 stages between fully manual process and full automated process. A fully automated machine must be able to detect and correct their own operating problems which may always not be cost effective. However, a good amount of the automation benefits can be availed by autonomation at a much lower cost. Autonomation in modern day context Apart from the production floor, Jikoda principle is being used on many applications in the modern day context. A few day-to-day examples are as below: When you log in to a bank account, if you repeatedly enter the login details wrongly, it will get locked. The electrical safe trip used in our homes trip, if they sense excess flow of current, thus providing safety and protection of equipment. An elevator will not move if the load exceeds the limit; it will also give a warning beep. In the piped domestic gas supply systems, in case of leaks, excess flow is sensed and the valve will close supply to the suspected line. In the event of drop in cabin pressure in the airplane, the oxygen masks will automatically drop down for the passenger’s use. In all the above examples, even though an automatic sensing and protective action happens, it has to be attended by a human and also take up necessary corrective action as applicable.
