Venugopal R
Members
-
Joined
-
Last visited
Everything posted by Venugopal R
-
Benchmark Six Sigma Expert View by Venugopal R Benchmark Six Sigma Expert View by Venugopal RAlthough the term “Reporting Bias” and its categorization is popularly related to Epidemiology, some of them would be relevant for other businesses as well. Reporting bias is also referred to as ‘selective reporting’, where certain information tend to get reported dominantly, advertently or inadvertently. Such bias is common, especially in reporting of scientific matter and clinical trials. Below are various types of ‘reporting biases’, their definitions and some general thoughts on how an organization can safeguard against such biases. 1. Citation bias Basing the report from other articles and reports, has the risk of providing only ‘one side of the story’. There could also be a tendency to report the ‘positive outcomes’ for a study and not focusing on ‘negative’ aspects. Tips to safeguard: Ensure the practice of quoting the sources of references for citations. Corroboration by multiple references should be insisted to obtain realistic picture of the findings being reported. 2. Language bias This is a possibility when reporting needs to be done in multiple languages. In an organization context, while a corporate report would be released in English, there would be need to translate into regional languages for the benefit of all levels of employees. Or the need could be due to the presence of the organization present in multiple geographies. A bias in such situation could be intentional or unintentional. Tips to safeguard: Translations may be subjected to review using unbiased translators along with a SME to ensure that the message does not get biased intentionally or other wise. 3. Duplicate reporting bias Duplicate reporting could happen when the same topic is reported multiple times by same source or different sources. This can result in incorrect exaggeration of certain results or duplicate accounting of certain benefits. Tips to safeguard: Have defined authorities for reporting of specified topics. If any one else has inputs on the same topic, they need to forward to the designated authority to ensure that the chances of duplication are avoided. 4. Selective Reporting bias This is a very common type of bias, where some outcomes are reported and some are omitted, depending upon the nature of the results. Such bias could be introduced with vested motives to skew the interpretation in favor of the expectation of the author. Tips to safeguard: Provide equal opportunity of representation by all stakeholders for the given report. Any interpretation and related actions need to be taken up only after verifying that the facts are represented in full. Involvement of key stakeholders before final interpretation is important. 5. Time-lag bias This bias could be related to some of the earlier discussed bias, for instance, the selective reporting bias. A positive outcome may get reported faster and negative outcome may get reported after a significant time gap. This could result in incorrect actions being taken based on partial interpretation of the situation. For example, a product launch based only on the success outcomes of a new product trial reported without timely mention of certain potential risks, could result in serious reputation damages. Tips to safeguard: Follow a balanced set of business reporting parameters as far as possible and we need to know whether observations on all parameters have been considered with equal attention and reported on time, before taking major decisions For any organization, reporting methodologies for various business activities need to be pre-planned and reporting standards established, taking into account the potential reporting biases. To the extent possible, build-in logical validations that could throw up suspected biases, and for the rest, the organisational discipline needs to be set in place to minimize errors due to reporting biases.
-
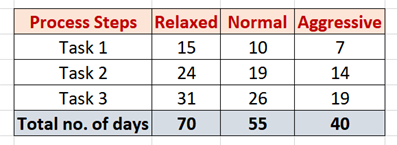
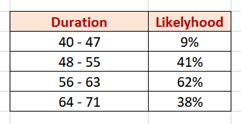
Benchmark Six Sigma Expert View by Venugopal R Monte Carlo Simulation is a statistical method, using computers for quantitative risk analysis. In this method, random sample data can be generated based on known distributions, instead of carrying out actual experiments, which could be impractical for many situations. Monte Carlo simulation methods are used in the field of Finance, Manufacturing, Engineering, Project Management, Medical and many other areas. Interestingly this method evolved based on a study on the outcomes for a gambling game, but the method was applied for studying neutron diffusion! Monte Carlo simulation methods are not required if we have a deterministic solution based on analytical relationship between two variables. This method is required where there is influence and interaction by complex set of variables. For instance, if we need to evaluate the health risks to children due to the vehicular pollution of cities, multiple factors and conditions would impact the outcome such that, no two iterations of simulation would give exactly same outcomes. Based on large number of trials a collective picture of the outcome is possible. To explain in simple terms, when a process takes multiple inputs to provide a combined outcome, the outcome will be reasonably predictable if each of the inputs are stable. However, if there is a variation for each of the inputs, it becomes quite complex to predict the outcome. Monte Carlo simulation becomes a useful method for such situations. The method uses computational algorithms to simulate the process for a very large number of times encompassing the entire variability span for each of the inputs. The output is based on a probability distribution, that depicts all outcomes along with the likelihood of occurrence for each outcome. Monte Carlo simulations are considered as remarkably accurate models provided there is good accuracy and randomization in the input data. The steps involved in a simulation process will include: Defining the problem Collect real system data Formulate and develop a model Validate the model & document Design the simulation exercise Perform simulation runs Interpret the results Recommendations based on the results The simulation outcomes are presented as 'expected ranges' with a confidence level associated with each range. As the number of trials increases, the range of the outcome will reduce. Consider an example below, where the Project Leader comes up with estimated delivery times for a project with 3 options viz. Relaxed, Normal and Aggressive. Considering the fact that the tasks for the project depend upon several factors with varying extent of control by the team, the above data is unable to provide the likelihood of each option. Applying Monte Carlo simulation and running a large number of simulation trials, the range of the each of the tasks will be taken into consideration as random values, and the percentage likely hood for each option is obtained. It may look like the below table. The above example hopefully gives a broad understanding of how the Monte Carlo simulation tool would help to take decisions for a business situation. The methodology can be used for diverse applications. It is very important to ensure that the inputs provided are realistic and randomization of data to obtain a reliable output.
-
Benchmark Six Sigma Expert View by Venugopal R Any organization that looks for business growth can look at different strategies, viz. 1. Continue with existing products in the existing markets, but try to sell more (Market Penetration) 2. Continue with existing products, but try to capture new markets (Market expansion) 3. Introduce new products and continue with existing markets (Product development) 4. Develop new products that are meant for new markets (Diversification) Igor Ansof, a Russian American Business Manager introduced this concept for organizations to develop their Marketing strategy, in the form of a four-quadrant grid, which is known as the ‘Ansof Matrix’. As seen from the Ansof matrix, in quadrant 1, Penetration is considered the least risky, whereas the quadrant 4, Diversification is considered as 'high risk'. The other two options, Market development and Product development are considered as 'medium risk'. Let’s briefly look at each of the strategy options: 1. Penetration This is a low risk strategy and the company tries to grow its presence of its existing products in the existing market. It would involve promotion and advertisement programs to sustain and improve the product sales within the segments and geographies that they already operate. This can happen by increasing the market presence as well as increasing the market share. For instance, a company engaged in selling washing machines may try to grab some of its competitor’s market share, as well as try to convert more customers who never owned a washing machine earlier. Though the risk is low in the penetration strategy, the returns too may not be very high. However, it is very important to keep the pace on, in whatever the company is already into. 2. Market Development This strategy is needed to expand the market for existing products. The expansion could be by new geographies or by new segments. For instance a company would expand its market by deciding to export its existing products. A company who has been focusing on selling air conditioners for commercial customers targeting to sell them for household use, is an example of expanding the market segment. The market development strategy poses medium risk, since the company is treading upon a new market and it requires research and might have to counter unforeseen factors pertaining to the new market. Once successful in expanding the market, the company will benefit from higher revenues. 3. Product Development In this strategy, the company continues to deal with the already familiar market, but with new products that could be variants or upgraded versions of the existing ones. Since the company is dealing with familiar market, the risk is medium and is based to any uncertainties on the new product. Manufacturers of Automobiles, cell phones and consumer durables bringing out new, upgraded or variant versions of products, or even new products that attract existing customers are examples of such strategy. This strategy provides room for innovative offerings that can make the company competitive for a period of time, of course with the risk element. Sometimes, it is important that all companies selling such products quickly upgrade to certain new products… for instance when LCD TVs came to market, all TV manufacturers had to necessarily come up with new products in line with the updated technology to keep them afloat in the market. 4. Diversification This is the most advanced strategy, where in a company decides to explore not only a new product, but also a new market altogether. We have seen companies that were predominantly in steel blanking business becoming major manufacturers of consumer durable goods. We have brands that were famous in automobile field becoming major producers of electrical goods. We have companies whose brand used to be associated with cigarettes becoming major FMCG player. Diversification is a breakthrough strategy that has to be seen for long term pay off. Since this strategy is considered as the highest risk, very detailed planning, foresight, research, learning and unlearning, investments, reviews, experimentation, trials, concerted and patient efforts are required for succeeding. Having gone through the elements of the Ansof matrix, it may be observed that many companies adopt all of these strategies concurrently. Each element has its significance and a balanced approach needs to be adopted, depending upon the capabilities and management vision of the organization.

-
Benchmark Six Sigma Expert View by Venugopal R Many methods are used for prioritizing project ideas as well as for prioritizing solutions during the ‘Define’ and ‘Improve’ phases. An organization always has limited resources but has to handle multiple tasks. For any on-going business, there is bound to be a flood of day-to-day tasks and there would also be some that keep cropping up suddenly. It could be chasing a new business opportunity, addressing a major customer issue, production issues related to material, resources or equipment... and so on. Despite the best attention and support provided by the executive leadership, it will usually be a challenge to mobilize a set of improvement ideas, get the teams involved, convert them to projects and get a continuous improvement program going. Hence it is important to involve the teams from the beginning and use a relatively objective approach to collectively decide where the priority of focus needs to be. Effort vs Pay-Off Chart GE came up with Effort vs Pay-Off Chart to classify and prioritize a list of solutions during the ‘Improve’ phase. The chart can certainly be made use of in the ‘Define’ phase as well to prioritize project ideas. The classification for each quadrant of this chart is as below, which is self explanatory. Low Effort, Low Pay Off (Low Hanging Fruits) Low Effort, High Pay Off (Jewels) High Effort, High Pay Off (High Hard) High Effort, Low Pay Off (Drop) PICK chart Similar to the E vs PO chart, the ‘PICK’ chart was developed by Lockheed Martin to classify a list of generated project ideas into 4 categories viz. Possible (Easy to do, Low Pay off) Implement (Easy to do, High Pay off) Challenge (Difficult to do, High Pay off) Kill (Difficult to do, Low Pay off) They are represented using a four-quadrant window as below: PICK chart along with PPI It is recommended that the use of PICK chart may be further enhanced by combining along with the Pareto Priority Index (PPI). The PPI method provides a numerical value for each selected project as per the below formula: PPI = (Savings x Prob. Of success) / (cost x time of completion) The numerator of the PPI formula provides a quantification in terms of the Pay-Off along with its probability of success. It not only considers the savings, but also the probability of success, which is certainly dependent on the level of difficulty to implement. This helps to represent the X axis of the PICK chart. Higher ‘Effort’ could require higher work hours and higher cost. Hence the denominator would represent the Y-axis of the PICK chart. On the PICK chart we have 10 project ideas plotted, spread across the four quadrants, depending upon their X and Y co-ordinates. A more detailed discussion about the PPI chart could be a separate topic of discussion.


-
Benchmark Six Sigma Expert View by Venugopal R Ben Franklin effect may sound paradoxical. As quoted in his auto biography, his statement, in simpler terms, implies that one who has already done you a favor will be highly likely to do another one. He had also written that in his personal experience, it was one of his adversaries whom he approached for a favor and later they ended up becoming lifelong friends. Based on my own personal experiences, both in career and day-to-day life, there have been many instances, where we can relate the Ben Franklin effect positively, and at the same time, there have been negative incidents as well. However, since there is more to gain than lose by trying and adopting the approach, it is worthwhile discussing and exploring this topic. As per general human psychology, most people hesitate to approach someone for a favor for various reasons; more so, if it happens to be one with not-so-good relationship. Let us consider two different situations: For many instances, there may not be anything wrong in asking for help when one needs it from someone who is in a better position to provide that help. What might come in the way could possibly be a psychological barrier. Second case is when the person happens to be one with a strained relationship due to some past incident. While we could have examples for the above situations both in business and personal lives, we will discuss a few business scenarios. Customer Supplier relationship When we find it difficult to deliver products / services on time or right quality, we may request our customer for help. It could be clarifications on specifications, provide training on a process, help us with some checks at their end and provide feedback or discuss on an alternate approach and so on. Many times, reaching out to customer for such assistance is hesitated or postponed, with a notion that we might project a negative impression by asking for help – however, we would have noticed that more often than not, the customer would have been eager to help us out. Upon thanking the customer for their help, we can expect that this would encourage them to enhance the collaboration and support us during genuine situations in the future as well. Similarly, during certain occasions customer may reach out to their suppliers or service providers for helping them out with an exigent situation, which may be beyond the contract boundaries. This could encourage the supplier with a feeling of importance and result in offering such help in the future. However, it is important that this does not evolve as an unchecked ‘scope creep’ and impair a healthy business relationship. Leader Subordinate relationship The leader may ask for a help from subordinate without reservations, maybe to explain some subject which he / she may be good at or it could be taking his / her view before making a personal purchase, on a product for which he / she has good familiarity. This could highly motivate the employee who would look forward to similar opportunities in future. This could happen the other way as well, when an employee approaches his leader for help with some topic, or to obtain some attestation for a personal requirement, or some personal guidance on career. Such mutual help when requested from either side, so long as it does not amount to exploitation of authority or freedom, would foster healthier relationships and result in better performance as a team. Inter functional relationship Co-operation between different functions in an organization is very important for the success of a ‘process oriented’ company. Seeking ideas, involving other stakeholders to provide their viewpoints and support by providing them a larger organizational picture are essential principles for driving organizational excellence. It is akin to the prime minister of a country seeking ideas and support from all parties, including opposition parties to jointly address a national emergency. Key points to bear in mind We can certainly identify many more examples related to business and day-to-day lives. However, we may not see ‘Ben Franklin effect’ work in all situations. The underlying principle behind the Ben Franklin effect is that the requested favor should be such that it evokes a feeling of pride and importance on the other individual. Hence, it matters, who needs to be approached for what type of help. Ensure that you do not put someone in an embarrassing situation by asking that favor. It is also important how, or the manner in which such a request is put forth. It should neither be commanding nor pleading. You should also ensure that a genuine appreciation and compliment is given in return to the help provided.
-
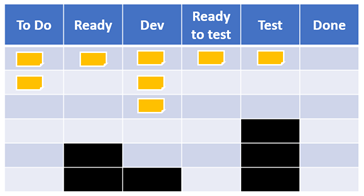
Benchmark Six Sigma Expert View by Venugopal R Both Srum and Kanban are agile methodologies, popularly used for Project Management. Although their context is often referred with respect to Software development, the methods are applicable for any type of project management. Scrum originated in the software world, whereas Kanban originated long ago as part of the Toyota Production System. While these two methods exhibit similarities, there are differences in the way they are organized and administered. “Scrumban” is a hybrid structure evolved by Corey Ladas that leverages the best of both methodologies. To understand Scrumban, we will first have a quick look at Scrum and Kanban methods independently and their differences. The Scrum method works with a well defined organization structure. It has a Product Owner, Scrum Master, Developers and Testers. The Product Owner represents the customer and will decide the priorities for the items, also known as ‘user stories’ to be worked upon. Product Owner mentors the team with respect to the Product requirements. The Product owner liaisons between the customer and the development team. The Scrum Master is an experienced facilitator who organizes the meetings and helps team to overcome hurdles. The Developers develop the codes and Testers test the functionality in the required environments. The entire team is self organized and they work on the stories listed under the ‘Product Backlog’. The ‘user stories’ are moved from the Backlog list and they get into the stages within the Development phase, viz. 'To do', 'Doing' and 'Done'. Afterwards, the ‘user stories’ will move to the similar 3 stages within the Testing phase. The entire cycle of this activity for a user story is known as a ‘Sprint’ and usually set for a time frame of 2-3 weeks. There are certain meetings that are conducted as part of the Sprint cycle viz. Sprint Planning, Daily Stand-up, Sprint Review and Retrospective meetings. In case any change requirement comes up during the Sprint, it will be accommodated only after the Sprint cycle is completed. Kanban focuses on continuous delivery, with a demand based supply. The team comprises of developers and testers with an Agile coach. The Kanban board also contains the Backlogs, user stories, the 3 stages during development and testing; quite similar to the Scrum method. While the Scrum employs a ‘time-box’ method based on Sprint cycles, Kanban works with continous flow, keeping minimum work-in-progress depending on the team’s capacity. If there is an accumulation of work in any of the stages up to the permitted capacity, other team members can pitch-in and clear the bottle neck. Kanban model is flexible to accommodate any change during the development stages. The delivery performance is measured as the lead time taken from the time the request is placed until go-live. Few evident benefits of Kanban over Scrum are greater flexibility and continuous flow. Now let us look at ‘Scrumban’ which is actually an enhancement of Scrum towards Kanban methodology. Some of the key features of Scrumban are: It incorporates the visual workflow based on Kanban Uses daily Scrum – Project team meets in front of Kanban board and discusses jobs done yesterday, to be done today and any obstacles to be addressed The job is pulled, as in Kanban and not assigned as in Scrum Sprints. The work is pulled by the member, and it gives higher ownership for the pulled task. For this purpose, additional columns are created on the Kanban board and limits are set for certain stages. Clear WIP (Work In Progress) limits are applied as in Kanban to prevent excessive accumulation of work at any stage. This will necessitate a “Pull” approach and prevent stagnation of work at a stage. Specific roles, by way of structured team as in scrum are not defined. More collaborative working is encouraged. Use of specialized team members – depending on the the requirements of the tasks, the required subject matter experts are pulled into the team Due to the ‘Pull’ approach, the Sprint Planning meeting will be based on trigger, rather than ‘once a fortnight’ as per traditional Scrum approach. The below table gives a typical Srumban visual workflow display. It may be noticed that the dark blocks indicate the limitations set for the stages represented by those columns. The flexibility and pull features of Srumban makes it a better structure to be adopted when the development and testing teams have dual responsibilities of handling new developments as well as ongoing requests.
-
Benchmark Six Sigma Expert View by Venugopal R First and foremost priority of any business owner/leader will be to ensure the health and safety of their employees and their families. Almost every organization will have Emergency handling procedures, Business Continuity Plans and Disaster Recovery policies. Emergencies do erupt as may types, viz. Limited to the organization, one or more sites (eg. a Server issue or major failure of certain equipment) Problem that has affected the region (Eg. Flood or other natural calamity, political issues, epidemic) Situation that has impacted the entire nation (Eg. Political issues) Situation that impacts movement / logistics, but not health or safety of employees (Transportation breakdown, connectivity issues) Today, we have a situation that is beyond the limits of those listed above. We have a crisis that is not restricted to geographies but threatens to cripple the entire world. It impacts not only an organization, but its customers and service providers as well. It concerns individual safety and at the same time people are bound by various restrictions imposed mainly in the interest of society at large. Many of the measures undertaken by organization during their past experiences would apply, but current situation probably demands much more, and unlikely to have a comparable past experience. Some of the measures that could be taken and are being exercised by many organizations include: Streamlining and channelizing communications regarding the current situation. Most reliable information updates are required both by the decision makers and for the overall employees. Make sure every one tunes into a common source of information to avoid unwieldy spread of rumors and confusion. Identify a emergency handling team who will represent the entire organization for taking key decisions, communicating and leading selected sections during the crisis period. Ensure that this team is introduced to all employees. While employees may be given the freedom of providing inputs / communications relating to the crisis, ensure that such communications are streamlined through the emergency handling team. Draft communication to customers and other stakeholders on the company’s strategy to maintain their deliveries and let them know how they would be kept informed about periodic updates. In the event of limitations on capacities, discuss with clients to understand their priorities, so that the limited capacities can focus on the highest priorities. Ensure that the organization is well informed and complies with any regulatory requirements by law at any point of time. Specific to current pandemic, ensure that aggressive measures are taken for ensuring necessary hygiene – viz. Hand sanitizing while entering the work place, frequent wiping of door handles, elevators, staircase railings, conference room furniture, pens, projector remotes, key boards, mouse, restroom faucets and all other points of human contact. Ensure adequate communication to all employees and visitors about the hygiene practices and provide sufficient visual displays, audio visuals and any other effective means. Considering that the current pandemic has affected worldwide, one of the common business continuity strategy of providing alternate processing at different geographies may not be effective. “Work from Home” is a very popular means adopted by companies where possible depending on the nature of work. This would be possible mostly for certain types of IT companies but would not apply for operations for manufacturing sector. Even if the company is able to permit limited employees to work in the offices / factories in compliance the regulations, the company has a grave responsibility to protect not only their employees but also any impact to society as well. Adequate check points and action plans need to be evolved to ensure the same. Necessary notification to the concerned regulatory authorities needs to be provided as required to ensure that the company does not violate any legal requirement. The emergency team (or core team) has to be in constant touch and should meet through video conferencing or other means everyday or even multiple times during a day to keep updating and reviewing their plans and actions continually Once the emergency situation eases, the leadership team will have to revisit their annual budgets and review the decisions on capital, new hire and other spend. Revision of strategies regarding product mix, launching of new products etc. will have to be reviewed in view of making up for the lost hours and profits. It is quite possible that the customers too would have rapid revision of their plans and requirements during the crisis period; it is important for the customer relations personnel to be in touch with them for constant update of their requirements, which need to be linked to the company’s plans and to the available capacities. There has to be real time dashboard which is likely to change dynamically. Some companies have a practice of collecting a very small amount from every employee and they build a corpus for supporting any employee(s), in the event of getting personally impacted. Such practices may be considered in long run.
-
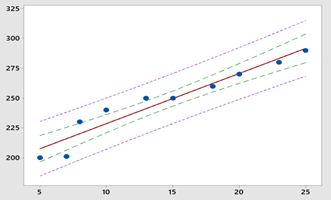
Benchmark Six Sigma Expert View by Venugopal R Confidence interval is an estimated interval calculated from a set of observed data within which the a population parameter (e.g. Mean) is expected to fall with a given confidence level (e.g. 95%). It is to be remembered that the confidence interval is used for estimating the position of the population mean and not an individual value from the population. Predictive interval is an estimated interval within which an individual future value from a population is ‘predicted’ to fall with a certain probability. Confidence intervals give rise to a degree of certainty / uncertainty with respect to a sampling method. It provides the limits within which a population parameter will be contained. The mean value of a sample taken from a population provides a ‘point’ estimate. Imagine a large lot of apples and we need to estimate the mean weight of the apples in the population. If we take a random sample from the population and measure the mean value as 300 grams, this value is a point estimate of the population and will be subjected to uncertainties. While we may not be able to obtain the real value of the population mean unless we weigh all the apples, we can make the point estimate practically more useful by providing confidence intervals around it within which the mean population is expected to fall with a specified confidence level. This is possible by using the sample mean, sample standard deviation and assuming normal distribution. One of the common applications of confidence intervals is during the tests for significance for means. A common misconception about the Confidence Interval is that it is sometimes wrongly interpreted that they represent the percentage of individual values that fall within them 95% of the time (if the confidence level is at 95%). Coming to Prediction intervals, as defined earlier, they represent the intervals for individual future value from the population. Since the variation of the individual values will be much larger than the mean values, the Prediction Intervals will be wider than the confidence intervals. Prediction intervals are usually used during regression analysis. Prediction intervals are preferred for many situations than the confidence intervals, since they provide the estimates for an individual observation rather than unobservable population parameter. The below graph shows a fitted regression plot depicting the Confidence Intervals (green inner dotted lines) and the Prediction Intervals (violet outer dotted lines)
-
Benchmark Six Sigma Expert View by Venugopal R Most of us are aware that GE has played a major role in popularizing Six Sigma practices and is well known for obtaining huge benefits. Having undergone my early training on Black Belt through IGE, one of the mandatory modules for the leadership team was Change Acceleration Process (CAP), which was imparted to all champions and executive leaders. The CAP broadly looks at Change as changing from ‘Current state’ to ‘Improved State’. It involves leading the change and also changing of associated systems and structures. One of the major challenges for an organization during a change is to overcome the ‘Resistance to change’. ‘Leading change’ focuses on Creating a shared need, Shaping a Vision and Mobilizing commitment. The Systems & Structures would ensure Monitoring the change, Finishing the job and Anchoring the change. The ‘Work-Out’ session is an approach taken up to accelerate the whole cycle of change management. Now, if we look at a Six Sigma project, we are trying to bring about a change, mostly on a process, which is expected to provide a sustained benefit on the efficiency, effectiveness, or both. Some of the main problems that we face in running Six Sigma projects are: Inability to provide continued attention Hindrance due to Overlapping priorities of day-to-day work Non availability of key resources at a time, to take decisions on the project Delays in obtaining approvals The ‘Workouts' are highly focused, planned and dedicated sessions. The Workout consultant works closely with the Champion and the Sponsor for initial decisions about the project, designs the sessions and associated logistics. Typically the work-out process will have a Design phase, Conduct phase and Implement phase Design phase: Obtain Executive sponsorship Define the critical business issues and desired outcomes Clarify Boundary conditions as applicable Select Experts across functions Define, Gather data Design work out session agenda Conduct: (usually 1 to 4 days session) A neutral third party facilitation is done for Team chartering and launch Process Analysis and Problem Solving Application of Analysis tools Decision maker’s briefing Team report-out and On-the-spot decisions Team implementation and communication plan Implement: Ongoing team implementation of approved recommendations Consulting liaison between team and decision makers 30, 60 and 90 day check points with decision makers Celebration of success, capturing learning Build internal change management capability As seen above most of the activities are covered during the phases of Six Sigma DMAIC or DMADV and appropriate tools are available. Effective Workouts help in accelerating the Six Sigma project cycle
-
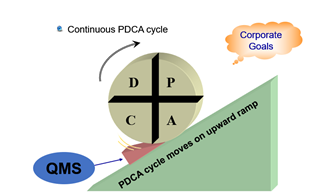
Benchmark Six Sigma Expert View by Venugopal R A few thoughts on addressing the Sisyphus effect… PDCA wheel analogy By looking at the story of Sisyphus, trying to roll up the rock up the hill, I can’t help relating it to the PDCA wheel which has to be rolled continuously for improvements. And that too… the PDCA wheel has to be imagined to be rolled upwards on an inclined plane. The problem that most of us would have experienced, and possibly continuing to experience is that the PDCA wheel will tend to roll backwards. We would experience it in the form of repeating the same ‘Continuous Improvement Projects’ repeatedly. The lack of adequate control systems, mistake proofing and SOPs are some of the major reasons that result in rolling back of improvements. That’s why you see that a ‘wedge’ is placed under the PDCA wheel to prevent its roll back, and this wedge is the QMS (Quality Management Systems). A good QMS is a pre-requisite to ‘Continuous Improvement Programs’, the absence of which puts us at risk of losing the gains. Separating resource allocation for Continuous Improvement: Very often we see the same set of resources being given the responsibility for handling the ‘day-to-day’ roles as well as ‘strategic roles’. With this, you will see that most of the ‘Improvement related actions’ get postponed due to 'pre-occupation' on the day-to-day activities. In order to obtain specific focus on strategic improvements and innovative thinking, specific time and resource have to be budgeted and complied with leadership focus. Comfort zone syndrome If one is used to a set pattern of activities for a long period, then they tend to develop a ‘comfort zone’ around this routine, despite it not being the most efficient method possible. There would be a resistance to come out of this routine, and to take up a creative thinking. It helps to have periodic job rotations to break the formation of such comfort zones. Continual application of Lean Develop process maps for all processes, including administrative processes and periodically perform a VA / NVA analysis. It is quite possible that you would come across few steps that could simplified, eliminated or clubbed with some other step to reduce the effort and time. With the ongoing improvements in information technology, it is important to keep identifying ways of digitizing and automating tasks that would relieve repetitive efforts by humans, and thus release their time for more creative thinking and developments. Balanced work allocation It is not uncommon to find few individuals who appear to be extremely busy and over-occupied with routine work, whereas there would be others who appear relatively less occupied. The reason could either be an imbalance in the work allocation or due to the difference in method or behavioral traits of the individuals. Apart from balancing the workload, it may be worthwhile to capture and share the best practices for performing a similar job more efficiently.
-
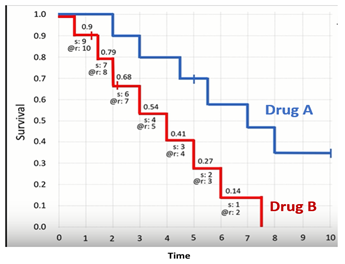
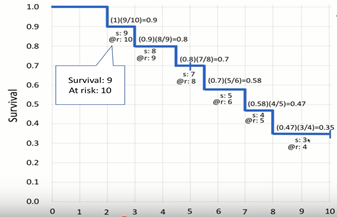
Benchmark Six Sigma Expert View by Venugopal R The Kaplan Meier chart is used to estimate the probability of survival during a medical research. For instance, let us consider that we are interested to study the effect of a particular drug for treatment of a life-threatening disease. The study based on 10 patients who were subjected to this treatment is plotted as below, which is knows as Kaplan Meier chart. The Y axis represents the probability of survival and the X axis represents time (say no. of years). As seen, at the start the probability of survival is taken as 1 (or 100%). After two years a patient dies, then the probability of survival drops to 0.9 (90 %). At the end of 3 years we have one more mortality, then we calculate the survival rate as the conditional probability of survival at the end of 3 years for patents who survived the first lap i.e. 0.9 * (8 / 9) = 0.8 (or 80%). The calculation for each step of this chart is continued. However, it may sometimes so happen that we might lose track of a patient. They are no longer available for the study and are categorized as ‘censored’ patients. It is represented by a vertical cross line; as seen during the 5th year. The censored patients are removed from the denominator while calculating the survival probability for that year and for subsequent years. In the above figure, the red graph represents the Kaplan Meier chart for another drug B for a similar exercise. If we look the median survival for both the groups, it will be: Median survival for Drug A = 7 years Median survival for Drug B = 4 years One can also compare the estimates of the survival probabilities for a give period. For instance: 3-year survival probability for Drug A = 0.80 3-year survival probability for Drug B = 0.54 In general, a steeper curve represents a worse situation. Though not discussed in detail here, it is also to be noted that there is also a confidence interval associated with each estimate, and the width of the confidence interval depends on the number of samples being studied. I hope that this brief discussion about Kaplan Meier charts provides a broad idea as to how Medical Researches would use this tool for estimating and comparing the effectiveness of treatments.
-
Benchmark Six Sigma Expert View by Venugopal R We normally take a sample from a large population to estimate the parameters of the population. For instance, if we are interested to estimate the average height of male population in a country, we have to rely on the findings based on a random sample. However, we also know that the finding based on one sample would not be an accurate estimate, since the average that we obtain from another sample is bound to be different. This necessitates pulling multiple samples from the large population, so that we obtain a sampling distribution from which the population parameters could be derived easily and more accurately. The task of pulling multiple samples and conducting the measurement could prove cumbersome in certain cases. Bradley Efron, an American statistician came up with a method in 1979, by which instead of taking different multiple samples, one large sample subjected to re-sampling with replacement could provide us with results that would be almost the same as we would have obtained by using multiple samples. He coined this method as “Bootstrap re-sampling”. I will try to provide a brief explanation of this method as below: One large random and representative sample set, say sample size ‘N’, has to be picked up from the population being studied. Measure each unit in the sample-set and replace them back into the sample-set Pick one unit from the sample-set, measure it for the characteristics of interest and replace it into the sample-set. Pick another unit, measure it and replace it. When you repeat this procedure N times, you would have completed one “Bootstrap sample-set”. Keep repeating point no.3 ‘K’ times to obtain data from ‘K’ Bootstrap sample-sets, each containing ‘N’ samples It may be noted that since each unit is replaced before picking the next unit, there is a possibility of the same unit getting repeated within a Bootstrap sample-set Thus, it is very likely that the composition of each of the K Bootstrap sample-sets would be different and hence the sample means and variances would also be different, mimicking the kind of variation that would have occurred had multiple samples been picked from the population. Advantages of using Bootstrap re-sampling: The need for collecting multiple samples and the associated measurement efforts are eliminated. Steps outlined above for the Bootstrap re-sampling method with random picking of units are best performed using computers. With Bootstrap re-sampling, the estimate of variance will be less biased than obtained using small samples, and thus more representative of the population. The applicability of the Central Limit Theorem, (by which the distribution of sample averages exhibit better normality properties, larger the sample size), increases with Bootstrap re-sampling. Some limitations of the Bootstrap re-sampling method: Bootstrap re-sampling work best with large sample sizes and the sample has to be very representative of the population. This method may not be practical in the absence of computing facilities. The practice of sample replacement would not be possible when the measurement of characteristic involves destructive methods.
-
Benchmark Six Sigma Expert View by Venugopal R When there is reason to believe that a population has heterogeneity based on certain characteristics, a ‘stratified sampling’ method may be adopted rather than going for a simple random sampling. Such sub-grouping of the population is based on defined characteristics and the groups are referred to as ‘strata’. Below are a few assorted situations where the stratified sampling would be useful: An opinion poll for a government decision on a population where the strata could be done based on gender, age group and location. Quality characteristic evaluation of a chemical in powder form, where the stratification may be done based on the location of the powder in the container – eg. top right, top left, bottom right, middle left and so on.. To study the productivity levels of processing of invoice data, the sampling strata could be based on grouping types of invoices – say, from different industry domains like Retail, Pharmacy, Manufacturing, Restaurant etc. For measuring the diameter of holes on a component, using multiple drilling bits, holes created by each drill bit may be taken as separate strata. For studying transit related damages for a consumer durable, the products may be stratified based on their location on the truck during transportation. While assessing the air quality in a city, it makes sense to identify different locations based on factors such as intensity of traffic and draw samples from each location. Assessing quality of a product by stratifying based on – starting of shift, middle of shift and end of shift. For analyzing reasons for overdue on Loan repayment, samples of defaulters may be taken by stratifying them based on Age, Income, type of employment, Gender, Location, Loan amount etc. The variation within each strata is expected to be smaller compared to the variation across strata. By adopting the method of stratified sampling, the overall sample size will reduce as well as more accurate conclusions can be obtained. The interpretation from the sampling results may also be used to identify whether the interested outcome has dependency on any of the strata characteristics.
-
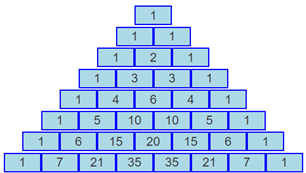
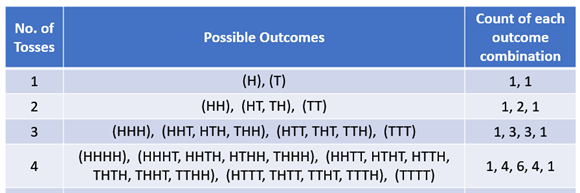
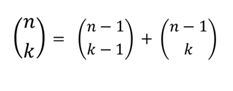
Benchmark Six Sigma Expert View by Venugopal R Pascal's Triangle is named after the French Mathematician Blaise Pascal. It will look as depicted below: A quick examination about the Pascal’s triangle reveals the following: The top most row (referred to as 0th row) has one number, which is 1. The next row (first row) has two numbers (or two columns) and each number is the sum of the numbers of the boxes above from the previous row. The same practice continues, and we get the Pascal’s triangle. Thus if number on the nth row and kth column is represented as then: Let us look at an example of a simple binomial probability – the outcome of tossing a coin. The following table gives the number of tosses, the outcome and the numerical representation of each outcome combination The last column of the above table is emerging as the Pascal’s triangle. It may also be seen that the binomial probabilities for a particular outcome can be worked out. For example, let’s see the probability of obtaining exactly two heads, when the coin is tossed 4 times. The total number of possible outcomes is 1+4+6+4+1 = 16. The number of combinations that gave exactly two heads is 6. Hence the probability of obtaining exactly two heads is 6 /16 = 0.375 or 37.5%

-
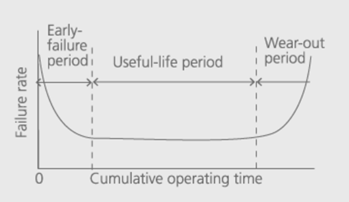
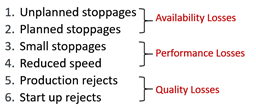
Benchmark Six Sigma Expert View by Venugopal R Total Productive Maintenance (TPM) is a terminology introduced by Seiichi Nakajimma. As part of improving the Overall Equipment Effectiveness (OEE), the six big losses have been defined, by which it becomes easier to identify the inefficiencies. The Six Big Losses that aim to improve the OEE are: 1. Unplanned stoppages: Unanticipated stoppages of equipment for a long time. The causes for such unplanned stoppages could be Equipment breakdowns, Tool failures, unscheduled maintenance, Lack of power, Lack of raw materials or other required consumables. Since these are unexpected stoppages, we need to learn lessons from these incidents, by doing a root cause analysis and identify pro-active measures to prevent recurrences or similar occurrences. A structured FMEA exercise will help identify potential causes and the associated Risk Priority Numbers. 2. Planned stoppages: Planned stoppages may happen for scheduled maintenance, Quality checks, Tool Adjustments, planned breaks, change of input materials. Since there could be multiple reasons for planned stoppage, it would be economical to sync up these activities to happen in parallel, apart from the efforts to decrease the time for the activities that consume larger duration. SMED (Single Minute Exchange of Dies) is one of the well known methods to keep the planned stoppage time low. Predictive maintenance approach is recommended. 3. Small Stoppages: Small stoppages usually happen for problems that are attended by the operator himself / herself. It could be minor cleaning of sensors, correcting minor misalignment, blockages, wrong feeding of raw material etc. Since these are mostly dealt by the operators, it is best to involve them on a Small Group Improvement program such as QC circles, to continuously and systematically identify various causes and work on solutions for each of them through employee involvement and incentive programs. A good 5S program would help to keep the work place organized. 4. Reduced speed: ‘Reduced speed’ means that the equipment is taking longer time to produce an item. Possible reasons could be wear & tear of the equipment, lubrication issues, operator skill to handle the equipment, influence by raw material or operating conditions Root cause analysis needs to be done to identify and stratify the causes. Some of the causes could point improvement in the effectiveness of the preventive maintenance schedules, that could have led to the deterioration of performance of the equipment. Issues related to Operator skills will have to be addressed by training. Enhance raw material control for associated causes. 5. Production defects: These are defective products that come out during normal production. Any output that is not ‘First-time right’ is considered as defective. The reasons could be due to inadequate process capability, improper setting of the machine, improper handling or defective raw materials. Incorporating strong methods for detection, control and prevention would help improve the First Pass Yield (FPY). SPC and Process Control Plans will improve control at upstream stages to prevent defective from flowing down the process. 6. Start-up defects: These are defects that occur during the start of a setting. Could be due to warm up cycles, improper settings, change over process. Training using very clear standard operating procedures with validated check points, based on the historical learning would minimize the start up defects. Introducing automated methods where possible, will further reduce variation and uncertainty.
-
Benchmark Six Sigma Expert View by Venugopal R Linear regression fits a relationship model between the response variable and predictor variable(s) using the method of least sum of squares. The linear regression model will provide a good estimate with the assumption that the variation of the response variable across its range (i.e. at different quantiles) is fairly uniform. If this assumption is not true and the variation of the response is different across different quantiles of the response variable, then linear regression would not be the best model and one may consider using the Quantile regression. Quantile regressions are applicable when the extreme observations of the dependent variable are important and expected to vary. While Linear regression estimates the conditional mean of the dependent variable, Quantile regression estimates the conditional median (or other quantiles) of the dependent variable. Quantile regressions are more robust and not influenced by outliers as compared to the linear regression. However, the other important advantage of Quantile regression is when we are interested in the regression relationship with respect to various quantiles of the response function. Quantile regression scores over linear regression in situations where the relationship between the mean of the predictor and the response variables are weak. Below are examples of likely scenarios where Quantile regression would apply: Predictive relationships pertaining to ecology has been one of the prominent areas where Quantile regression has emerged advantageous Expenditure for a given population of people with respect a set of predictor variables, it would make sense to break the expenses into different quantiles viz. Groups with High, Medium and Low expenditures. Relationship between the quantum of sales vs input factors such as Promotional spend, demographic and other factors, it would help to identify predictors that are more significant for different quantiles of the sales volume and their corresponding relationships. ‘Close rates’ for a department stores – Effect of predictive factors on ‘High close rates’ and ‘Low close rates’ For climate related studies for eg. the factors influencing the intensity of a hurricane, Quantile regression has found application due to the varied relationship of factors for different quantiles of the hurricane intensity Corporate liquidity levels for property insurers have been found to be influenced differently by same factors are different quantiles. While the calculation for Quantile regression is more complex compared to the OLS (Ordinary Least Square) approach, with the advancements in computation technologies, application of Quantile regression is gaining more popularity
-
Benchmark Six Sigma Expert View by Venugopal R Fast tracking and Crashing are ‘compression’ techniques used to shorten the time required to complete a project. Fast tracking is a method where activities that were planned to be performed sequentially are taken up in parallel, where possible. Crashing is method where additional resources are employed to speed up the activities and thus shorten the time required to complete the project. Let’s illustrate it using a simplified example. Image a project to set up a transaction process as per client requirements. The processes involved are Software development, Hardware procurement, Training plans, Space planning, Resource Hiring, Training. The below illustrations show the original schedule, Fast tracked schedule and Crashed schedule. For the Fast tracked schedule, the Hardware development and a portion of training plan have been taken in parallel with the Software development. Similarly, a part of the resource hiring process has been taken in parallel with the training plan and space planning. The time duration is reduced from 100 days to 65 days. For the Crashed schedule, additional resources have been added for Software development, Resource hiring and Training processes, thereby reducing the time duration for these processes, resulting in the overall schedule to reduce from 100 to 70 days. While both the above approaches save time there are certain assumptions, risks and challenges for both the approaches. For Fast tracking: The project manager is assuming that either the there is no dependency for the processes being changed from serial to parallel, or a discretionary dependency is assumed. There is a risk of doing rework and hence consuming more time if the dependency assumptions were not correct. The process(es) selected for parallel operation need to be from the critical path only. Otherwise, it will not result in saving the overall time. It is assumed that there will be no additional resource requirement while changing to parallel execution There will be need to provide effective communication to the team and associated stakeholders. For Crashing: Adding more resources will be costlier It may not be easy to on-board more resources at short notice. The skills of the newly inducted resources may not be adequate and could result in Quality issues Not all processes can be made faster by mere addition of resources. For eg. training process duration will depend on the learning ability of the trainee. Fast tracking and Crashing are compression methods, that are applied by the project manager to save the situation by altering an originally planned schedule. Hence there are risks, challenges and cost involved while applying these methods. They are likely to face resistance from other stakeholders and need to be prepared to own up responsibility in case of failures. It is very important that they effectively involve all stakeholders and apply necessary precautions, monitoring and mitigation plans if the situation requires them to adopt these methods.

-
Benchmark Six Sigma Expert View by Venugopal R Let us begin by looking at the dictionary meanings for 'Control' and 'Assurance' Control means – “to exercise restraint or direction over, to hold in check, curb” For example – ‘he has good control over the car even at high speeds’. Assurance means – “A positive declaration intended to give confidence; A pledge, A guarantee, surety”. For example - 'The employer gave an assurance that the salary will be paid on time'. Now, how do you give an ‘Assurance’ for Quality? What would make a customer accept an assurance as a sustainable promise for Quality? How do we institutionalize the methodology for assurance as a globally acceptable practice? If we look at the evolution of Quality over past one and half century, we would see that it started with an activity to ensure that the goods passed on to customer get inspected and only the ‘acceptable’ ones are dispatched. I am not sure what the person who did this activity was called during those days, but let’s call him / her as ‘Quality inspector’. As the ‘Quality inspector’ kept doing his / her job, the folks who produced the goods started involving with him / her over a period of time and started working on ways to improve the acceptance rate of the product. Though this helped in bringing some improvements, may limitations being faced by the people performing production started surfacing – viz. Design limitations, Process limitations, Resource related issues, Budget constraints, Raw material issues and so on. Naturally, the immediate and initial reactions are to put in curbs or controls to avoid passing on defects to the next stage. Such 'Quality Controls' included stage-wise inspections, adjustment of process / equipment settings based on feedback, identifying process parameters that are found to influence product quality and monitoring them – all these necessitated employees of different functions to collaborate and exercise various levels of ‘controls’ for maintaining Quality. If you read the book on ‘Quality Planning and Analysis’ by Dr. Joseph Juran and Frank Gryna, which was popular from the 1980's onward, you will see how they have expanded the process of Quality Planning as a ‘Company wide’ movement. Juran has also referred Quality as “small q” and the “Big Q”. The “Big Q” defined Quality beyond the boundaries of ‘Product & Processes’ and led to encompassing all functions of the organization. He has been one of the first experts to realize that by mere inspection and control measures, we cannot provide an assurance on a sustained Quality output from an organization. His work has been an enlightenment towards understanding the concept of ‘Quality Assurance’ Some of the topics as part of his reference to company-wide Quality, that built a framework for Quality Assurance include: 1. Quality Costs, 2. Strategic Quality Management, 3. Corporate Quality culture, 4. Customer needs understanding, 5. Designing for Quality, 6. Supply Chain Quality, 7. Manufacturing Quality, 8. Process Audits, 9. Conformance to specifications and fitness for use, 10. Sampling plans, 11. Quality Assurance audits and reporting, 12. Application of Statistical techniques for analysing, controlling and designing for Quality Soon, during the late 1980's, the concept of an international Quality Management System (QMS) emerged in the form of ISO 9000 series of standards for Quality and stormed the world. Many customers consider such QMS certifications as a substantiation for Quality Assurance. Holding on to the concept of ‘Big-Q’, the movement further progressed into extending and combining the use of Quality Management tools and methodologies for the overall prospering of the business, giving rise to Business Excellence Models. Thus, Quality Control and Quality Assurance can be seen as stages in the Quality Continuum. It may also be noted each stage of the continuum would continue to uphold the good practices of the earlier stage. Thus, certain extent of good inspection practices will be part of Quality Control. Quality Control practices will be included in the Quality Assurance System. Quality Assurance systems would be incorporated within any good Business Excellence program.

-
Benchmark Six Sigma Expert View by Venugopal R “Stop-The-Line” is a tough situation. On one side any organization wants to ensure that Product Quality is not compromised. On the other side, there are delivery targets for the day, for which the Operations become answerable. Again, if the line is stopped, it causes idleness for the workers who get an unexpected respite from their routine and the supervisors have to manage the work force who may get scattered once the line stops. Getting them back and regaining the rhythm is another concern. Altogether, it is certainly not an enviable situation for anyone. Even when Taiichi Ohno brought in the system for ‘stop-the-line’ in Toyota, he had many opponents within the organization. The ‘Andon cord’ was a popular system where any worker at any level had the right to pull the ‘cord’ which will result in stoppage of production. Then the concerned staff and the workers will discuss on resolving the issue as quickly as possible and restore the production line. Many organizations do claim that they will practice the system and even empower certain employees to stop the production based on the observing an issue. However there is bound to be many questions that the person who stops the line has to face. Some of them are: We could have continued the production and fixed it without stopping. This problem doesn’t appear serious enough to have stopped the production. Why did you wait till this problem reached the production line and not discover it earlier? Who approved the process? Why are you not questioning him / her instead of stopping the line? You will be held responsible for the loss of production, because you stopped the line. Since you stopped the line, you are responsible to fix it and start the line. We could have completed today’s ‘numbers’ and then fixed the issue as retro-fitment in the finished product warehouse. This is how we have been producing all along. Why are you waking up today and stopping the line? As seen, it is one of the common causes for the shop floor ‘disputes’ between Quality and Operations. I will share some approaches below, that have helped to help take rational decisions on line stoppages. Firstly, there has to be clear unified commitment from the leadership team, in the event of such situations, which are bound to happen some time or other A very good QMS is important to ensure that adequate systems and controls exist on supplied parts, first part approvals, equipment calibrations, change management, design controls for product and processes and so on. We do not want to empower line-stoppage and keep facing it every day! It should only occur as a rare situation. Well documented procedure explaining the circumstances when a ‘stop-the-line’ decision may be taken Procedure will cover who could take such as decision. Care needs to be taken to ensure that the coverage is reasonably adequate to prevent dependency on just one or few individuals who may not be available during such an emergency situation. The procedure should also include the reaction and restoration plans. Sometimes, it would involve pulling back finished goods and retesting / reworking them “Shooting the messenger” attitude should be discouraged, and focus should be on quick and effective restoration. While every effort needs to be taken to prevent ‘false-alarms’, a rare incident of false-alarm needs to be taken in the right spirit. It is better to be safe than sorry! The management should be relieved that someone has been able to point out the defect. Though it resulted in ‘line-stoppage’, it is a situation better than a ‘Product recall’. Every ‘line-stoppage’ situation has to be taken as an incident of hard learning and should be included into the directory for preventive actions.
-
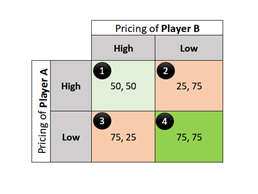
Benchmark Six Sigma Expert View by Venugopal R 'Game Theory' relates to study by theoretical framework and mathematical models to comprehend social situation among competing players and provide optimal decision making. In Game theory, Nash Equilibrium refers to a state of decisioning, among two or more players, in which each player understands the ‘equilibrium strategy’ of other players and no player can gain anything by changing their strategies. The idea has been illustrated in most literature on this topic using a popular example on ‘Prisoner’s dilemma’. To see the application of Nash Equilibrium in a business scenario, we may consider two competing companies A and B, trying to fix their pricing strategies for a competing product. However, a relatively higher pricing can pull down the sales and in turn the overall profits for the companies. Let us assume that the strategy of one player is known to the other player. The different scenarios could be as follows: 1. Player A fixes High price and Player B also fixes High price 2. Player A fixes High price and Player B fixes Low price 3. Player A fixes Low Price and Player B fixes High price 4. Player A fixes Low Price and Player B also fixes Low price The scenarios are represented in the table as below. Let us fix a numerical index of profitability, that is shown inside the cells of the table. The first number represents the profitability index for Player A, and the second one represents the same for Player B. The profitability index is influenced by price and volume. However, a higher price would pull down the volumes thus reducing the overall profitability. Thus from the above table it appears that at lower price has led to improvement of overall volumes from both the players resulting in best profitability index for both. As we can see for scenario 1, both the players have equal profitability index. However, Player A would be tempted to move to scenario 3 to increase its index. Similarly, Player B might shift to scenario 3 to improve its index. Also, in the scenarios 2 and 3, there is a possibility for players A and B respectively to attempt improvement to improve their competitiveness with respect to profitability index. However, in scenario 4, neither of the players will see a benefit in changing their strategies with respect to their competitor’s strategy and hence we can expect the best stability. This state represented by scenario 4 in this example denotes the Nash Equilibrium. In this state, there is a ‘Win-Win’ situation for both the players as well as for the consumers! We may think of another business situation where the players could be the Marketing department and the Product development department. While the Product development’s strategy is to include more innovative features into a newly developed product, the Marketing’s strategy is to time the launch of the product to beat the competition. We can build a scenario to study the effect on the ‘Market success’ of the product and the factors would be the level of innovative features and the time duration for launch. There could be a state of Nash equilibrium, where both the players may not want to alter their strategies, after knowing the other’s strategy. At the Nash Equilibrium state, the Marketing would not want to squeeze the dates any further since, the product competitiveness may be affected. The Product Development would put a freeze on the features to abide by the launch dates, otherwise there is a risk of their future funds getting impacted due to potential loss of revenue opportunity. Again the Nash Equilibrium will get them settle for a Win-Win situation! The above examples have considered only 2 players for simplicity, whereas there could be more in real life scenarios.
-
Benchmark Six Sigma Expert View by Venugopal R Using median as a measure of central tendency helps to avoid effect of outliers. For those who need a clarity on fundamental behavior of mean and median, the following simple example will help. Consider as set of nine data points representing the minimum time in days between failures for nine similar equipment. 70, 248, 2400, 240, 2, 1460, 230, 180, 440 The mean for the above data is 586 whereas the median is 240. Now consider the data set below, which is same as above except that the maximum value has further increased from 2400 to 4800 70, 248, 4800, 240, 2, 1460, 230, 180, 440 The mean has shot up to 852, whereas the median remains unaffected at 240. In the above situation, the median is a more realistic representation as a measure of central tendency of the data. Few examples where the median may be a better choice: 1. Income data in an organization: It is quite possible that there could be a few high paid individuals, by which the mean could be severely biased, hence median is preferable. 2. Age of employees in a society: A few very senior citizens among a majority of people being in the lower middle age band, could give a non-normal distribution. 3. Customer satisfaction surveys using a Likert scale of 1 to 10: A very few customers voting on the upper or lower extreme could distort the reality – hence usage of median helps. 4. Life expectancy based on a specialized treatment: For instance if most patients had a post treatment life span in the range of 10 to 15, one odd patient living for 45 years could provide an unrealistic expectancy, unless we use median as a measure of performance. 5. The comparative tests performed on non-normal distributions, knows as non-parametric tests are based on usage of median. Examples of such tests are 1-Sample sign, Wilcoxon Signed rank, Mann Whitney, Kruskal Wallis, Moods Median.
-
Benchmark Six Sigma Expert View by Venugopal R When we have two sets of data having different averages, if we move one data point from one set to another, an increase in the average could be seen for both the sets, subject to conditions. The conditions are - the data point is moved from the set that has higher average to the one with lower average. The data point happens to be lower than the average of its original set, but higher than the average of the set to which it is moved. Will Rogers phenomenon could thus cause an improvement on the average values of both the groups by just doing a reclassification, all the values remaining same. Let me illustrate this using a simplified practical example. The table below gives the outstanding dues of loans from customers. There are two groups based on age. For simplicity we are considering only 5 data points for each group. From the above table, it is seen that the average for group1 is 4600 and for group2 is 1370. Assume that one customer in group1, who has outstanding of 3200, turns 60 and thus gets moved to Group2. The table will get revised as below: The group1 average has increased to 4950. The group2 average has also increased to 1675. It appears as if there is a increase in the average outstanding for both the groups, whereas none of the individual values has changed. The effect was only due to a re-grouping. Such re-groups whether done intentionally or unintentionally, could alter the average value of a group. We need to be careful in interpreting such business results and confirm whether the changes are genuine or are a result of “Will Rogers” phenomenon. We see articles about how the Will Rogers effect impacts certain practices in the healthcare world. For example, advancements in the methods to detect growth of cancer has resulted in classifying more cases as ‘stage-3’, whereas they were earlier classified as ‘stage-2’, based on the prevailing detection methods. Such a shift in classification has resulted in moving certain cases from stage-2 to stage-3. These cases are ‘high sick’ as per stage-2, but ‘low sick’ as per stage-3. By this reclassification, the average mortality rates showed improvement for both the stages, whereas there is no change in the overall situation. However. While mortality rates could have genuinely improved due to advancement in treatments, Will Roger’s effect from re-classification could make the benefits appear further boosted.


-
Benchmark Six Sigma Expert View by Venugopal R Though the evolution of Industry in the world has been continuous, it is being classified into four stages, or generations, starting from the 18th century. The current advancements in the industry is being termed as the 4th Industrial revolution, also known as Industry 4.0. Before we discuss the characteristics of Industry 4.0, let’s take a brief look at the earlier stages to get an idea on where we have come from. Industry 1.0: It was during the 18th Century that manual methods for production were replaced by usage of steam power and water power in the Western world. Weaving industry was one of the first to take on, followed by others. Industry 1.0 may be seen as the beginning of Industry culture for producing volumes with efficiency and consistency. Industry 2.0: This revolution was around beginning of 20th century and was propelled mainly with the invention of electricity. The advantages of using electric power replaced the steam and water driven machines. Practices for mass production of goods emerged. Further, the development of railroad networks and telegraph brought people together through travel and communications. This revolution led to a up-welling economic growth. The early concepts of Management and Industrial Engineering surfaced. Industry 3.0: This is an era that most of us would have experienced in the later half of 20th century. Developments started after the two world wars. Digitization, starting with the electronic calculators, invention of semi conductors, integrated chips and programmable controllers made deeper strides into digitization. We saw the growth of extensive use of computers for various industrial and other purposes. In turn, this led to the development of software industry. Software usage expanded to various supporting areas of management viz. Enterprise Resource Planning, Logistics, Work flow, Supply Chain Management and so on. Industry 4.0: By the 1990s we saw abundant development in the fields of communication and Internet applications. Characteristics Industry 4.0 has revolutionized and will continue to revolutionize the methods for exchange of information. While the previous Industrial revolutions have helped in bringing the world closer in terms of communications and reach, one of the characteristics of Industry 4.0 is in overcoming geographical barriers for carrying out various activities on real time basis. Cyber physical Systems have resulted in phenomenal transformation on various businesses, providing for machines to communicate intelligently with each other overcoming physical and geographical barriers. Components Industry 4.0 is expected to evolve significantly in the near future. It has multiple components, many of them inter-related. Various articles may be found with listing of several components for Industry 4.0. I am herewith furnishing nine components as identified by ‘Boston Global Group’ 1. Big Data & Analytics An exercise to analyse large and varied sets of data to uncover hidden patterns, unknown correlations, trends, to obtain meaningful inferences that help various situations, especially business 2. Autonomous robots Robots will eventually interact with one another, work side by side with humans and undergo continuous learning 3. Simulation 3D simulation of product & material development, production processes will become widespread. Operators will be perform advance machine settings for next product. 4. Horizontal & Vertical System Integration Horizontal integration means networking with individual machines, items of equipment or production units. Vertical integration means gaining control and connection between different parts of the supply chain. 5. Internet of Things Network of multitude of devices connected by communication technologies that results in systems that can monitor, collect, exchange, analyse and deliver valuable new insights. 6. Cyber Security Processes and controls that are designed to protect systems, network and data from cyber attacks. 7. Cloud Computing Storing and accessing data and programs in the internet, providing real time information and scalability to support multitude of devices and sensors, along with all the data they generate 8. Additive Manufacturing Also known as 3D printing, it is used to prototype and produce individual components 9. Augmented Reality Currently at nascent stage, these systems support variety of services, such as selecting parts in a warehouse & sending repair instructions through mobile devices The above list may not be exhaustive and we can also expect new components to get added in rapid manner going forward.
-
Benchmark Six Sigma Expert View by Venugopal R Burn Down and Burn Up charts are used in Agile Scrum for visual tracking of the progress of a project. The charts typically use ‘Project Story points’ on the Y axis and the no. of iterations on the X axis. Story points are metrics used in agile management to quantify the effort for implementing a given story. Sometimes the time (total FTE hours) is used instead of story points. Burn Down charts help to see the remaining amount of work, the pace of the project with respect to the target, and will give an idea with how close or far the actual completion date will compare with the targeted date, considering the current pace of the project. Burn up charts help to see the progress of work till date with respect to the ideal curve. It has an additional horizontal line that shows the scope of the project at any point of time. In case there is a change in scope, this line will show it as a step up or down. This chart helps in assessing the real efforts being put in by the team, since effect of scope changes could be considered. Thus, it would help in assessing KPIs. Since burn down charts depict the remaining work to be completed, as compared to an ideal target at each iteration, they will be useful for providing commitments to clients and keep them apprised as to the closeness to completion. Burn down charts are simpler and easily comprehensible and would serve the purpose if there are no changes in scope. Both Burn Up and Burn Down charts may be used together for a project for their respective benefits

-
Benchmark Six Sigma Expert View by Venugopal R Bathtub Curve (BTC) is well known for its depiction of the behavior of failure rate of a product during its life cycle. As per the principle of BTC, the failure rate or the probability of failure for a product is high during its initial life time and once it survives a certain initial time period, the failure rate reduces and remains more or less constant until it reaches a ‘wear out’ period, when the failure rate starts increasing. The failures that occur during the initial phase of life are also known as ‘Infant mortality’ and the failures that occurs during the last phase are ‘ageing or wear out’ failures. The causes for the failures at initial stages and the wear out stages would be different. The initial failures could be due to design flaws, manufacturing defects or shipment related. Companies resort to various measures to reduce or manage the infant mortality. It is a common practice to subject electronic products to a ‘burn-in’ test with the intent of weeding out most of the initial failures before shipping the product. Some other methods involve pre-delivery inspections and testing of the product at dock or after shipment to their locations. Manufacturers also provide ‘warranty’ that covers free replacement / repair of products that fail during the early life, subject to certain conditions. The causes for increase in failure rates towards the later part of life are due to wear out of components, other environmental factors such as corrosion, degradation etc. Methods to reduce the rate of ‘wear out’ failures include preventive maintenance, operating procedures, periodic replacement of certain parts such as bearings, belts, tires etc to protect the rest of the product. High Infant mortality would adversely impact the reputation of a product if not controlled within acceptable limits. Further, the resulting expenses due to warranty replacements and product recalls would be a drain due to costs of poor quality (COPQ). Some products like cell phones, computers turn obsolete very fast, due to rapid up-gradations of technology and features. Most users may change over to newer models, even before these products complete their ‘useful life’ period and may not reach the point of ‘wear out’ failures. However, the concept of infant mortality very much applies to them. The concept of BTC applies of all ‘durable’ products that are expected to be in use for a considerable period of time. A related metric that is used for products such as consumer durable is the MOL (Month of Life) failures. As per this, the shipped products are tracked as ‘month wise’ batches based on installation dates, and the service incidents that occur during each month of their life are tracked for a certain period of time. The company will have performance targets on MOL to be achieved. Interestingly, the ‘early failure’ concept applies not only to 'Manufactured products', but to ‘New Processes’ as well. We would have experienced that after rolling out a new process, high incidents of process failures are likely during the early days after implementation, based on which corrections would be carried out. For example, a newly introduced courier service had several incidents of consignments going to wrong locations due to a flaw in their bar-coding system. While ageing failures may be controlled to certain extent for a manufactured product by adequate maintenance procedures, we can reduce or even prevent ageing failures on services by exercising good knowledge management. The concept of 'Bath Tub Curve' may not be very much applicable to goods that are consumed very quickly, such as food items, certain FMCG goods etc. For such products, the life cycle is quite less to distinguish the 3 phases as per the BTC. Instead, the concept of ‘shelf-life’ is more applicable for such products.