

Dhatry
Members
-
Joined
-
Last visited
-
-
“Correction” action to eliminate a detected nonconformity. A correction can be, for example, rework or regrading “Corrective action” action to eliminate the cause of a detected non-conformity or other undesirable situation. Corrective action is taken to prevent recurrence. “Preventive action” action to eliminate the cause of a potential non-conformity or other undesirable situation There can be more than one cause for a potential nonconformity. Preventive action is taken to prevent occurrence. A very simple example that came to mind to describe the 3 terms is as below: 1) A very recent incident at a neighboring office where a fire broke out in the kitchen, immediately fire extinguishers were used to calm down the fire – this action is ‘correction’ 2) After the fire broke out – taking ‘corrective action’ is understanding what caused the fire, and ensuring that fire doesn’t break out once again (preventing recurrence) 3) ‘Preventive action’ - is ensuring that fire doesn’t break out ever again (stopping another fire accident related event happening) The same situation can occur for products, services, processes, delivery of goods etc., and we all face the challenges of choosing a reactive or a proactive approach situation at work or in personal life.
-
With the advent of technology and automation I believe that check sheets will get replaced by consistent, efficient ways to assess and record quality metrics in operations and drive process and quality improvements. Explaining the concept and underlying principle of the check sheet will still remain while imparting knowledge about quality tools but its usage on the production floor or shop floor is certainly undergoing a change. Checksheet is widely in practice even now, and there are 5 Basic types of Check Sheets: Classification: A trait such as a defect or failure mode must be classified into a category. Location: The physical location of a trait is indicated on a picture of a part or item being evaluated. Frequency: The presence or absence of a trait or combination of traits is indicated. Also number of occurrences of a trait on a part can be indicated. Measurement Scale: A measurement scale is divided into intervals, and measurements are indicated by checking an appropriate interval. Check List: The items to be performed for a task are listed so that, as each is accomplished, it can be indicated as having been completed. Coming to the future state I think this is how checksheet would feature in the cognitive BPM tool: 1) A solution that will guide through the process of defining a measurement template with value fields as well as the question set and the proper sampling method. 2) In response to a process trigger, it prepares a check sheet from the measurement template and calculates the required sample size. 3) User then completes the check sheet, noting whether the findings are accepted or rejected and whether the check sheet is complete. 4) User can retain quality samples for analysis and reporting, and can also specify follow-up actions depending on the results. This solution will go beyond momentary quality assessments in a variety of situations, helping to pursue steady quality improvements in business activities.
-
The suppliers, inputs, process, outputs, customers (SIPOC) diagram defines the scope of work for a team and identifies at a high level the potential gaps (deficiencies) between what a process expects from its suppliers and what customers expect from the process. Because it also identifies feedback and feed-forward loops between customers, suppliers, and the process, it jump-starts the team to begin thinking in terms of cause and effect. The integration of SIPOC diagrams with more traditional process maps has proven to be very useful organizations. Benefits Enables all team members to view the process in the same light Visually communicates the process at a high level and defines the scope of improvement efforts The first step in cause-and-effect thinking; contributes to understanding how the suppliers, inputs, process steps, and outputs affect customer(s) needs · Begins to identify gaps such as: Inputs we don’t need but receive Outputs that customers don’t want, but receive anyway Process steps that are completed, but add no value
-
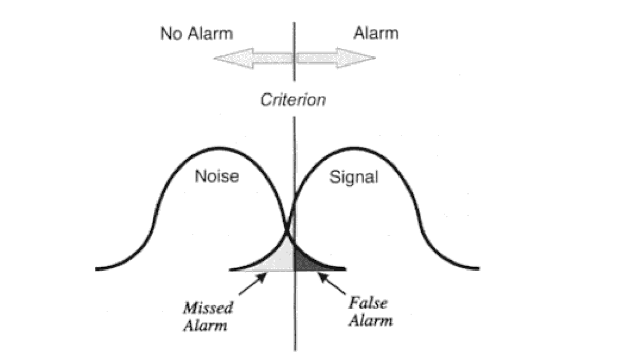
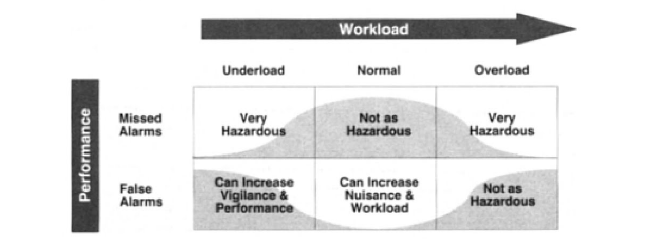
In a user centric processes we often come across the situation where a false alarm is preferred over a missed alert or a missed alert is preferred over a false alarm. In my view, a missed alert represents a significant hazard, and it is best to err on the side of false alarms. Find the below self-explanatory pictorial representations that can be considered:
-
Takt time is an expression of your customer demand normalized and leveled over the time you choose to produce. What takt time does is make customer demand appear level across your working day. What kind of decisions does the Takt Time drive? 1) Gathering information 2) Defining areas of work (zones) 3) Understanding the production sequence 4) Understanding the individual production durations 5) Balancing the workflow 6) Establishing the production plan And these decisions are both strategic and tactical in nature.
-
Law of Large Numbers states that: sample average converges to the expected average as the sample size goes to infinity. Central Limit Theorem states that: as sample size goes to infinity, the sample mean distribution will converge to a normal distribution. Having to deal with Non-normal data is quite a normal and a common phenomenon, the reasons why we face non-normal data is because there will be measurement errors, data-entry errors, outliers, there can be overlap of two or more processes and incorrectly assuming normality can be risky. There are many data types that follow a non-normal distribution by nature. Examples include: · Weibull distribution, found with life data such as survival times of a product · Log-normal distribution, found with length data such as heights · Largest-extreme-value distribution, found with data such as the longest down-time each day · Exponential distribution, found with growth data such as bacterial growth · Poisson distribution, found with rare events such as number of accidents · Binomial distribution, found with “proportion” data such as percent defectives If data follows one of these different distributions, it must be dealt with using the same tools as with data that cannot be “made” normal. References: 1) Isixsigma 2) Bugra.github
-
Fault Tree Analysis (FTA) is a logical, structured process that can help identify potential causes of system failure before the failures actually occur. FTA has the same basic approach as the Root Cause Analysis. FTA allows a backward approach to systematically identify potential causes of failures, and it provides an overview of interrelationships between causes and effects and breaks down failures into more detail. When to Apply FTA: Applied any time during the life of a plant, system, subsystem, or equipment item Primarily used to examine incidents or accidents whose consequences would be classified as catastrophic Often initiated after a major hazard has been recognized for the first time When not to apply FTA: FTA can be least used when the definition of the undesired event can be very hard to catch. Getting exact numbers for the probabilities leading to the event is usually impossible for the reason that it may be very costly and time consuming to do so How FTA is Used: Fault trees are used to determine the frequency of top events for which historic data is not available or applicable Once the top event is defined, the fault tree is constructed by working downwards through the system, one level at a time, to determine what failures could occur which could lead to the top event FTA and FMEA Compared: FTA – focus on failure outcome – Examines the applicable components, processes and conditions retroactively to identify all possible contributing factors that could have worked alone or in combination to cause the outcome FMEA – focus on each system component, and examines before-the-fact all things that could possible go wrong with that component FTA is very good at showing how resistant a system is to single or multiple initiating faults. It is not good at finding all possible initiating faults. FMEA is good at exhaustively cataloging initiating faults, and identifying their local effects. It is not good at examining multiple failures or their effects at a system level. FTA considers external events, FMEA does not.
-
The brilliance of 5S is that it can be adopted by all throughout any organization. 5S stands for: 1) Sort (Seiri) 2) Straighten or Systematically Arrange (Seiton) 3) Shine or Spic and Span (Seiso) 4) Standardize (Seiketsu) 5) Sustain or Self-Discipline (Shitsuke) 5S is a set of practices that needs to be practiced every day until it becomes a habit. Implementing 5S within a service business delivers the following benefits: · Reduces process lead times · Facilitates workplace organization · Standardizes operating procedures · Improves customer response times · Installs policies / guidelines that drive workplace · Contributes to cost efficiency · Helps to identify wastes · Builds a culture of continual improvement · Removes workplace clutter · Reduces waste in the workplace · Improves look-and-feel Let us have a look at an example that will showcase how 5S implemented in a setup out of manufacturing: a. Sort: office materials, maintenance materials or other tools fundamental for delivery and quality, for instance, sorting - emails, files and archives b. Straighten: tools used in services should be arranged in standard locations for consistent and easy access, for instance - data bases, references, operating procedures, reports c. Scrub: maintaining service tools in a neat and clean condition d. Systemize: at all levels, as part of staff regulation routine, employees should go through the work environment and maintain e. Standardize: ensuring the work place and institute processes are maintained in a standard manner.
-
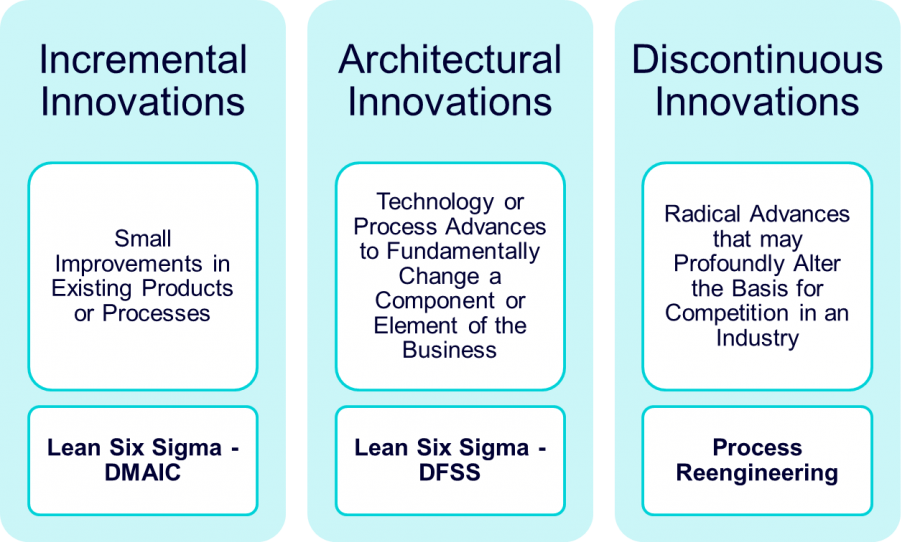
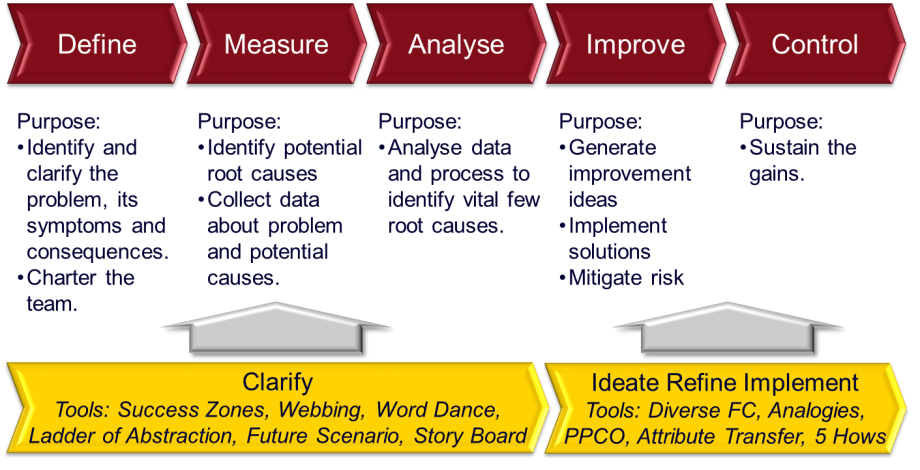
In my view both lean six sigma and innovation are necessary for sustained business success. Several Six Sigma tools including the Cause and Effect diagram and the Failure Mode and Effects Analysis (FMEA) promote innovative thinking and team brainstorming. After identifying an inventive solution, Six Sigma can be integrated to make the most of the solution’s effectiveness. The O’Reilly-Tushman Innovation Continuum provides a better insight on approaches to innovation and how lean six sigma is a part of innovation: Also the below representation gives a fair bit of idea on how DMAIC and innovation are integrated in product development: Since most of the techniques of the innovation process is engaged more in to creative thinking and does not require much of statistical analysis, most of the solutions generated provide short term effects. Using statistical analysis and technique of lean Six Sigma, the creative thinking of innovation can be paired with the thorough analysis of lean Six Sigma. With constant practice, innovation skills will be developed. Referred websites to frame this answer: 1) Innovation excellence 2) isixsigma
-
Metrics around processes can be easily found sometimes and can be very difficult to find sometimes. When it comes to an organization there will be a lot of activities that go on for which there are no metrics and I have seen managers go crazy about this measurement mania as well as people who got fooled by randomness. The recent Wells Fargo fiasco tells us that use of operational and financial quantitative targets might lead to disappointing business practices and if organizations pressure employees to meet numbers they will do it any cost and management needs to go beyond “Looking good by the numbers” and give way to developing real process capability in creating value for customers.
-
When we talk about excellence the first quote that came up to my mind is “Excellence/Perfection is not a destination; it is a continuous journey that never ends.” by Mr. Brian Tracy. The word excellence is derived from the Latin word excellere (which translates to Surpass) so when we talk about excellence it can be defined as the condition or state which surpasses the expectations and delights the user who is constantly on the lookout for improvement. Terms - Personal excellence, process excellence, operational excellence, and business excellence are interrelated and it is not possible to achieve one in the absence of another. Being a strong believer of taking one step at a time, would like to summarize the way excellence can be achieved in any discipline (personal/process/operational/business) Self-examination and the desire to be better and raising the bar from the current scenario – winning the mind of self and other leaders Selecting right goals and their duration: short, medium, and long - ownership Evaluating strengths and weakness – key performance results Placing entire focus on areas that need to be improved: what needs to be done, how it needs to be done, by when it needs to be done – strategy Identifying solutions/improvement plans, verifying whether the solutions/plans will bring about benefits (top line/bottom line) and implementing the improvement plan, reviewing with stakeholder, gather feedback and review. The above 1-5 steps need to be constantly worked upon to remain relevant and create value.