
Topics
-
The latest setback has fueled worries that Google was losing momentum just as OpenAI and Anthropic and a host of Chinese rivals have accelerated the pace of model releases. On the call on Wednesday, Pichai struck an unusually defensive tone as analysts pressed him on the state of Google's frontier models and whether they could still compete at the cutting edge of AI development. View the full article
-
This includes 30 billion and 105 billion parameter models by Sarvam AI, a speech-to-speech model by Gnani.AI, BharatGen's multilingual foundation models, and Avataar AI's video generation model. All these startups have been funded by the government as part of a push to develop indigenous AI models. Of the 20 models, five have been released so far. View the full article


Leaderboard
-
Mayank Gupta
Members1Points679Posts -
AnshulVaidya
Lean Six Sigma Black Belt1Points17Posts


Popular Content
Showing content with the highest reputation on 05/24/2022 in all areas
-
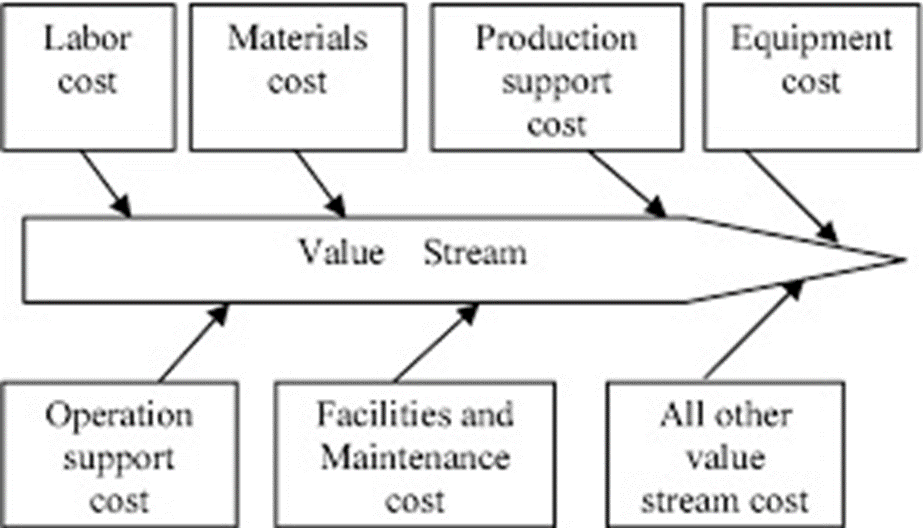
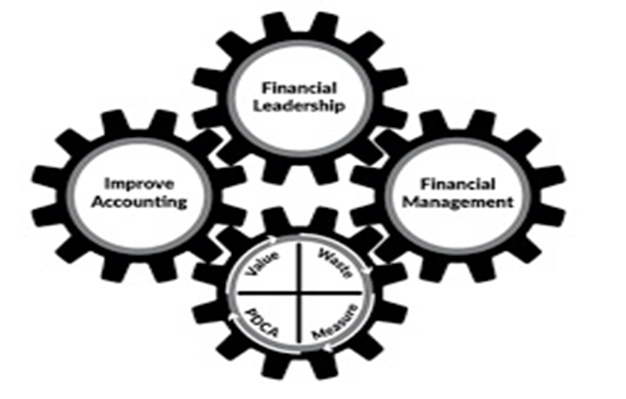
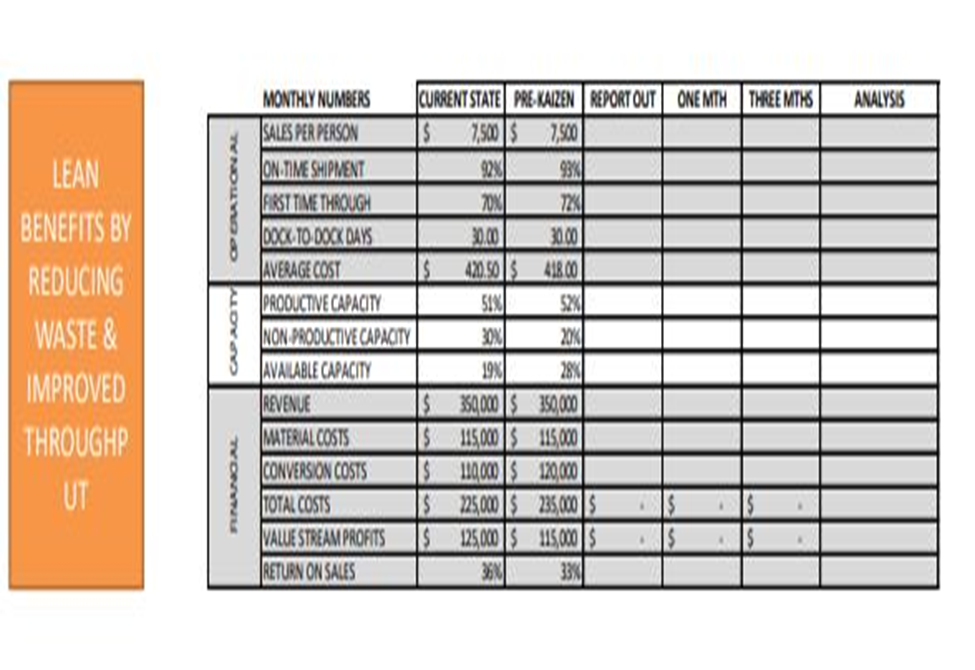
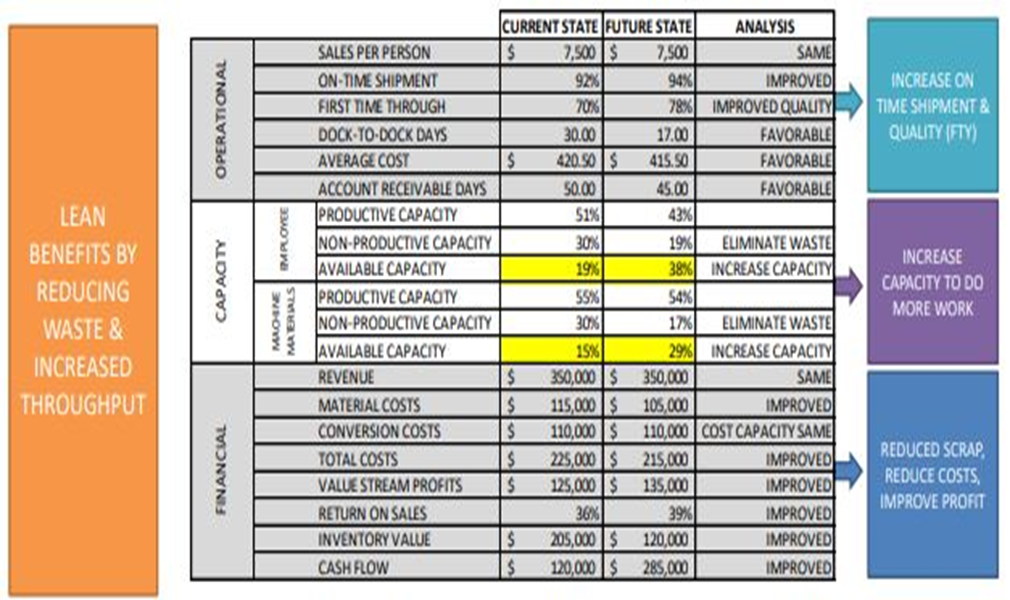
1 pointLean Accounting, refers to the use of Lean thinking in financial practices, followed by a company. Lean Accounting is centred around the idea of improvement in value delivered to clients and waste elimination targeted through better workflow & material management. Core outcome of lean accounting includes improvement in sales, cost reduction, growth in company business and improvement in company’s bottom line operations. Lean Accounting may be implemented through adaption of key five ideas, as given hereunder: 1) defining value, 2) mapping the value stream, 3) creating flow, 4) using a pull system, and 5) pursuing perfection 1. Defining Value: Value is benefits associates with product/service that the customer is inclined/willing to pay for. Ensuring that the value is defined as, “the exact benefit”, catering to a defined customer need, is important to establishing value of product/product group. The use of primary market research techniques such as Face-to Face Interview, surveys, customer-polls help in establishing value of product/service for the customer. The qualitative and quantitative techniques help in estimating the product mix including product, product usage, price and product availability in niche market. 2. Mapping the value stream: Value stream is sum total of activities that add value for the customer from initiation step to final realization of value by customer. The activities that do not add value to customer are defined as waste. Waste may be further differentiated as a. non-valued added but necessary: should be reduced as far as possible. b. non-value & unnecessary: should be eliminated. Different steps and factors in production add to the cost of product and any increment in these register an impact on value stream profit and loss statement in lean accounting. Cause and Effect Diagram: “Value Stream mapping in Lean Accounting” c. Creating flow: Generating a flow in production is necessary to streamline production. The use of sequential steps in production, realignment of activities in production, bifurcation of production space into cross-functional departments, generates steady flow in production. The workload levelling by reducing Mura (unevenness) in production (production of intermediate goods at constant rate), mitigates fluctuations in consumer demand & generated flow in production. d. Using a pull system: A pull based system is established by maintaining a minimal inventory of stocks of raw material, goods, work in progress items required for production. Thus, Just in Time systems, thus generated, ensure that the product/product group is manufactured at the right time and, in the specified quantities, as defined in customer order. The over-production of goods is eliminated as a consequence of maintaining a minimal inventory of stocks of raw material, goods, work in progress items. e. Pursuing perfection: Pursing perfection ensures that company is a learning organization and finds ways to implement little improvements every day, in its operations. Lean Accounting A Lean Accounting System is believed to initiate changes in Financial Management, Financial Leadership, Accounting methods- variables, target, process and stakeholders, along with use of Shewhart cycle or Deming Cycle or PDCA cycle to improve value delivered to customer sustained through waste reduction. With Lean Accounting, the accounting process is shared with Accountants and Value Stream professionals instead of the controllers. The accounting charts are now differently parameterized from standard cost accounting variables-- product cost, standard cost & variance analysis, to value stream profit and loss. The use of cause-and-effect diagram enables prediction of the likely impact of changes in production variable, to value stream of the production process. Anchoring Training and Education about value stream for mentoring employees, assessment about current and present state of industrial production, pilot studies to design value stream improvements, & use of PDCA (acronym for Plan, DO, Check, Act or Deming Cycle) in continuous improvement measures, redefines baseline effectiveness, in the entire accounting process. In PDCA cycle, the alphabet P stands for plan, alphabet D stands for DO, alphabet C stands for Check and alphabet A stands for Act; can be utilized to stream-line the process through examination for weakness and threats, that retard the production. Daily hurdles, visual boards, status checks, Team problem-solving meetings are planned and executed to implement continuous improvement through Shewhart Cycle. Quick wins, are established, that list non-value added and unnecessary activities, which when stopped have no impact on production. Improvement ideas in accounting domain are tested for one to two weeks, before incremental plan is devised in short daily meeting, through continuous monitoring and analysis of the functional data, related to devised improvement idea. The Process improvements are planned in advance to reach specific improvement in performance metrics over a period of time. A process improvement may be discussed and initiated over a period of time to tackle a significant, sudden disruption in process performance. A hypothesis is developed and tested around production and operational parameters, to accept or reject the contribution of baseline performance metrics, towards waste elimination & operational excellence. The results are further scrutinized by experts and organization higher management, to initiate a cycle of activities and schedules, are that repeated periodically in-phase, to improve effectiveness, in industrial production. An existing lean set up in an organization, is qualifying criteria to proceed ahead with Lean Accounting. Next, a provision for a lean budget or hoshin kanri, is pre-requisite to lean accounting. A continuous improvement focus through Kaizen practices, is essential to identify the performance parameters to be monitored, and, tracked through lean accounting. The performance parameters used in lean accounting are represented with the use of box scores. The box scores are tools used for short term decision making, basis the assumption that, the company costs and company consumption is fixed. In medium-term, decision-making box score are developed, assuming that company costs and company’s cost are not fixed. The use of box score enables value stream to publish a ‘weekly P&L’ in terms of actual costs, actual production units. Additionally, it is possible to plot real cost drivers of conversion margin and conversion cost, which is not possible in case of traditional accounting. The box scores are used to shows the performance of the financial results, operational results, value streams and the capacity usage. Financials: Capacity: Operational metrics: Duration: Revenue Available capacity Average cost 3 days SCO Return on sales Productive capacity Dock to dock days 10 days RUN Value stream profit Non productive capacity Sales per person 3 days Evaluate Total costs Stock outs Material costs Scrap Employee costs Machine costs Other costs Utilities Facility Inventory value Cash flow Lean Accounting Metrices Box Scores Performance Measure 6/2 6/9 6/16 6/23 6/30 Goal Operational Units Per Person 15.10 15.63 14.7 15.91 15.90 20.7 On-Time-Shipment, % 100 100 100 100 100 100 Average Cost, $ 343 337 362 338 337 262 Capacity Productive, % 29 29 29 28 28 40 Non-Productive, % 54 54 54 52 52 33 Available, % 17 17 17 20 20 27 Financial Revenue, $ 471 485 456 490 488 576 Material Cost, $ 123 125 129 132 135 139 Fixed Costs, $ 120 120 118 116 116 108 Return On Sales, $ 38 39 35 38 33 48 Types of Box Scores The data for operational performance in box score is estimated using value stream visual management boards. The data for the financial performance information is derived from value stream P&Ls and supporting schedules. The data on capacity is developed as link between operational and financial performance. With implementation of lean initiatives, an improvement in capacity is registered, as non productive capacity is aligned as available capacity. Further the individual estimate of direct cost factors-- labour, material and other factors associated with the industrial production of product/product group. Fixed factors of production-- equipment tool and machinery, insurance, rent, taxes are calibrated to the estimate to reach total costs. The total cost estimated for production of product/product group is then divided by by the number of units to arrive at unit cost for the product/product group in industrial production. Thus a reliable estimate of Direct Cost, Occupancy Cost and Contribution margin and box scores for performance metrices for each product/product group is achieved, that helps in informed decision making, about the product. Lean Accounting in nutshell Actionable Targeted Impact Level Create Awareness Build Desire Demonstrate Sustain System Activities Training and Education Assess Current State. Define Future State. Conduct Pilots Standardize work. Practice Routines. P.D.C.A. Stakeholders Senior Leaders Finance and Accounting Functional Managers Core Transition Team Lean Financial Coaches and Entire Organization Outcomes Training onsite or online Assessment and Design Services Onsite Consulting Blended consulting on-site/online Traditional Accounting & Lean Accounting Traditional accounting practice differs from Lean Accounting on tenants such as inventory management, use of simpler accounting variables, generation of simplified accounting reports, incorporation of value stream & continuous improvement rather than product as accounting objective. Lean accounting encompasses Lean-focused performance measurements to generate correct understanding of the financial impact of lean change. The lean accounting relies up-on direct costing of the value streams & does not support the use of traditional accounting variables such as standard costing, activity-based costing, variance reporting, cost-plus pricing & complex transactional control systems. This in-effect eliminates budgeting through monthly sales, operations and financial planning processes. Lean Accounting companies are expected to have lesser stock items in inventory, to achieve Just-In-Time specification in production, with specific mention in balance sheets as the total value of all inventory. A noted difference between traditional accounting and lean accounting is compliance to Accounting Standards General Acceptable Accounting Practices GAAP, an established accounting standard in United Kingdom. Lean Accounting, as a practice, is not compliant to GAAP requirements & Enterprise Resource Planning ERP software, that make it less prevalent, at many organizations. Further legal provisions may mandate maintaining accounting books, in both the traditional book-keeping and lean accounting formats.


 1 point
 -
1 pointThis seemingly simple question has proved to be very challenging. The statement - "Sigma Level for a process cannot be calculated if there are zero defects" - is only true for Discrete Data. This statement does not hold good for Continuous Data. For Continuous Data, Sigma Level can be calculated (without knowing the actual defect count) and it indicates the probability of getting defects (DPMO). For Discrete Data, we first calculate DPMO / DPU / Yield% (with the actual defect count) and then convert them to Sigma Level. Hence, if defects are 0, there is no Sigma Level for Discrete Data. While there are a few answers which seemed to be moving in the right direction, however no answer is completely correct. Hence, there are no winners for this question.1 point
This leaderboard is set to Kolkata/GMT+05:30