
Topics
-
Fifty-five women engineering students completed an AI bootcamp focused on rural Karnataka. Participants developed AI-based solutions after visiting villages and conducting field interviews. The She Innovates bootcamp partnered with several organizations to achieve its goals. This initiative aims to boost women's participation in AI and entrepreneurship. It encourages AI applications for rural development and community-focused sectors. View the full article
-
Besi's quarterly orders more than doubled, fueled by AI and hybrid bonding technology. The company saw increased customer adoption of its advanced chip packaging solutions. Demand for AI applications continues to drive growth in data centers. Besi anticipates revenue growth between ten and fifteen percent. This strong performance aligns with other semiconductor sector reports. View the full article


Leaderboard
-
Natwar Lal
Members1Points50Posts -
Praveen Kumar K
Members1Points11Posts -
Vinod Shanmugham
Lean Six Sigma Master Black Belt1Points3Posts


Popular Content
Showing content with the highest reputation on 09/10/2019 in all areas
-
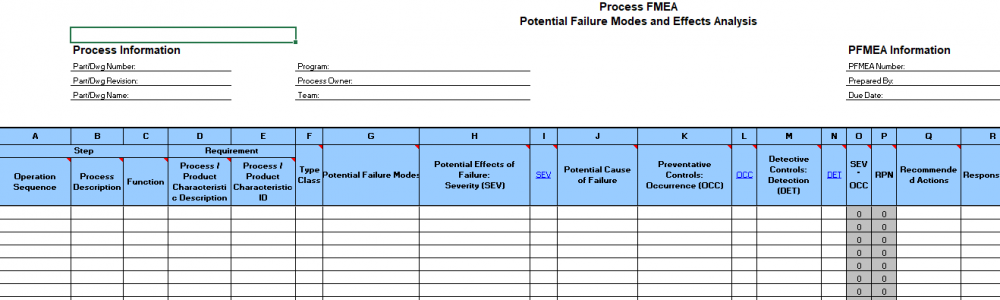
1 pointWhat are existing process controls? Simply stated these are the measures taken in the process to ensure that defective items are not produced. What are the types of existing process controls? There are two types 1. Preventive 2. Detective Preventive process controls have an effect on Occurrence ratings as they prevent the occurrence of the failure modes. Detective controls have an effect on Detection ratings as they help detect that a failure mode has occurred. The same principle is applied when Mistake Proofing is done in the Control phase of a six sigma project. Let us take some examples 1. Production checklist that an agent uses is a preventive control as it ensures that processing is done correctly. If it is used, it will reduce the occurrence of defects. Audit checklist is a detective control as it checks if a defect has occurred or not 2. Using coding best practices is a preventive control as it reduces the number of bugs. Unit testing is a detective control as it checks for bugs present in the system 3. The spelling auto correction or highlighting of the word with red underline in MS word is a preventive control which reduces the number of spelling mistakes (while writing the article). However, a spell check in MS word is a detective control as it detects the incorrect spellings (after the article is written). By the way, in Excel there is only spell check and no auto correction 4. Preventive Maintenance is done in manufacturing. It reduces the occurrence of unplanned downtimes due to faults and hence impacts the occurrence rating 5. The "Caps Lock is on" warning is a preventive control in order to prevent instances of entering incorrect passwords and hence impacts the recurrence rating. The system not allowing to log in if an incorrect password is entered is a detective control which first checks for a valid password and hence impacts detection rating 6. In certain websites, one cannot enter alphabets if it is a numeric field. This is a preventive control which reduces the occurrence of incorrect entry in the field. The warning that some mandatory fields are left blank and system not allowed to go the next screen is the detective control where it checks for entries in all mandatory fields 7. Metal detectors and smoke detectors are examples of detective process controls. These will not impact the occurrence but will definitely have a bearing on the detection rating. 8. The seat belt not worn is a detective process control as it detects that the seat belt is not worn. In some advanced cars, the car will not start unless the seat belt is worn. This is a preventive control as it does not let the occurrence happen In all the above examples, preventive controls impacts the occurrence rating while detective controls impact the detection rating. To sum it up, while doing process FMEA, the below format is more useful where it clearly shows that preventive process controls impact Occurrence ratings and detective process controls impact Detection rating. Source: APQP FMEA format sourced from Google images
 1 point
 -
1 pointExisting Process controls affects the detection rating and also has influence on the occurrence rating Steps Potential failure mode Potential effect of failure SEVERITY Potential causes OCCURRENCE Current control DETECTION Comments What is the step In what ways can the step go wrong Impact if the failure mode is not prevented/corrected How severe is the impact on customer What causes the step to go wrong How frequent is the cause likely to occur What current control are there that prevent the failure mode from happening or detect it if it occurs How probable is the detection of failure mode Report to be saved in the respective location Report was missed to be saved in the location SLA not met 7 Assuming report is saved but not saved in the location/ other issue 1 Self check/Sample audit 6 Sample audit / Self check has influence over the occurrence on the report not being saved Team contacts the customer if no remittance details are available. Team contacts wrong customer SLA not met 6 Lack of attention/ name not clear in invoice 1 Checking previous history before contacting 7 Referring the historical data for exceptions will help for better clarity Log into Application Incorrect user ID Unable to log in 3 Typo error or Typing in urgency 2 System display the Alert message when User ID is Incorrect. User ID same as Z ID hence available with TL as well 3 System control supports in typo error or error to to urgent typing1 point
-
1 pointRun Chart A Run Chart is a line chart that visually displays data over a period of time. It’s also known as a trend or time series chart. Why Run Chart? Run Charts help us to identify patterns that may exist in the data, and trends over time. When to use Run Chart? You should use Run Charts whenever you want to understand how your process has performed over a certain period of time or when you want to see if your changes resulted in sustainable improvements. In a Run Chart we can identify below non-random variations or patterns: Clusters: Cluster is one where we can see a group of data points in a particular area in the Run Chart. We can also identify the clustering by looking at the probability value. If the probability value for Clustering is less than 0.05, we will be having clustering of data in the Run Chart. Mixtures: If the data points frequently crosses the median line, it’s called Mixtures. We can see than when we pool the data points from more than one population. We can also identify the Mixtures by looking at the probability value. If the probability value for Mixtures is less than 0.05, we will be having Mixture of data in the Run Chart. Trends: A trend is defined as a continued drift or float of data. It can be either in the upward direction or downward direction. This is an indication that the process may in near future go unstable. This may cause due to replacement of operators, aspects such as dilapidated tools etc. Trends can be identified by looking at the probability value. If the probability value for Trends is less than 0.05, we will be having Trends in data in the Run Chart. Oscillations: When data swings upwards and downwards, it’s called Oscillations. This gives an warning that the underlying process is not stable. Oscillations can be identified by looking at the probability value. If the probability value for Oscillations is less than 0.05, there will be Oscillations in data in the Run Chart. Comparison of Run Charts Vs. Control Charts: Below are some comparisons between Run Charts and Control Charts: Run Chart: · Run Chart is simple and can be created easily, · Can be quickly analyzed · A person looking at a Run Chart does not require statistical knowledge to read the chart However, a run chart lacks the below advantages which a Control Chart possesses: Control Charts: · A control chart will help us understand whether the process is stable or in control · Is the process in the correct track1 point

This leaderboard is set to Kolkata/GMT+05:30