

Dheeraj Bhardwaj
Members
-
Joined
-
Last visited
Everything posted by Dheeraj Bhardwaj
-
1. Insurance Claims processing center operates on 2 shifts. Each shifts is 8 hours, All Operators get one 30 minute and two 15- Minute breaks within their shifts. The Processing center averages 336 customer claims proceed per day. Calculate TAKT Time. i calculated this Available Time- Shift time- Break Time ( 8*2*60)- ( 30+15+15)* 2 = 840 Minutes Customer Demand= 336 Claims TAKT Time would be = 840/336= 2.5 Per Claim. Please suggest if this is correct solution.
-
*MBB expert guidance needed* In my Six Sigma Career tenure in previous organizations- I achieved my Process improvement project targets through six Sigma tools , RPA , change management, Lean, Agile project, QPA , digitalization. However, in my current organisation - we have separate teams available for lean projects, RPA & QPA, Agile project, change management Transformation. As a CI Six Sigma lead - we are responsible purely for six Sigma Project ( YB, GB and BB) where i can achieve my project target though six Sigma traditional tools only and if any methodology other than six Sigma use ( ex- RPA or change management), This project are straight forward rejected in project quarterly review meeting. Kindly guide how I can survive with traditional Six Sigma methodology in the present scenario because most projects are related to automation nowadays. Need your valuable suggestions please
-
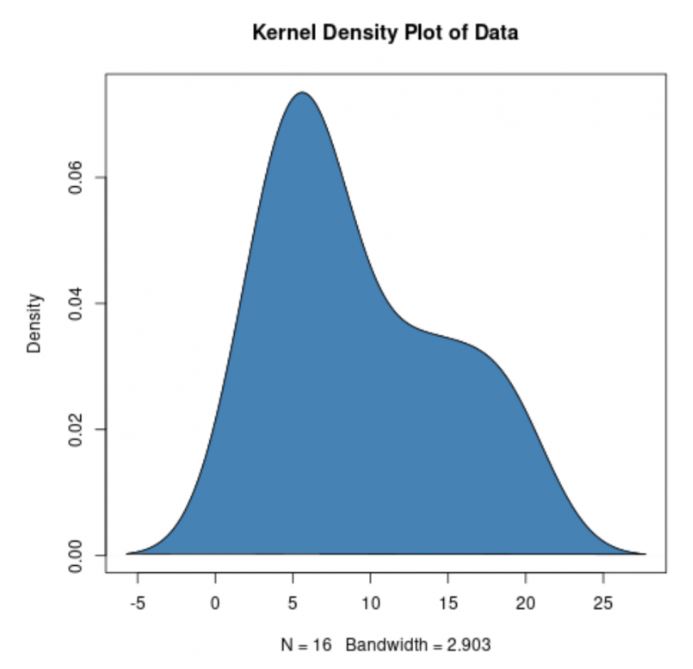
Dheeraj Bhardwaj replied to Vishwadeep Khatri's topic in We ask and you answer! The best answer wins!Violin Plot is combination of a box plot and kernel density plot which shows peaks in data. Box Plot only provide summary statistics, Violin plot depict summary statistics and the dencity of each variable. Before discuss Violin plot, lets discuss Box plot and Kernel density plot Box Plot - also known as a box and whisker diagram, is a basic graphic tool that displays centering, spread, and distribution of a continous data set wherein the box represents the middle 50% of the data. Box plot is used to compare the dispersion and central tendency of data segments based on segmentations factors. Kernel density plot represent the distribution of values in a dataset using one continuous curve. A kernel density plot is approximate to a histogram, but its better at displaying the shape of a distribution since it isn't affected by the number of bins used in the histogram. How to Read Violin Plots- Violin Plots contains many of the same summary statistics as box plots. The white dot represents the median. the thick gray bar in the center provide information about the interquartile range. the thin gray line provide information about the rest of the distributions, except for points that are determinded to be "outliers" using a method that is a function of the interquartile range. every each side of the gray line represents kernel density estimation to show the distribution shape of the data. There wider section of the violin pivot represent a higher probability the members of the population will take on the given value; the skinnier sections represents a lower probability. Violin Plot is preferable to box plot when you want to observe the distribution of numeric data and are especially useful when anyone want to make a comparison of distributions between multiple groups.


-
Dheeraj Bhardwaj replied to Vishwadeep Khatri's topic in We ask and you answer! The best answer wins!Difference between RPA and IPA S.no RPA IPA 1. Robotic Process Automation Intelligence Process Automation 2. Software that mimics human behavior Combination of RPA +AI +Machine Learning 3. Based on Manually written, rule engines and algorithms Based on more complex and end to end process solution with decision making capabilities. 4. Can not auto learn new capabilities. Can auto learn new capabilities 5. Example- Processing Payroll, Call Center Operations Example- Natural Language Processing, Computer Vision 6. Best used for volume processing without too much decision making Best used for decision making required to move between steps 7. Human dependency reduced but not completely Can be process without Manual Human intervention
-
Dheeraj Bhardwaj replied to Vishwadeep Khatri's topic in We ask and you answer! The best answer wins!5 Red tag tool used to clean and organize workspace to optimize efficiency. These are specifically used for the sort process in the 5S program. when processor sort through items in an area, they will use red tag to classify them. which means if anything not required for in a specific area, will be classify as "red tagged". The red tag are generally indicate that when it was brought to specific location and how long it should stay. Please refer below sample format. Create a log maintained by the Red tag area manager. Rules to Red Tag- 1. Dispose of anything if possible before red tagging. 2. Consideration when RED TAGGING items. Obsolete- Sell, Store Offsite, Donate or Discard. Defective- Return to Supplier or Discard. Scrap-should Move to designated disposition area, Red tag or discard. Trash/Garbage- Recycle or Discard Example- Pallets may be immediately removed to a designated area but chemicals must be properly located or disposed of... Criteria to Removing Red Tag from an Item it can move to different area that uses that item sell the item Recycle the item.

-
Dheeraj Bhardwaj replied to Vishwadeep Khatri's topic in We ask and you answer! The best answer wins!Profit After Tax or Earning after tax is measures of Company's Net profitability which is calculated by subtracting all expenses and taxes from the revenues the business has earned. Example- Sumit corporation reports $1 million of sales in the most recent quarter along with $1,00,000 of before tax profit. The company is subjected to a 21% income tax rate so its reported profit after tax is $ 79,000. Free cash flow is the cash a company generates after taking into consideration cash outflow that supports its operation and maintain its capital assets. This is cash left over after a company pays for its operating expenses and capital expenditure. Example- Befree company has a capital expenditure of $ 20000 and operating cash flow of $ 110000. so net free cash flow will be subtracting Capital expenditure from operating cash flow so Free cash flow will be $ 90000. Return on Investment- ROI is a popular profitability metric used to evaluate how well an investment has been performed. To calculate ROI, the benefit (or return) of an investment is divided by the cost of an investment. The result is expressed as a percentage or a ratio. Example- a investor invest $ 5000 into amazon stock into 2019 and sold these shares a total of $ 5800 in 2023. The ROI for this investment would be 800/5000 = 16% Conclusion- PAT, Free cash flow and ROI are unique in their areas and provide unique pictures. PAT provides details net profitability whereas ROI Provides investment performed. Free cash flow provides available cash which can be utilize after deduction of all obligation so project should be priorities as per objective of organizations between these three.
-
Dheeraj Bhardwaj replied to Vishwadeep Khatri's topic in We ask and you answer! The best answer wins!One of the Primary responsibilities of Scrum master for new teams is to coach them to art of working to produced a useable product increment within short sprints. in addition, Scrum master needs to coach the team to identify issues every day and learn to resolves those issues by themselves. The road to excellence is a journey, and the team needs to go through this initial learning with the Scrum master's help. when there are issues that are outside the team's influences, they are called Impediments. The scrum master needs to won these impediments and resolve them. for example- The lengthy testing cycle may be an organizational level constraints that the scrum master needs to work with the larger organization to find an alternative solutions. to address Impediments, team conduct daily stand up meeting. The developers synchronize the on-going activities and create a plan for the next 24 hours to drive the development work. also, any impediments are updated to the backlog of impediments and made transparent so others including the scrum master will know the details even if they do not attend the daily scrum. An impediments refers to any problem faced by developers that stops or blocked their planned progress towards the sprint goal. Impediments threaten the completion of the sprint by the pre set date. in scrum, Impediments are continuously identified throughput the sprint , and they are made transparent during the daily standup. There are following tips that the developers follow whenever they face impediments. 1. Make impediments visible- as soon as someone identified the impediments, they make it transparent to other team members through some communication or at the Daily stand up meeting, whichever is earlier. 2. Solve the impediments if it is within their influences- if there are impediments that are within the influences of the team to resolve, they need to be resolved by the team either directly or using workarounds. 3. Use the scrum master's help for impediments outside the team's influences- if there are impediments need broader collaboration outside the team, the team should seek the scrum's master help.
-
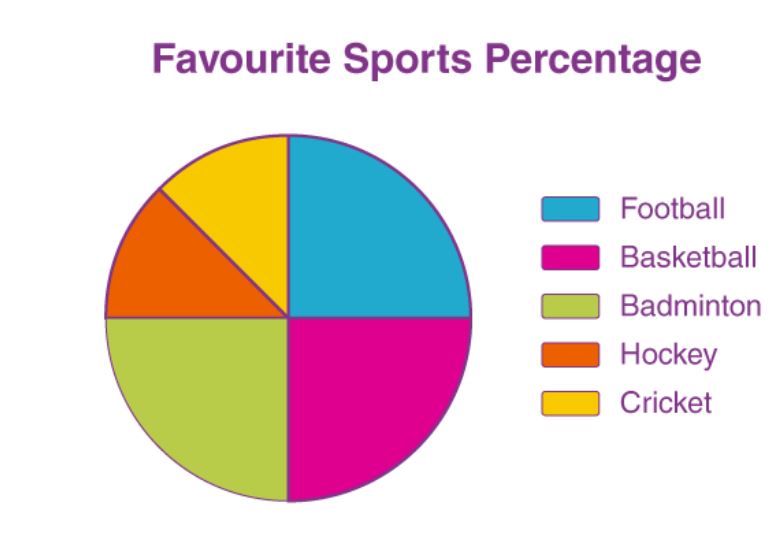
Dheeraj Bhardwaj replied to Vishwadeep Khatri's topic in We ask and you answer! The best answer wins!Discrete and Continuous Data s.no Discrete Data Continuous Data 1. Categoric ü Colors ü Gender ü Region ü Satisfaction Scale Ø Dimensions Ø Profit Ø Sales Revenue Ø Handle Time Ø Lead Time Ø Turn Around Time Ø Weight Ø Temperature 2. Count ü No. of Tickets ü No of Defects ü No of Clicks ü No of Items Sold Discrete Data is best represented. using Bar Chart which displays grouped data using rectangular bars with lengths that are proportional to the values. Bar Charts are broadly used in marketing and finance. there are other charts also used for Discrete Data. 1. Stacked Bar Chart- use it if you are interested in the proportional contributions either of categories to the total or of values within each category. 2. Column Chart- use it to track changes in values over time by comparing total column lengths. 3. Staked Column Chart is designed to compare total and notice changes at the item level that are likely to have the most impact 4. Bullet Chart- use for tracking progress towards goal and measuring how far you are from the target, 5. Pie Chart- it represents the data in circular graph.it requires a list of categorical variables and numerical variables. The term "Pie:" represents the whole, and the "slices" represent the parts of the whole.


-
Dheeraj Bhardwaj replied to Vishwadeep Khatri's topic in We ask and you answer! The best answer wins!A control chart monitors a process variable over time. The control limits are calculated an Upper Control limit (UCL) and a lower Control limit (LCL). The UCL is largest value you would expect from a process with just common cause of variation present. The LCL is the smallest value you would expect with just common cause of variation present. as long as all the points are within the limits and there are no patterns, only common causes of variation are present, the process is said to be "in Control". The Nelson first rules states that if one point is more than 3 standard deviations from the mean than there is special cause exist into the process and if process is operating at six sigma level than this rule is sufficient to identify special cause into your process. this rule is common for attribute and continuous data.

-
Dheeraj Bhardwaj replied to Vishwadeep Khatri's topic in We ask and you answer! The best answer wins!Difference between Control Limit and Specification Limit- s.no Type Specification Limit Control Limit 1. Nature External to the process Internal to the process 2. Reflect Requirement to satisfy a CTQ characteristics Expected Range of Variation for that process 3 Value defined Individual Values Sample average value 4 Determined by Customer Calculated as three standard deviation away from the mean or either side of the mean 5 If points outside the limit Points outside the specification limit is considered as Defect Point outside the control limit shows special cause 6 Upper and lower limit called Upper limit – USL Lower Limit- LSL Upper limit – UCL Lower Limit- LCL
-
Dheeraj Bhardwaj replied to Vishwadeep Khatri's topic in We ask and you answer! The best answer wins!Attribute Data means Data which is categoric (i.e., Colors, gender) or Count (I.e., No of Tickets, no of issues). There are two term Defects and Defective use for Attribute Data. Defects refer to error which fails to meet customer requirement and Defective refers to one or more defects on which customer can rejected that product. People are using DPMO for Defects part and Yield for Defective parts. DPMO refers to defect per million opportunities which is number of defects made for total number of opportunities available for defects Yield is referred to the ratio of total number of units delivered defect free to the customer out of total number of units proceeds.
-
Dheeraj Bhardwaj replied to Vishwadeep Khatri's topic in We ask and you answer! The best answer wins!A method of contradiction solving in TRIZ means to solve a technical or Physical contradiction using the concepts, tools, and techniques of TRIZ to find its solutions. Example- Landing gear must be present on an airplane in order to land and takeoff. it should not be present during flight because of an increase in air dag, the physical contradiction is that the landing gear must be both present and absent, There are Three type of contradiction in TRIZ. 1. Administrative contradiction which describes a desire to improve a characterstics of a system without having an emerging direction of resolution. 2. Technical Contradiction which describes the state of a system where there is an action having a useful effect but causing simultanesously an undesirable effect. 3. Physical contradiction address the part of the technical contradiction centered on that parameter that must have at the same time two opposites values. Yes, when two parameters are functions of the same parameter, a technical contradiction can be converted to a physical contradiction.
-
Dheeraj Bhardwaj replied to Vishwadeep Khatri's topic in We ask and you answer! The best answer wins!Effect size in statistics is refer to as difference between mean of experimental group and control group divided by standard deviation. it's a quantitative measure of magnitude of the experimental group. Both two variables (mean of experimental group and mean of Control group) have a direct relationship with each other and stronger relationship between two variables depends on effect size. The larger- the better. Example- Effect of a therapy on treating a mental health problem. the effect size value will show whether the therapy had a small, medium or large effect on mental health problem. The symbol of effect size is r2, the effect size of Pearson r correlation varies between -1 (a perfect negative correlation) to +1 (a perfect positive correlation) A researcher should look both r value and p-value because the p-value is not enough all the time as p-value sometimes interpreted as meaning there is a stronger relationship between two variables, however it is unlikely that the null hypothesis is true (less than 5%). The p value > 0.05 is the probability that null hypothesis is true. so, a significant p- value tells us that an intervention works, whereas an effect size tells us how much its works.


