

Rajender Prasad
Members
-
Joined
-
Last visited
Everything posted by Rajender Prasad
-
Rajender Prasad replied to Vishwadeep Khatri's topic in We ask and you answer! The best answer wins!Decision Balance Sheet At times when we face situations that requires an important decision, we spend much time searching for a solution while hoping to avoid making incorrect decision. The situation may be a condition that requires to be changed, or a problem that demands to be solved. Decision Balance Sheet is one of the simplest method to decide what to do. Decision Balance Sheet is simple and yet an effective method of decision-making which allows a team to make balanced decisions confidently. It utilizes a record in tabular format that represents the disadvantages and advantages of an idea for the purpose of arriving to a decision as quick as possible. There will always be positives and negatives to each decision made. Decision Balance Sheet is important tool because it keeps us mindful of the reasons we are doing the exercise and the obstacles which may get into our way. Decision Balance Sheet guides to decide whether to go for or against a given situation or a proposed change, improving the understanding of the idea, helps avoid paralysis decision-making and speeds up the process of decision-making. It's very useful especially in teamwork environment when we need to encourage team members to reach consensus by considering multiple perspectives.

-
Rajender Prasad replied to Vishwadeep Khatri's topic in We ask and you answer! The best answer wins!What is a North Star metric? One of the metrics that has paid dividends for many companies in recent years, North Star Metric, is a measurement that is most predictive for a company’s success in long-term. 3 things to qualify for a North Star Metric : i) lead to revenue, ii) reflect customer value, iii) measure progress. When a metric hits these three points, while each department contributes improvement towards it, the organization's growth is sustainable. The importance of a North Star Metric North Star Metrics is to get everyone in the company to focus on 1 goal. 90% of the data in the world, was created in just the past few years, which allows each team, each department, and each contributor to focus on their own metrics. If every team defines their goals differently, they will work against each other and in many cases efforts are duplicated. When investor Sean Ellis of GrowthHackers, created the term “North Star Metric,” his intention was to reduce administration, simplify meetings, and align teams surrounding the single goal for growth. The term North Star Metric - drawn from the name for Polaris, which is the star situated directly above Earth’s Northern pole. Complex business models companies may have multiple North Stars. Most companies would certainly fail if they are in favor of just one, such as recurring revenue, instead of foreseeing all metrics. The North Star Metric is an exercise of simplifying overall strategy of the company into terms where everyone are able to understand, remember and apply. North Star Metric's intention is to serve as guide for long-term. Companies are free to reevaluate their North Star Metrics to ensure they point in the right direction. Amendment should be done as and when they prove flawed. How North Star Metric works For daily use, at the individual level, North Star Metric should be broken down into smaller metrics which drives ownership and also accountability. Most of the sub-metrics are actionable and team-specific. By doing so, individual contributors will draw clear connection between the North Star and their daily duties.
-
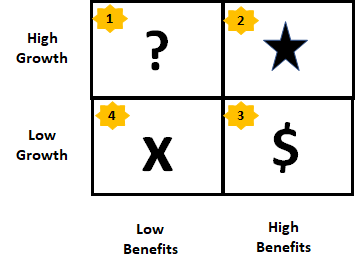
Rajender Prasad replied to Vishwadeep Khatri's topic in We ask and you answer! The best answer wins!Product Portfolio Matrix Product portfolio matrix is a method which many organizations utilize to analyze portfolio of a product, before taking any strategic decisions. The common matrix approach is to focus on growth and market share. The product portfolio matrix, which is also known as growth–share, intends to assist the company to achieve a balanced portfolio, which consists of the right mix of established and new products. Research shows that more than 36% of organizations utilizes scoring as an efficient method for product portfolio strategy & management. Scoring appears to be is one of the most effective tools for companies which prioritizes financial gains. The matrix is categorized in pictorial 4-quadrant, such as question marks (?), stars (*), cash cows ($), and pets (x, dogs are commonly used). Below picture shows the matrix with its 4 quadrants and the product types, whereby dollar sign represents cash cows, and the cross represents pets. Quadrant 1: Question marks represents products with high growth, but has not yet deliver significant benefits — in the sense of generating revenue, enhancing brand equity, saving money, selling other products/ services. Quadrant 2: Stars indicates high growth and delivers desired benefits. DMADV suits in this quadrant. Quadrant 3: Cash cows products are characterized as low growth, but they do offer huge business benefits. DMAIC suits in this quadrant. Quadrant 4: Pets, shows low growth and provides little benefits.
-
Rajender Prasad replied to Vishwadeep Khatri's topic in We ask and you answer! The best answer wins!Three elements of Standardized work; Takt time Work sequence Standard work (WIP) Takt Time; the speed of a job that must be done, so as to fulfill customer demand. Takt time is calculated by dividing the net available time an organization by work in a given time by the customer during same period. For example, if the organization sets 360 minutes to work in a day with customer demand of 180 pcs of their finished goods, the takt time is 360/180 = 2 minutes per piece. This takt time indicates the speed of work in order to match customer demand as close as possible, besides, avoiding waste of overproduction. Takt time is also used to define the timing of the work that needs to be done Work Sequence; the second element of standard work, describes the work done in a numbered sequence of manual tasks. Work Sequence is important to be clearly defined, so that different job can be done by different people and obtain same result. When the process is done in a different sequence each time, we will not get same results. In addition, problems such as accidents, incorrect parts, defects and missing parts, often occur when there is no defined and standardized Work Sequence Standard WIP. Standard Work is Standard Work in Process (WIP). A minimum amount of WIP is necessary to ensure the process flows smoothly. The reason for Standard WIP is to ensure right amount of WIP based on the timing and sequence required, as well as taking into consideration of limiting factors within the process such as lot size and wait time. Standard WIP includes in-process materials. These could be parts which are being worked on manually, parts which are processed by machines, parts which are curing or drying, or parts which are used for set-ups. Standard WIP could also be material or parts which has gone out to an external vendor to process. It is important to establish maximum & minimum quantities for raw materials and finished goods. Meanwhile, Standard WIP does not include finished goods and raw material. Standard WIP calculations: (Auto Cycle Time + Manual Cycle Time ) / Takt Time.
-
Rajender Prasad replied to Vishwadeep Khatri's topic in We ask and you answer! The best answer wins!Service recovery paradox refers to a situation where satisfaction of recovered client/customers exceeds customers who haven't encountered any problems during initial service. A good service recovery leads to higher level of satisfaction and more positive word-of-mouth. Service recovery paradox doesn’t work well for clients/customers who already have failures in the past. Logically, a client/customer will not be satisfied with repeated service failures or large failures. Long time clients/customers who had experienced service recovery will have their satisfaction improved to more or less the same level as compared to a new client/customers. Service recovery paradox works well when the client/customer believes it was beyond your control. As long as there are stong evidence to prove that the issue was beyond your control, the service recovery process stands a better chance of improving customer satisfaction. Service failures has potential to happen, even in a best organizations. This could be due to service not available when promised, late or slow delivery, poor execution, or rude employee. All of these kind of service failures results in negative experiences. Naturally, for business owners, client/customers are accounts which they fought hard to win. Over time, they work even harder to build trust on their client/customer. Because they rely on those clients/customers for recurring revenue & referrals, it is very high stakes if a service failure occurs. This means the clients/customers have a skin in the game too; the client/customers will not be excited about leaving the business owners for a competitor, despite a service failure. Nevertheless, service failure is an opportunity. It is a rare chance for business owners to demonstrate more intimately what it means to work with the business owners. How committed they are to that client relationship, and the extent they will go, in order to resolve a problem. These are the things they do not necessarily get to do while things goes right.

-
Rajender Prasad replied to Vishwadeep Khatri's topic in We ask and you answer! The best answer wins!Noise Factors in DOE are an uncontrollable factors which induces variation when operating in normal condition. Various machineries, raw materials, temperature, humidity, multiple working shifts, are some of the examples. Taguchi’s methodology is an effective method to overcome the effects of noise factors.
-
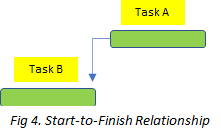
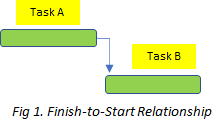
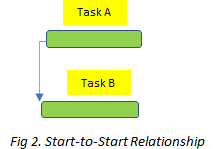
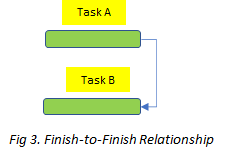
Rajender Prasad replied to Vishwadeep Khatri's topic in We ask and you answer! The best answer wins!4 Logical Relationships in a Project Management Logical Relationships or Task dependencies, denotes the start and finish time (or dates) of a task as it is connected to other activities. The relations are known as : i) Finish-to-Start (FS), ii) Start-to-Start (SS), iii) Finish-to-Finish (FF), iv) Start-to-Finish (SF). Each relationship behaves differently as successors & predecessors interaction. Activities of Predecessor: The planned activity which determines when the logical successor activity could begin or end. Activities of Successor: The planned activity that follows a predecessor activity, as determined by the logical relationship. Finish-to-Start (FS) It simply means; once a task is finished, we are allowed to start the next task. In other words, the Predecessor’s finish time or date determines the Successor’s start time or date. (Fig 1) Start-to-Start (SS) It simply means; these 2 tasks need to start at the same time In other words; when the predecessor task starts, the successor task should also start. (Fig 2) Finish-to-Finish (FF) It simply means; 2 tasks are required to finish at the same time In other words; the successor task must finish once the predecessor task finishes. (Fig 3) Start-to-Finish (SF) It simply means; Task B finishes whenTask A starts, but not before that. In other words; once the successor task finishes, only then the predecessor task should start. (Fig 4)
-
Rajender Prasad replied to Vishwadeep Khatri's topic in We ask and you answer! The best answer wins!Correlation:- used when a researcher wants to know if the variables under study are correlated or not, if yes then how strong are their relation. For regression analysis, to make future projections, a functional relationship between 2 variables is established. Comparison Summary Table Comparison Basis Correlation Regression Definition Correlation: statistical measure to determine co-relationship of 2 known variables. Regression: illustrates how numerically associated dependent variable is related to an independent variable. Where used A representation of linear relationship between 2 variables. Best line is fitted and an estimation of one variable on the basis of another variable. Objective To obtain a numerical value that can express relationship between variables. An estimation of values of random variable on the basis of the values of a fixed variable. Coefficient Nature Symmetrical and mutual Asymmetrical Represents An indication of correlation coefficient to the extent to of 2 variables that moves together. Regression is an indication of the impact of a unit change for the known variable (x) on the estimated variable (y). Independent & Dependent variables No difference between the two. Both variables are different.
-
Rajender Prasad replied to Vishwadeep Khatri's topic in We ask and you answer! The best answer wins!Method-Time Measurement (MTM) methodology is an instrument to describe, configure, structure and plan work systems through process-defined modules, in an effort to be efficient in production. It may be used wherever there is a need to plan, organize and accomplish a human task who wants an effective execution. It simply means; "the method determines its time". For planning issues, MTM methodology justifies the premise to "avoid costs instead of reducing them", which means, plan the processes correctly by executing from the beginning without incurring any extra costs arising from the inefficiencies of the processes. 9 Method-Time Measurement's Basic Motion Elements 1) Reach When the pre-dominant purpose of the motion is to move fingers or hand to a general location or a destination. The time for making a reach varies with the following factors: Below factors makes the reach to vary; (i) Condition (destination nature) (ii) Motion Length (iii) Type of reach:- i.e. whether movement of hands at the beginning or end of reach or not. 3 types of reach for consideration: i) at beginning and at end of reach; hand is not moving ii) at either beginning or end of reach; hand moves. iii) at both beginning and end of reach; hand is in motion 2) Move Move is most basic element deployed when the pre-dominant purpose is to transport an object from one place to another place Move has three classes; (i) Motion length which is governed in a way similar to reach. (ii) Condition (destination nature) (iii) Move types which are similar as in ‘reach’ 3) Turn Turn is basic element employed when the hand, whether loaded or empty, is turned. Such movement rotates the wrist, hand, and forearm about the long axis of the forearm. The length of turn is measured by the degrees by which the wrist, hand, and forearm are turned from it's natural position. Turn time depends on 2 variables; (i) Turned degrees, (ii) Weight factor Turn time depends on weight of the object being turned with non-empty hand. Weight is classified in 3 categories: i.e. small, medium and large 4) Apply Pressure Precise control is exerted when basic element is performed, which becomes as the distinct pause prior to performing subsequent elements, as below 5) Grasp Performing basic element when the main purpose is to secure sufficient control on 1 or more objects using fingers or hand to allow next basic element to perform. It will start when the preceding basic element ends and stops when the succeeding element starts. 6) Position Position is a basic element employed to align and engage 1 object with another object, where the motions used are very minor that they do not justify as other basic elements. Position time is affected by; (a) Class of fit; loose, close or Exact. (b) Symmetrical, non symmetrical and semi-symmetrical. (c) Ease of handling; easy or difficult to handle. 7) Release Release is the basic element to relinquish control of an object by fingers or hand. 2 types of release: (i) Normal Release: fingers are opened to let go the object. (ii) Contact Release: this occurs and is completed when the following reach motion has started. 8) Disengage Disengage is basic element used to break contact between 1 object and another. The objects will be separated away. Disengage times relies upon: a) Fit class b) handling ease c) handling care 9) Eye Times Moving and focusing the eye, in most of work time isn't a limiting factor and consequently it does not affect operation time. 2 types of eye times in MTM; i) Eye Travel Time (ET) ii) Eye focus Time (EF). Eye focus time; time required to focus the eyes on an object and look at it long enough to identify certain distinguishable characteristics within the area which may be seen without shifting the eyes. Eye travel time; is the distance between points from which the eye travel and it's perpendicular distance from the eye to the travel-line.
-
Rajender Prasad replied to Vishwadeep Khatri's topic in We ask and you answer! The best answer wins!Neural network, which mimics the way the human brain operates, is a circuit of neurons, which is also known as artificial neural network, that comprises of artificial neurons. Neural network is used to solve problems in artificial intelligence (AI). The way biological neural systems processes data has inspired how neural networks processes information. Some of the uses of Neural Networks are: -> video or online games -> sequence recognition (handwritten text recognition, speech, gesture), -> decision making (virtual chess), -> diagnosis in medical field, -> control (process, vehicle), -> pattern recognition (face or object ).
