

R Rajesh
Members
-
Joined
-
Last visited
Everything posted by R Rajesh
-
Rational Subgrouping It is the rational or logical way in which data are organised into subgroups to be used in process charts. Subgroups can be used to classify two types of variation in a process –within subgroup and the between the subgroup. 1. Within Subgroup - variation seen within a subgroup ; This is also called common cause variation 2. Between Subgroup – variation observed between subgroups due to one-off factors/conditions or special factors/conditions ; otherwise known as special cause variation Upper and Lower control limits in a control chart are calculated using the ‘within subgroup’ variation and hence it becomes imperative to choose a subgroup so that the process has a common cause variation. So here, the key objective in choosing a rational subgroup is to have minimal variation within subgroup. This is where an excellence practitioner would miss out, if he/she does not make use of the rational subgrouping method properly. Let us see with an example. In a banking IT support project, the support for the project is provided in 3 shifts. The team is a mixture of freshers and experienced professionals. Now there were so many defects that cropped out. The team did not have a clue as how to address these defects. Two rational subgrouping could be done – one on shift and the other with experience level. We need to find which one has minimal variation in ‘within subgroup’. Apart from that, we also need to eliminate ‘between the subgroups’ variations. Let us see with ‘Shift’ as a rational subgroup. There are 3 shifts. Shift1 is having an average 10 defects /day, Shift 2 has 10-12 defects/day and Shift 3 has on rare occasions, 20 defects/day and on other occasions 9-10 defects. Defects include cosmetic, high, severity 2 and severity 1 defects. While the shifts, Shift 1 and Shift2 do not have much difference, Shift 3 has a considerable variation at times. This is due to the fact that on rare occasions SME availability is not available for a key application. Now with the ‘Shift’ as a rational subgroup, shift 1 and shift 2 has minimal variation. To eliminate the special cause reason for SME unavailability, remove the dependency on the SME, by ensuring more SMEs are available in that shift. Spread out the SMEs across shifts. Let us see with ‘Experience Level’ as a rational subgroup. 3 categories. 1-2 years ; 2-5 years; 6-10 years. Team members with experience level – 1-2 years produced 14 defects on an average/day sometimes and 20 defects/day on an average on some other days, team members with experience level – 2-5 years produced 6 defects/day on an average sometimes and 15 defects/day on some other days, and team members with experience level 6-10 years produced 2-3 defects on an average and occasionally produced 5 defects . As we see the variation within subgroup is high and also variation between the subgroups – 1-2 years and 2-5 years is large. Eliminating the variation between the subgroups is not straight-forward. So the best subgroup in this case is ‘Shift’ which will have minimal ‘within the subgroup’ variation Conclusion Thus an excellence practitioner has to choose the right subgroup to ensure minimal within subgroup variation.
-
A Sponsor is usually a higher -level executive or a business leader in an Organisation. He is normally responsible for any improvement projects. What a Sponsor does? 1. Owns and approves (sign off) the Project Charter which includes a).Ensures the problem statement is rightly captured b).Ensures that the project objectives and goals are clearly defined c).Vets the business case and makes sure it is rightly addressed 2. Acts as the bridge between the project team and the leadership team 3. Takes decisions when there is an issue/need for clarity during the course of a project 4. is part of the Toll-gate review meetings and his/her approval would be required in those meetings 5. Ensures a balanced project team is available to execute the project 6. Provides all kind of support to the project team a).Ensures that right Six Sigma green/black belt human resources are available b).Ensures that necessary financial support is provided c). Ensures Infrastructure support is available d).Ensures enough manpower is available across the relevant teams. 7. Ensures necessary trainings happen in place to upskill the knowledge base of the project team Key Qualities of a Sponsor to ensure that Business Excellence thrives in an Organisation 1. Should have visionary on which areas he/she has to focus on to ensure his/her organisation can be competitive in its line of business. 2. Have a visionary process improvement plan to implement all the process improvements in a streamlined manner. That can be always revisited later but an initial high level plan has to be there. 3. Promote Process improvement projects throughout the organisation so as to create the buzz and garner support for such initiatives across the organisation to enhance business opportunities. 4. Create the culture and ensure process improvement ideas/initiatives is imbibed in the DNA of the Organisation staffs. 5. Provide support to the project team at difficult situations and back the team to complete the Process Improvement project. 6. Reward the team with proper recognition in the form of incentives and promotions and take care of the individual needs in terms of professional growth. 7. Show confidence on the members of the project team and back them up to complete the project successfully on time. 8. Lead by example by showing Honesty, Integrity and Commitment to self, to the team and to the leadership team to which he may be part of, as well. 9. Should be an Inspiration to the project team in every aspect and should be a good motivator. 10.Should be willing to be patient to see the necessary or expected outcome. 11.Should create right metrics to make key stakeholders aware of where the project is progressing and how it can impact the business growth positively. Conclusion A sponsor should focus on the areas where improvement is needed and have a long term visionary plan to streamline the improvement initiatives. Also he/she should have confidence in the project team which does the actual work and ensure the team is properly recognised and its professional needs are taken care. The more trust the team has in the sponsor, better is the response to the outcome of such improvement projects. With all these qualities and with right metrics to portray the growth, a sponsor would be able to help an organisation’s business , highly competitive.
-
Why Baselining is important Baseline is the first step for anyone to understand how well a process is working or should work and then how much further we can achieve or take it to the next level. In order to calculate the process baseline sigma, we need to have the following information at hand: 1. No of units that a process can produce 2. Total no. of defects opportunities per unit 3. Total no. of defects Let us take an example: In a software development project for an online site (a java language web based application), 30 files (codes) are there. Customer is moving to Agile framework for the first time and is ok to have 10% defects for the first quarter. There are 5 opportunities to produce defects per file. S.No Opportunity 1 Usage of console - Print statements for debugging purpose which will clog memory 2 Code Not structured properly 3 Not handling Exception properly 4 Improper Relational Database handling 5 User Interface guidelines not properly followed Here is the defects count for each file Files Defects Count File 1 3 File 2 2 File 3 3 File 4 4 File 5 5 File 6 5 File 7 5 File 8 2 File 9 4 File 10 1 File 11 0 File 12 0 File 13 2 File 14 3 File 15 4 File 16 2 File 17 2 File 18 3 File 19 1 File 20 4 File 21 5 File 22 2 File 23 3 File 24 2 File 25 1 File 26 2 File 27 3 File 28 2 File 29 1 File 30 2 Total Count 78 To calculate the DPMO Total number of Defects (D) = 78 Number of units (N) = 30 Total number of defects Opportunities (O) =5 Defects Per Million Opportunities (DPMO) = 1000000 * (D/N*O) = 1000000 * [78/(30*5)] = 1000000 * 78/150 =520000 This is equal to 1.45 Sigma (with 1.5 shift) with yield at 48% and a 52 % defect which is much higher than the customer baselined - 10% defect allowance Now a process improvement was put in place. Coding Standards were introduced and a code review process was put in place. Now with this improvement in place, the opportunities for a defect to happen got reduced to two. S.No Opportunity 1 Improper Relational Database handling 2 User Interface guidelines not properly followed Number of units (N)=30 Total number of defects Opportunities (O) =2 Files Defects Count File 1 0 File 2 0 File 3 0 File 4 0 File 5 0 File 6 0 File 7 0 File 8 0 File 9 1 File 10 0 File 11 0 File 12 0 File 13 0 File 14 0 File 15 0 File 16 0 File 17 0 File 18 0 File 19 0 File 20 0 File 21 0 File 22 0 File 23 0 File 24 0 File 25 0 File 26 0 File 27 0 File 28 0 File 29 0 File 30 1 Total Count 2 Total number of Defects (D) = 2. Note the 2 defects are due to the one file having database error and another file having User Interface guideline issue. Number of units (N) =30 Total number of defects Opportunities (O) =1 Defects Per Million Opportunities (DPMO) = 1000000 * (D/N*O) = 1000000 * [2/(30*1)] = 1000000 * 2/30) = 66666.66 This is equal to 3 Sigma (with 1.5 shift) with 93.3 % yield and 6.7 % defect, which is well below the 10% baseline allowance from the customer. As we see, there is a drastic improvement in the yield and the process improvement made has virtually eliminated all but 2 defects. So the state before and after the process improvement is vast The baseline can even be re-shifted to this new state(6.7%), since the new improvement process is quite capable of producing lower amount of defects. Conclusion Thus we can observe how baselining helps us to know the current position of the process and how much we can improve on our process. We also saw how performance made, after an improvement is having vast difference with the performance made before improvement and how adjustment is made to have a proper comparison.
-
No system can be 100% correct. Normally when we talk about rework, everyone thinks of the bad quality of the product/service that the service provider provides which will impact its reputation and credibility. Rework creates additional effort to be put in, to course correct the mistakes/defects that have happened. Often its conveyed as a waste, because more often than not, the defects raised are due to either a missing step, or to a deviation from the right way of doing or doing things wrongly or doing less than what is needed, etc..,. So doing rework for addressing these category of issues, which should have happened in the first place, is a waste of time and effort. But there are cases, where rework would be a mandate due to the nature of the work being done across industries. Let us take some examples across industries to prove this Manufacturing Industry In manufacturing industries, say for instance, Telecom sector, there could be a Rework unit as part of a Production department. For instance, there could be a quality issue in a product or in a process. The Rework unit will look into the quality issue. If it is a product issue, it could be say a component failure. Movie Industry Invariably in almost every movie, when it is about ready to be moved to the theatres, the Censor board blocks some dialogues or scenes from that movie. This results in as a rework for the movie’s production unit , in editing the movie and then show the movie to the censor board and then upon the board’s approval, release the movie to the theatres. Hence here Rework is very much prevalent and is the only option. If certain scenes or dialogues are not removed as requested by the board, that may warrant a legal action against the producer or director of the movie. IT Industry In a typical agile project, depending upon the business needs of the customer, the product/service needed can keep changing dynamically. Accordingly the design needs to be robust. So refactoring of the design/code can help to achieve the objectives. Sometimes if refactoring is not suffice to support the business needs, then rework effort will be needed. Note: Refactoring is about restructuring the existing code without changing its External behaviour. Conclusion: Thus we have seen here how rework effort does make a difference for various type of works across industries and we see how Zero Rework effort is not possible in some cases and not desirable as well in some other cases.
-
Business Analytics explores an organisation’s data with a focus on statistical analysis which will ensure a data-driven decision making. Benefits of Business Analytics - Ensures the organisation to be a data driven one - Makes an organisation highly competitive in the industry - It helps in scientific way of analysing problems,patterns and trends of business situations Types of Business Analytics: There are primarily 4 types of Business analytics namely, Descriptive analytics, Diagnostic analytics , Predictive analytics and prescriptive analytics Let us see each one of the analytics with a very simple definition. Descriptive Analytics: It provides a summary of the historical data or provides a view of what has happened. Diagnostic Analytics: It tells about past performance. What had happened and why it happened. We are interested/focused more in the Why analysis here . Predictive Analytics: It tells about what can happen in the future. It is a forecast. It can make use of trends/patterns to help out the prediction in a much better fashion. Prescriptive Analytics: It prescribes the best possible solution/result amongst a set of choices, for a given problem or concern. Comparison of Business Analytics with Lean Six Sigma terminologies 1. Descriptive analytics tells about the problem and is much akin to the problem statement that is present in the define phase of a Lean Six Sigma (LSS) project 2. Diagnostic analytics talks about the cause of an event/issue, which is akin to the root cause and analyse techniques of analyze phase in LSS such as Paretto chart, Fishbone diagram. 3. Prescriptive analytics states about the best possible solution which is akin to design phase in DMADV or Improvement phase in DMAIC and usage of tools such as Pugh Matrix /Design of Experiment to provide best solution or to prove the results respectively. 4. Predictive Analytics is one area which needs to be explored from a LSS perspective. While the analytics uses lot of trends, model and probabilities for its usage, in LSS , probability mechanisms might be used. For finding trends, proper charts such as run charts , and other relevant charts should be used Conclusion While as we see each one of the analytics are meant for different purpose, the descriptive analytics, the diagnostic analytics and the prescriptive analytics are well covered in LSS community, the predictive analytics requires more focus from the LSS community.
-
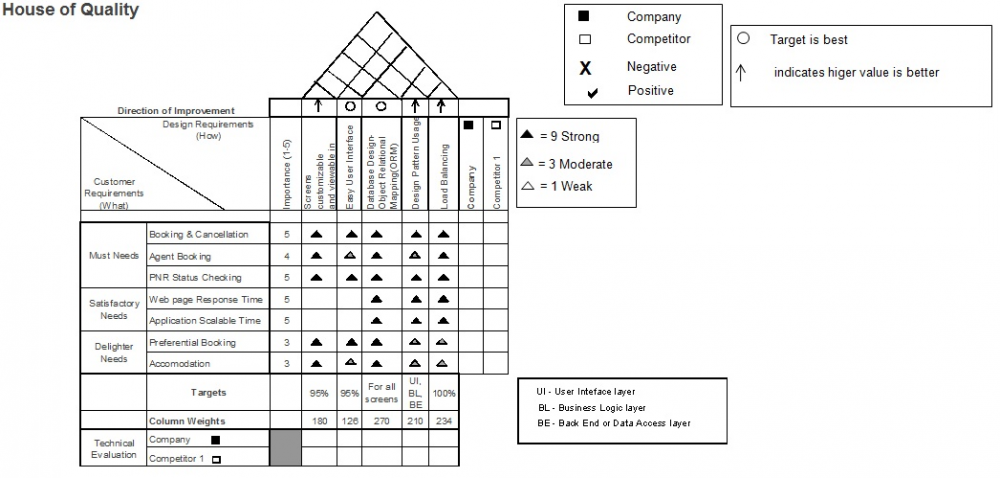
What is Kano model Kano model serves to prioritize the needs of the customer. Often, the data gathered through VOC techniques might be too much. It would require an affinity diagram to group that information. Once done, it would require a kano model to prioritize the needs as must needs, satisfactory needs and delighters/excitement needs. Having the needs prioritized would ensure that customer gets a minimum viable product in the first place and ensures that the customer is not unhappy with the service provider , in terms of the product or service provided Eg: A kano model shown for the needs of an airline company ‘s website Benefits of Kano Model 1.It creates awareness to the project team and other stakeholders in the service provider organisation about the features that customer wants categorically 2.It helps in improving the customer satisfaction as customer needs are known 3.It can help in achieving the expected results for the customer at the right time (as focus is obtaining minimum viable product (MVP)) What are the next steps to be done, after prioritization of needs through the Kano Model 1.If the project runs in Agile Environment, the product backlog should be designed such that the order of backlog items would be to have Must needs, followed by satisfactory needs and then exciting needs. Equated to the term “MoSCoW” [Must be, Should be, Would be]in Agile parlour. [Product backlog is nothing but the project needs prioritized as per the Product Owner who knows the business needs] 2.Ensure that the design of the product/service is good enough to cover the minimum viable product – Must needs and Satisfactory needs 3.If design is not suffice, do the course correction immediately to avoid customer dissatisfaction. A scientific way of doing design can be done through Quality Function Matrix (QFD). a.If we are in the middle of the project and requires a course correction, then it may require some deeper understanding and usage of QFD may be complex (or levels could be increased) b.If we are in the beginning of a project, then its relatively easy to provide a QFD matrix c.QFD is essentially used to convert the requirements (needs) into technical requirements. 4.If the project is Agile scrum based, then if design change is required then it can be in a separate sprint called ‘Architectural Spike’ and QFD can be used to improve the product/service design 5.Once QFD is done, implement all the aspects mentioned in QFD in the product/application and test it 6.Compare the outcome with the expected results and that should be achievable. Else re-do the design to meet the customer needs. Let us see for the airline’s website as how we implement the Must needs, Satisfactory needs through a QFD Attached the same as an excel for brevity Conclusion Having a kano model ensures that customer expectation is properly understood which can shape the product/service in the way the customer wants and thereby the service provider can ensure that customer is having a viable product and avoid any customer displeasure. house-of-quality.xls

-
Statistically Significant Difference By principle, a statistically significant difference does not attribute to a chance. Sometimes its possible to detect significant difference between two populations when there is no practical importance. So what would the driving factors to consider to convert statistically significant difference into a practically significant difference? It depends on the context where this is achieved. However Cost, Time, Resources would be some of the key elements in deciding that Let us see how we can utilise this concept in Problem Solving and Decision Making with an example. Eg: A Supermarket retailer decides to buy firecrackers for Diwali festival , so that he can sell to his customers. He prefers to buy from one of the two reputed brands which produces crackers- Brand A and Brand B. His marketing team told him that both are good brands and will have good quality crackers. So from a hypothesis perspective, null hypothesis (hO) made by him was there would not be any or appreciable difference in terms of quality / sound for crackers of similar nature. Alternate hypothesis (ha): There is a difference in terms of quality / sound between the two brands and that Brand A is better than Brand B. Initially with a limited amount of samples that the retailer got, both the brands seemed to be ok in terms of quality/sound. But as more and more samples from different cracker of categories were put , the difference became significant . So it became apparent that null hypothesis had to be rejected and hence Alternate hypothesis was accepted. Therefore, retailer came to the conclusion that Brand A is better than Brand B. However the retailer do not want the Brand A crackers. Because Brand A is too costlier than Brand B for this difference in quality . So it is not worth for the retailer to pursue to buy crackers buy from Brand A. So in this case, the statistical significance is not turning into a practical significance. The retailer took a decision with the help of the hypothesis testing with right sample size Conclusion As we have seen statistically Significant difference can aid in decision making and problem solving provided if we are able to focus on the factors that lead to practical significant difference
-
Stable Process A simpler definition : A process which can be consistent over a period of time, in producing its output is a stable process Capable Process : A process which can meet the target mean and customer specification limits . Process capability can be measured by two terms , Cp & Cpk. Cp talks about Process Capability and Cpk talks about process performance. Cp is a ratio of tolerance of width to the short term spread of the process. It does not consider the centre of the process. Cp assumes that the process is stable - If Cp < 1, process is incapable. - If Cp=1, then this process meets the expectation barely , there could be defects atleast .3 % - If Cp > 1, then this process output falls within specification, but defects could be there if the process is not centred . - If Cp=2 , then we achieve 6 sigma Cpk on the other hand, considers process centring. It is a ratio of the distance measured between the process mean and the specification/tolerance limit closer to half of the total process spread. It assumes that the process is stable - If Cpk=Cp, the process mean is on target - If Cpk=0 then the process mean falls on one of the specification limits, 50% of the process output falls beyond the specification limits - If Cpk<-1 the process mean falls beyond both specification limits and therefore 100% of the process output is out of specification limits A process is assumed to be statistically stable before we calculate its capability. So process stability is of paramount importance for all types of processes, especially if we are running a DMAIC project. But if we are not able to control the existing process and are unable to make it stable or if the improvements that we make on the existing process do not yield the necessary or expected results, then its better to go for a new process through DMADV or DMAODV Now as we have seen what stable and capable process are all about, let us see the impact of a process being unstable. What could be the reasons for a process to be unstable 1. It could be because of special cause variations of different nature. Common cause variations are inherent to the process and hence cannot be a cause 2. It could be because the design of the process may not be good enough to meet the customer expectations. Eg:1 Let us see how special causes can impact stability Everyday , the local agent for Aavin milk, needs to provide milk to all of his customers between 5 AM – 5:15 AM IST. He chooses a pre-defined route on a routine basis and goes by the same route daily and delivers milk, by a bicycle. But every now and then, he misses the timelines by 10-15 minutes and delivers late ranging from 5.25 AM to 5.30 AM IST. This is because , one day he sees road blockage in few lanes due to plumbing work done for water connection. As a result, he has to take a circuitous route and then on an another day, sees a road blockage because of telephone work happening. On some other days, it could be because the milk delivered to the agent was delayed and in a different occasion, because stray animals were there in the street, he has to take a different route and this delayed his delivery timelines. As we can see here, these are all different reasons and all of them special causes which make this process of - delivering the milk, unstable. So we need to find an alternative way of improving this process (DMADV or DMAODV). One way is the agent having a motorbike to improve his speed of delivery. Other option is to find better or closest alternate routes for each of the problematic lanes/streets. First option is much better though Conclusion: All processes need to be stable in general. A capable process is assumed to be statistically stable as well. When an improvement is being done for an existing process which requires stability, and if we are not able to see the necessary yield or stability in the process, then we go for a DMADV or DMAODV project.
-
Correlation is used to predict the relationship between two or more variables. It essentially says whether a variable (X as input) can cause influence on the output variable (Y). Properties of a Correlation 1. It establishes the equation, y=f(x) 2. It talks about the measure of strength of association between two quantitative variables - It could be positive or negative correlation or no correlation. - Positive correlation indicates that if x is directly proportional to y - Negative correlation indicates that x would be inversely proportional to y 3. It lies between -1 and +1 4. Coefficient of linear correlation r is defined as the measure of strength a. r >0 indicates positive linear relationship b. r<0 indicates negative linear relationship c. r=0 indicates no linear relationship Let us see as why we use Correlation in root cause analysis despite as we know Correlation does not mean causation. - With the help of a scatter diagram, investigate for each of the vital factors (x) with Y variable or CTQ - By doing that, it can prove or disprove our hypothesis that we would have formulated Eg: A mid-sized company has its internal website opening up slowly. Employees of the company are thinking that this could be because of internet speed slowing down. But the team managing this project, threw multiple vital factors. So a scatter diagram was drawn for each vital factor against Page Response Time (CTQ). The Factors were – Internet speed , DB Operation time taken, Scalability (>1000 persons). Null Hypothesis (ho) : Internet Speed is affecting the Response Time Alternate Hypothesis (ha): DB Operations affecting response time primarily When the Scatter diagram was plotted with values, it was found that DB Operations were taking time due to back and forth calls made between Database and the application because of poor coding. This disapproved the null hypothesis assumption Conclusion: As seen above, this is where and how Correlation can help in giving pointers to RCA
-
VOC: Voice of the Customer is one of the powerful techniques/tools used to capture the stated and unstated needs of the customer/project stakeholder(s). Let us see how the merits and demerits of gathering VOC and its impact Merits: 1. Many ways to gather data – Focus groups, Interviews, Surveys, Questionairre, Complaint Log,... 2. Can be used in conjunction with Voice of Business (VoB), Cost of Poor Quality to generate Six Sigma Project ideas 3. Can be used to translate this information to Critical Customer Requirements (CCR), which is measurable with a target and an agreed range. 4. Then CCR (which is at a higher level) will be converted into CTQ. Eg: Voice of Customer : IT Programme Director (Customer) Rajesh R Source Complaint Log Item Search Results on the web application taking too long CCR Search Results to be displayed in ~3-5 seconds CTQ Response Time Demerits: 1. Too many stakeholders might have their views to be represented in the project. Sometimes this may digress the probable needs of the project 2. Identifying the key and right stakeholders for the project is a must. If not done properly or \ overlooked, this will be a problem as we might miss out the right needs of right stakeholders 3. If we do not have the needs segregated with a classification of Must Needs, Satisfactory Needs (say a KANO model applied on top of the VOC data & doing data affinity) , then it becomes cumbersome and inadvertently there is a chance for the project to miss some needs. Eg: Let us take a hypothetical case. Voice of Customer : Non Functional Test(NFT) Manager (Customer) Ramesh R Source One-to-One interview Item - UI view alignment for the web application should be same across browsers, mobile platforms - Application to be scalable without any performance degradation when crossing 1000 persons Now assume that this non functional testing manager is a key stakeholder. But more often than not, people tend to focus on all needs other than NFT needs [In general, its missed more in waterfall model than in Agile model. But still in Agile, this NFT needs may be parked in the final sprints]. Now when the project was developed and delivered in iterative fashion, this need was not delivered. This was overlooked because there were so many functional needs and this was missed out inadvertently. So this resulted in that key customer getting dissatisfied. This could have been avoided if we had rightly grasped the stakeholders’ needs properly. Conclusion Even though VOC helps in knowing the customer needs, but as aforementioned , too much of data gathered through VOC techniques, might impact negatively and can even lead to key stakeholder (read customer) dissatisfaction.
-
Process Maps A Simplistic view of SIPOC, Swimlane and Value Stream provided here. Let us take a deep understanding of each one S.No SIPOC Swimlane Value Stream 1 Focus on identifying the start and end points (boundaries) of a process flow(map) Focus on identifying which process steps/processes in a process flow(map) are taken care by which department or by whom Focus on identifying the value adding , value enabling and non value adding process steps/processes in a process flow(map) SIPOC: It is a process map in which the start and end point (boundaries) are known. SIPOC stands for Supplier –Input- Process- Output–Customer. Often this is the most used form of process map, to depict the end-to-end process flow of the product/service that an organisation makes/provides. In a Six Sigma parlour, SIPOC is also called as COPIS, to give customer the preference, to stress out the importance on out-side in perspective (thinking from customer perspective). Let us take an example of an IT development project. A Service provider is developing a web-based application to a retail customer. A zero level (high level) process map can be seen here Zero-level process map The above process map can be further sub divided into next level- level-1. Level -1 process map There can be a next level (level-2) . That could be code having defects and a rework coming to the developers. Let us see that level of details using a swimlane process map. Swimlane It shows who or which department or team is responsible for each of the the sub-processes or the process steps in a process flow. As we can see the swimlane here as a horizontal division. The swimlane can also have a vertical division as well. Value Stream: It identifies the sub-processes or process steps in a process flow that are value adding, value enabling and non value adding. For example, let us consider the following example. For the moment let us ignore the time taken for each process step. Our focus is to highlight the value added, value enabling and non-value adding process steps in a process flow. Colour Legend: Green – Value added steps; Blue – Value enabling steps; Red-Non value adding steps. Now we identified this process is having a waste step and a value enabler activity. Can we improve upon this ? Now all processing steps became value added steps. With automated unit testing and automated system testing, high quality product is produced. This is a hypothetical case to demonstrate the value stream map's purpose (does not mean that automation should necessarily bring down the defects rate). Now what if the code review happens manually, why cannot we make use of static code analyser tools such as Checkstyle, PMD, Findbug, SonarQ.... Again we can expand the above diagram and split Code - Code Development and Code Review . Then eliminate the manual review with automation using one of (or all of )the aforementioned tools or any other tool that can help you on that. So you can expand or go deep into your process, till you feel you have eliminated waste steps in your process flow. Which of these three process maps can be used for detailing your activities or process steps? The answer to this question depends on how your problem is ? Do you just need to expand your processing steps so that stakeholders need to know how it works ? Do you need to know who is responsible/accountable for each step of your process flow ? Does your organisation need a fix to avoid waste in your process for which you need to identify unnecessary process steps? The solution for each of these questions will determine what type of process map you need to have detailed out. SIPOC: Use it when the stakeholders need to understand the full steps involved in a process. Stakeholders could be project team, project sponsors, customers, senior mgmt (other than sponsors) or any other affected parties (positively or negatively because of the project). This is one of the most used after process map diagram. Swimlane: As can be seen in the swimlane diagram, in case , when we want to know the person/team who is involved in a particular sub process or process steps, then we would explore using this process mapping technique. Value Stream: As we saw in the example, we use value stream when we want to know what are the sub processes or process steps of a process flow, that are needed and what is not needed and what are the process steps (or sub processes) that might act as enablers to the needed ones. In case , where there is a need for improvement for sub-processes then we take a deep dive to find out where the non-value added activities or process steps are present and eliminate them Conclusion: While SIPOC is a normally used process map, to detail out at multiple levels, there are swimlane and Value Stream maps as well that can be used for detailing. Swimlane can be used to detail out the processing steps when explicitly we want to know as who is responsible for those processing steps. Value Stream helps in fixing waste processing steps at a detailed level and also provides value added processing steps. Hence concluding with the fact that detailing of process steps or sub processes in a process map can happen with any one of the 3 process maps – SIPOC, Swim lane, Value Stream though it depends on the situation or primarily the need of the customer.


-
Data are classified into two types – attribute data and measurement data Measurement Data: It is otherwise known as Continuous data or variables data and is obtained from the measurement taken on an item or a human being. For instance, weight and height of a person, body temperature of a person are all good examples of the continuous data. Here data is measured on a continuous scale. Attribute Data : This can occur when a variable is classified either as categories or as a count data (occurrence of an event). When it comes to categories, the categories can have a binary option or multiple options. In other words, we talk about nominal and ordinal data. Nominal data can be for instance- passed or failed, yes/no. In an ordinal data, say, a Customer Satisfaction Survey, the categories would have a ranking, such as 1-Excellent, 2-Very Good, 3- Good, 4-Satisfactory, 5-Bad, 6-Worse. Cases where datasets can be confusing 1. Sometimes, the measurement system of the process that we work on, may not be good enough or calibrated to our needs. Eg: We want to buy vegetables in a small vegetable shop in a village. The shop uses a weighing balance (traditional weighing method using measured stone weights) to measure the weight of vegetables. The same quantity of vegetables bought in a Super market, might give a different value, because of different measuring unit (electronic weighing machine). More chances are that i would treat this data (from Super market), if collected for multiple customers, as a continuous data, rather than the weight obtained from the shop in the village, which i would treat as an attribute data. The reason being, the electronic weighing machine would provide me the weight in decimals and i may have opportunities to have continuous data . Conclusion Thus we see there are scenarios, where your dataset can be treated as either continuous or attribute . Ultimately , the more continuous values we have, better would be trap the variation in the system and address it and ensure better process control is there
-
Correction: It is providing a fix or a solution for a defect or non-conformance. It can be either a workaround solution / temporary solution for an existing defect/non-conformance. More often than not, this could be an immediate action required to address the issue. Eg: Sometimes a critical application (say in production or in test environment or User Advanced Testing(UAT) environment) might not reflect the new changes when re-deployed again. It could be because the application can still point to old files/code, probably say, due to server caching the old files. Now to make matters worse, if this has got severe impact, then this needs to be addressed immediately. To correct this immediately, a Server restart could be needed to clear cache memory issues Corrective Action: It provides a permanent solution to fix. It normally provides a sequence of processing steps to correct the non-conformance issue. Root cause analysis tools such as Fishbone diagram, Paretto chart can help analyse the issues and then accordingly the corrective action steps can be defined. Eg: Considering the same example of a critical application (say in production) not reflecting the changes made. So as temporary measure, we restarted the server and provided a quick fix. Now everytime when we face this issue (Whenever new functionality is added/changes are made into the application), we cannot restart the server at every time. As a result, we need to provide a permanent fix. So one way to provide a fix is to add a time-stamped value to the existing file(s) which have the new functionalities/changes covered and the server automatically picking the time-stamped changed files and ensure it uses the latest file(s) for the application, when the application is redeployed on the server. With this fix, this specific issue of cache memory may not occur. There may be multiple ways to fix this issue and this is one approach. But the objective is to have this issue permanently resolved. However again, this corrective action may not be suffice. The whole issue is about the new functionalities not visible in the application. So what else can stop these functionalities from being visible. So there could be multiple areas/failure points that need to be addressed or taken into consideration. This is where preventive action comes into play Preventive Action It helps in providing series of steps or checklists, using which we can prevent the occurrence of similar kind of defect/non-conformance issues. Usage of tools such as Design FMEA process, Pugh Matrix (for optimal solution), Known Error DataBase (KEDB-knowledge repository), pattern analysis, trend analysis........can lend value to this. Eg: Every now and then we add new functionalities to the critical application, as it keeps growing. The chance of application not having new functionalities would become more. So to avoid facing issues before they arise, we create a checklist and where we anticipate changes in the code or need design changes, we make it ready before it happens Let us also see some more examples as how these 3 – Correction, Corrective Action and Predictive Action wok in a typical IT support. Correction: In a Support environment, an application or a functionality may not be available. A severity 1 incident might be fixed which requires an immediate fix/solution to be applied. Such a solution provided is a Correction to the issue of non-conformance Corrective Action: When the application/functionality is not available or down, frequently, then we try to provide a permanent fix by creating a Problem Record (reactive Problem Management). The permanent fix (solution) might take some time and then would ensure that the issues are not repeated again. Tools like KEDB can be used to track similar incidents and a common solution can be arrived at. Preventive Action: By identifying the incident patterns/incident trends, we can find potential blocks related to the situations / scenarios as when the application/functionality can go down. Accordingly corresponding code changes/design changes can be down. This is Proactive Problem Management. Tools like Kepner-Tregoe can be used for proactive problem management Are there situations where both preventive action and corrective action are undesirable and correction is the only preferred action? There can be scenarios where this can happen though in very rare circumstances and can depend with the type of business and the kind of service that organisations want to provide their to their customers . Providing one such instance here a). When there is an instant fix to be done immediately because of a severe impact caused by a defect, then Correction is the only option. If the corrective action takes time to implement, because there could be a considerable code change or design change, then Senior management / key stakeholders would not like to wait as till such time, the issue would keep on occurring. So that may result in unhappy customers. There may not be even a preventive action if the corrective action is the only way to prevent it (Say for example if it needs design change to prevent re-occurrence). So as a result, the Correction, which would be a temporary fix predominantly might be used in order to avoid the issue. Say for instance, the correction , could be restart of a server or a bring up an application to live on a daily basis (may be that will make the application down for few minutes – but its still better than when we try to make a corrective action – for which the solution will take time and for this the business impact/customer expectation will be more on the negative side). Hence in this case, Correction is preferred over Corrective and Preventive Action
-
Checksheet It is used to systematically record and compile data from historical sources, or observations as they occur. It can be used to collect data at the location where the data is actually generated, in real time. The type of data can be quantitative or qualitative. Checksheet is one of the seven basic tools of Quality. What it does ? 1. Create an, easy to comprehend data that come from a simple efficient process 2. With every entry , creates a clean picture of facts as opposed to opinions of each team member 3. Standardizes agreement on the definition of each condition or event. How is it done? This can be deemed as a 8-step process: 1. Agree on the definition of events or conditions that are being observed Eg: If we seek root cause for Severity1 defects, then agreement to be made on “Severity1”. 2. Decide on who collects the data (decide the person who will be involved in this activity) 3. Note down the source of the data. Data could be from a sample or an entire population and it can be quantitative or qualitative. 4. Decide on the knowledge level required (for the person who is involved) to collect the data. 5. Decide on the frequency of the data collection (whether data needs to be collected on weekly, hourly, daily, monthly basis....) 6. Decide on the duration of the data collection (how long data should be collected so as to have a meaningful outcome) 7. Construct a check sheet that is simple to use, concise and complete. 8. Have consistency in accumulating the data throughout the collecting period. How can a checksheet look like A checksheet can normally have o Project Name, for which the data is collected o Person (name) who collects the data o Location in which the data is collected o Date on which the data is collected o Any significant identifiers , if applicable o A column portraying the event name o Net total for rows and columns Let us take a sample checksheet for a hospital. Project Name: In-Patient bottlenecks Name: Rajesh R Shift: Night Location : Ward Room Dates: 01-Sep-2017 to 03-Sep-2017 Reasons: Dates Total 01-Sep 02-Sep 03-Sep Patient’s Attire not taken care 1 1 1 3 Beds not available 1 1 1 3 Here ‘Shift’ is the key identifier and ‘Reason’ is the event. Let us take a sample checksheet for a Mainframe batch Project Name: Mainframe Op Name: Rajesh R Shift: Midnight Location : Batch Dates: 09-Apr-2017 to 11-Apr-2017 Reasons: Dates Total 09-Apr 10-Apr 11-Apr Weekday batch failure 1 9 1 11 Weekend batch failure 1 5 6 12 Here mainframe batch jobs fail for batch jobs running on weekdays and also for batch jobs running on the weekend. Future state of Checksheet: The checksheets have become obsolete and has been replaced by Business Process Management software. The software can handle much of complex issues with rather ease. Data can be quickly presented in a easy to view format. So the value of checksheet seems to be diminished out. From a quality perspective, personally i feel, checksheet remains to be as part of the 7 basic tools of quality. For many small companies, which still may not have the BPM software, checksheet would still the go-to-go place. Unless an organisation is well equipped with the nuances of the BPM software or any other tool (which is an alternative to Checksheet), it cannot straight-away jump into those new techniques/tools. I sincerely feel that as a result of this, Checksheet should be followed by may be in modified form by focussing on viewing format, easy at which we collect the data. Conclusion: Checksheet tool is one of the key seven tools of basic of quality tools. With it, we would be able to provide correct data to the processes.Even if it is obsolete, it can be still used by companies which cannot afford to buy advanced BPM software or tools ; or startup companies which are having staff without exposure to BPM / tools and hence they would want to experiment with checksheets to get a feel of things and then work on the tools later on. Hence Checksheet availability is still a must for people to work with.
-
What is a push system ? In a simplistic term, In push, we keep on making items even if they are not needed for immediate consumption. Those excessive items are kept as inventory in the warehouse What is a pull system? In pull, items are made as per the need or in right quantities. As we near the replenishing stage, a visual signal is sent to the relevant department/team to replenish the items as per customer demand. This visual signal is known as Kanban. Whether a push model is needed or a pull-model is needed can be determined by the type of business that we do. Some business might involve both push and pull. Others might have pull-only model. Let us compare and contrast, the key take-away points in using a push model and a pull model S.No Push Pull 1 Store items excessively (overstocking) in a warehouse Store items as needed only 2 Production is forecast driven based on patterns/trends Production is Demand Driven based 3 No WIP limit exists Fixed limit on WIP(Work In Progress) As you can see above, having pull model effectively eliminates storage waste, provide cost efficiency, effective maintenance and so on... Hence you would think that it would be a good option to have with. However, while we can see the advantages of having pull systems in many situations, there are places where it may not be best suited. Case 1: Let us take an example from a Hospital. A hospital should have some basic and essential items in abundance. Some of the items could be bandage, plaster, cotton, syringe bottles, saline bags, gloves, nose masks, footwear bags (plastic/polythene) and so on.... Therefore a storage place is needed to have this inventory of items. Hence a push model is used here. These kind of items need to be in plenty and cannot wait for a patient to arrive at the hospital (read admitted into the hospital), and the hospital staff then buying the essential commodities required for that patient. Therefore a pull model will not do justice here. Case 2: Other cases, where pull model will not work is that when there is a customer demand and as your (pull) process starts working, if the raw materials needed for the system does not meet the pace required to complete the product , by not being available on time, then the pull model will be a failure. Therefore, in a pull model, it is imperative that all the components of the product/system should be in top condition so that it meets the customer demand at the right time. Case 3: In a pull model or Kanban, if the visual signal is complex or not properly elaborated to the employees, then the model would be a failure. Let us take an example to depict this scenario. In a software project, a Kanban board was setup. In every sprint (a standard working duration in days), the team had to do some amount of work. Each backlog item (work to do from a list of items specified by the product owner in a prioritized order) in the sprint was put in the kanban board as follows. The kanban board served as visual representation of how each backlog item taken in the given sprint progresses. To Do Yet to Start In Progress Completed Done The issue with the above board was people joining the project newly were confused with the various terminologies used in the kanban board. They were either new to this agile way of working or were aware of this Kanban methodology or they were freshers coming out of college, knowing only coding. There was no proper education of the kanban board used for the project. Let us understand the meaning of each terminology used in this kanban board. To Do It talks about the backlog items that need to be done. Yet to Start It conveys the items that are not yet started In Progress It conveys the items that are in progress Completed It conveys the items for which coding and unit testing is done DONE It conveys the items which are in completed state and for which system testing is done, acceptance criteria is met, zero sev1/se2 defect and customer signoff obtained and hence in a potentially shippable state. Now, the new joinees and the freshers alike, began to misunderstand the two terms – Completed and DONE. Kanban starts in this project, when each backlog item written in a sticky paper in the “To Do” section moves to the subsequent section or column. While moving through that sequence, the project members repeatedly got confused with “Completed” and “DONE”. Where the coding and unit testing was done, the backlog item ('Flight Status') was wrongly moved to “DONE” because for quite a lot of people they only had waterfall experience and in waterfall, they had been doing only of coding and unit testing. So those people thought “completed” and “done” as same. To Do Yet to Start In Progress Completed DONE Flight Cargo handling Passenger Reservation Flight Status That showed that enough Knowledge Transition was not given to the new joinees (to the project) /freshers ( to the Organisation). This resulted in wrong portrayal of achievement to the customers and this got bombed when the sprint demo (at the end of the sprint-demonstration of what is working) happened with customer UAT team and the customer was livid. Another key factor was that, majority of the team considered “To Do” to take care of functional backlog items only and not non-functional backlog items. This was incorrect as the Sprint would consider all items that were picked up during Sprint planning session. As we can see here, Kanban signal if not properly elaborated or too complex, can be a failure Conclusion: Thus we can say that pull system is not suitable in certain cases /scenarios.
-
-
What is Hypothesis Testing: To determine if the observed differences in the given samples are due to random chance or due to true differences in the samples, through statistical means When it's used and why it is important: Hypothesis Testing is used in the analyze phase of an improvement project (DMAIC). It is extremely important and helps in making business decisions through statistical means. Let us see how it's achieved. As we see from the equation, Y=f(x), vital factors that would impact the outcome, need to be scrutinized. There may be some instances where tools like Pareto chart might be able to highlight which of these factors are important. But sometimes these tools may not be able to determine the vital factors which can affect the outcome. This is where Hypothesis testing comes into the picture. With hypothesis testing, we would be able to highlight the vital factors with relative ease. Also with it, we would be able to tell statistically which can lend support to your business decisions. Let us speak with an example: To find the mileage of a car, we have a null hypothesis (H0) which says that tyre pressure, fuel and speed determine the car mileage. Let us do a Design of Experiment (DOE) for this. Car Mileage: Factors Tyre Pressure Fuel Speed Factor1 20~25 psi Gasoline/Diesel 40~50 km/hr Factor2 30~35 psi Gasoline/Diesel 50~60 km/hr Factor3 30~35 psi Gasoline/Diesel 40~50 km/hr Factor4 30~35 psi Gasoline/Diesel 60~70 km/hr It is observed that factor3 (in bold) serves the optimal value for the mileage of a car. Therefore, our null hypothesis of tyre pressure, fuel and speed determine the car mileage. There may be instances where even when a hypothesis is proven true, it may not statistically add much difference, but which can lend support to business decisions. Conclusion: Thus we can see how important is hypothesis testing.
-
Let us have the 4 interpretations as each case. Before that let us see the definition of Poka-yoke Poka-Yoke means mistake-proofing. It basically tries to eliminate the error that can be induced by an operator (user) Case 1 : The human error will not happen at all Eg: Take the case of 3-pin plug. It cannot fit into any other socket other than a 3-pin hole. This serves as a best poka-yoke mechanism Case 2 : Human error may continue to happen but the defect will not happen There cannot be any process or system in the world which can be defect free irrespective of whether human error happens or not. In this case, if human error happens, then defect is bound to come. So this case is not valid when dealing with Poka-yoke Case 3: Human error may happen, the defect is less likely to happen Consider a measuring jar – say for instance, a feeding bottle of a child. Here, the feeding bottle serves as the Poka-Yoke tool. Person using it, might by mistake put more milk occasionally due to lapse of concentration or by oversight, but in general, because of the measuring unit, the chance for that mistake is very limited. Case 4 : Human error may happen, the defect will also happen but will be detected and corrected automatically Eg: In Mobile packing, this situation (case 4) can occur. There can be set of accessories that may come as part of a box and weighing 300 grams cumulative. Each of this box would be weighed at the as part of the mobile packing process. There is a chance that few accessories might not be placed in the box and hence the weight (in grams) might be less than 300 grams. There may also be chances where extra accessories might be accidentally placed on the box resulting in more weight (in grams) added to the box. Both these errors can be corrected with the weighing machine in place at final stage of the production process. So the missing item or extra items can be detected and corrected. Conclusion: Case 1, Case 3, Case 4 are correct interpretations. Case 2 is not a valid interpretation.
-
In Business Excellence, false alarm and a missed alert are two aspects that need focus. Missed Alert would be the key aspect for Business Excellence. However false alarm might have some impact in industries such as healthcare, finance, insurance. Reduction of false alarm will improve the motive of striving for Business Excellence. While a missed alert would mean probably a missed Service Level Agreement (SLA) resulting in a probable customer dissatisfaction or customer penalty for breach of SLA and which can also business growth, false alarm would create unnecessary panic to the relevant stakeholders and put stress on individuals, in some cases. The objective should be to reduce the false alarms, as much as possible. Let us see how this can happen, starting from the definitions followed by some examples Alarm: An alarm is basically set to ensure that in case of any unwarranted events/steps that arise out or if there is a deviation from the standard process/routine/procedure, then it can notify the relevant stakeholders by sending a signal or sound to induce any manual intervention or necessitate any sort of automated processing actions, to resurrect things back to normalcy. Eg: Fire alarm in buildings Different ways of Triggering Alarms: In many cases, alarm triggering can happen in 3 ways – on real conditions, for alarm drill purpose and false alarm. While we can schedule alarm for drill purpose, in real situation and false alarm, we cannot predict when the alarms might trigger. Example 1 Consider Fire alarms in buildings. Alarm can get triggered if there is a fire that catches the building. The smoke/heat detector in the office premises can catch hold of the fire and the alarm will get triggered. This is in a real time scenario. But there can be a planned mock fire drill, which can be used to assess how strong is the process for human beings to survive from the clutches of the fire. But there can be a false alarm which could have happened because the smoke detector malfunctioned or the alarm system or the communication system to the alarm malfunctioned. Example 2: Consider the case of water level in a dam. Because of incessant rains, the level of the water has almost reached to the optimal level beyond which the government authorities have to release it. In this case, the real time scenario is the only way of triggering the alarm. Mocking/Mimicking of the situation can be done with a simulation effect but there is no room for false alarm here False alarm: A false alarm is one in which all the sequence of steps followed in an alarm are followed , except for the fact that rather than happening naturally it is triggered because of either a human error, or a malfunctioning system error (hardware/software) or communication error between disparate systems or a combination of all these errors. Now again the considering fire drill alarm example, we can see many instances, there could be a false alarm due to any of the above combinations. All we think about is the momentary anxiety and the relief we get after it becomes a hoax alarm. But it does give a thought about as how far our alarm system is that. How naturally we acted upon and how was our self-discipline during those momentary period. False alarm serves as a blessing in disguise in that you feel that it is real but the impact is not there. But many a time, organisations quickly announce that false alarm was made and hence employees return to their normal work place in no time. So to simulate real time situation, organisations on a periodic schedule, conduct mock drills (in this case fire drills) but without any intimation (to the staffs/employees) and see how the people part/process respond to that. During Fire drills (usage of fire alarm systems), say there could be a guidance that in 2 minutes, all the people in a 8-floor building should come down to the designated point at a ground level using Emergency Exit doors (by foot-steps) . Normally mock drills, will operate in false alarm mode. Instead of accidentally fire catching up the office floor(s), a lighting of a cigarette or lit up of a match stick could be purposefully done to trigger the smoke/heat detector, which can inject the fire alarm system. This is an indirect false alarm system as it is an induced alarm system but used for finding out the effectiveness of the system. Missed Alert An alert in a business environment, means that a notification message would be sent from the system (product/service/application) to the stakeholders (it could be sent to an individual customer, or to any mgmt key stakeholders of the customer company or any other relevant stakeholder), in most cases on a scheduled time. In some cases, alert could occur on a conditional basis. It can happen in the event of some other activities/process(es) happening If the service providing organisation does not produce the alert or delays the alert or misses the alert or reacting to it , for whatever reasons, then it becomes an alert which is missed out. This directly leads to breaching of SLAs and potential loss of customer if it keeps happening and a dissatisfied customer. Eg:1 Banking Domain: Suppose ABC Company is the service provider for a banking customer In the banking application, created by ABC, alert text messages would be sent to the bank manager which can tell him/her some facts about the due date status for ‘home loan interest’ of the bank customers at the beginning of each month or just 2-3 days before the actual due date for a bank customer(end-user) . With this alert, the bank manager would know how much loan amount needs to come to the bank on a routine basis. In case, if the alert is missed , then the bank manager will not know the loan amount the bank should get for that period and this can result in heavy loss for him/her, in terms of planning for any other monetary work. The manager would get irate and this can lead to his/her dissatisfaction at the service provided by ABC Company. This has to be rectified quickly and avoided in the future, so that ABC company does not jeopardize its business with the bank. So missing an alert can make you breach the SLA, which can result in customer dissatisfaction and a possible business loss, if this continues in the longer run. This will be the case in any industry. For instance, if you take a healthcare industry, missed alert cannot be there. If a patient’s hear-beat is monitored, then all the programmed alerts should happen and no alert (meant to the Doctors and Nurses) should be missed out. If any notification message is missed out by the service provider, it will not help the doctors and the patient (end-user) will suffer. Here Missed SLA is costly and will affect the human being. So avoiding ‘Missed’ alert scenario is of paramount importance when we strive for business excellence. However in some circumstances or in rare cases, focus should also be given to false alarm. Why False Alarm is important in Few cases: Let us take healthcare industries. Assume a person is put in observation for a probable disease of specific nature and the patient is being monitored for that illness. The patient is undergoing various procedures, blood pressure, sugar test, urine test and other routine procedures. Now when all these things are fed to a system and if one of these happen to be at a level lower than the normal level, then an alarm(signal) is triggered (read automated) which in turns sends some processing instructions , one of which could be a report to the chief doctor. But imagine that there was a processing error (human) while doing one of these procedures or while collecting the data, there was a momentary glitch in the system and the alarm system did not capture all its collected data properly. Because of this, a false alarm signal went and Chief doctor got a report. What if erroneous data had been there in that report about the Sugar levels or what if all the data were right but just due to some other factor the alarm got triggered . If the report contains incorrect data (sample) , then the patient may be told about his/her problems and that could lead to wrong dosages given to him/her. The patient could get emotionally stressed out and this can lead to some other medical problems. So its imperative that in industries/domains such as healthcare, false alarm should be reduced to achieve the motto of business excellence. Conclusion: Thus , we can see how Missed alert impacts Business Excellence and also understand how reducing false alarm can help you in your objective of striving for business excellence in industries like healthcare
-
Wiki definition of Takt Time: Takt time states that it is the average time between the start of production of one unit and the start of production of the next unit, when these production starts are set to match the rate of customer demand. For instance, if a customer wants 20 units of a processing unit per week, then for the entire week (of 40 hrs) and on a steady flow through the production line, average time between production starts should be 2 hrs (40/20) , yielding 20 units per week. A misleading idea or thought that is being though upon is that Takt time is actually the time taken to create the product which is not the case. This means completion of the product can even take more time but the takt time remains as 2 hrs. To summarize this, assuming a product is made one unit at a time at a constant rate during the net available work time, the takt time is the amount of time that must elapse between two consecutive unit completions in order to meet the demand. Takt Origin: Takt is a derived word from the Japanese word of Takutotaimu. This word itself came from the German word of “Taktzeit”. It literally means pace or rhythm. In Lean Manufacturing, this word is used to depict the fact that it is the heartbeat or drumbeat of production Takt Formula: Takt time (T) = Available work time (TA)/customer demand rate (DR) Available work time (TA) = work time per period; Customer Demand Rate (DR) = Units required per period Takt Explanation with an example: Takt time, along with production rates can be used to analyze the bottle necks, processing loads and excess capacity. With this, we can find out the processing units that are ahead or behind the demand rate that can lead to improvement of processes for meeting the customer demand Let us consider a Fast Moving Consumer Goods (FMCG) product produced by ABCMac Company. Assuming there are 2 different ways to create the product. 2 shifts are used in each day for process 1 and 3 shifts are used in each day for process 2. Process 1 way of making the product is used for European customers and process 2 way is used to woo the customers from Asia pacific region Let us now try to calculate the takt time for the 1st processing way Available Work Time = Total work time available / day – (lunch time + tea breaks + Shift breaks* + meetings* +review time*+ maintenance period*) * - Wherever applicable Note1: Shift break can come when a process runs throughout the day cutting across shifts. Note2: In general, the takt time can be measured either in seconds, minutes, hours, day, week.. But the unit measured in both the factors, available work time and customer demand rate should be same. Process 1 : Measuring Unit = seconds. Customer Demand rate = 30000 parts/day (need of the customer) Total time available (consider only 2 shifts)/day (in seconds) = 16 hrs = 960 minutes (16*60) = 57600 seconds (960 * 60) Assuming the following time are spent by the employees Lunch break=25 min = 1500 seconds (=25*60) Tea break=10 min = 600 seconds (=10*60) Shift break=15 min = 900 seconds (=15*60) Review time=10 min = 600 seconds (=10*60); Now Available work time= (Total time available/day) – (Lunch Break + Tea break + Shift Break + Review Time) = 57600 – (1500+600+900+600) = 54000 Seconds Therefore, Available work time = 54000 seconds Now, Takt time = (54000 sec/day) / (30000 parts/day) = 1.8 parts /sec Let us consider the 2nd process Process 2 Measuring Unit = seconds. Customer Demand rate = 35000 parts/day (need of the customer) Total time available (3 shifts)/day (in seconds) = 24 hrs = 1440 minutes (24*60) = 86400 seconds (1440 * 60) Assuming the following time are spent by the employees Lunch break=30 min = 1800 seconds (=30*60) Tea break=10 min = 600 seconds (=10*60) Shift break=20 min = 1200 seconds (=20*60) Review time=15 = 900 seconds (=15*60); Now Available work time= (Total time available/day) – (Lunch Break + Tea break + Shift Break + Review Time) = 86400 – (1800+600+1200+900) = 86400 - 4500 = 82800 Seconds Therefore, Available work time = 81900 seconds The Takt time = (81900 seconds/day)/(35000 parts / day) = 2.34 seconds/part Note that the Takt time of the 2 processes vary even though they are used for the creation of the same product. The 2nd process is primarily different from the 1st process in that it operates in 3 shifts and also it does have different raw materials (ingredients) while making the parts, catering to the specific market needs (to meet to the customer needs and demand). Apart from that, the lunch time, shift break, review time periods differ. So there is takt time difference which is quite ok. Takt Benefits Takt Constraints Trouble points or bottlenecks can be easily identified Takt time reduction due to higher or increased customer demand will result in some activities getting restructured or re-shaped Only time to perform the value added activities are calculated and therefore it urges non-value added activities to be eliminated Reduced Takt time can make the existing process vulnerable (and therefore changing to the new process) putting so much pressure – a). To the mechanical parts b). Mental stress to employees (to meet to the new process changes or to the work needs) As bottlenecks are found out, it provides opportunities for improvement. Adapting to the new process (to a great extent) to meet changed customer demand (if it is too taxing) should be done very quickly to sustain the business successfully and to avoid customer dissatisfaction on using that product. Production schedule Planning can be done well as you know shift requirements and production needs There will be fewer errors as because of planned production schedule, there will be no hurry to do things What kind of decisions the Takt time drives? Takt time drives tactical decision in general. But however there can be few and rare cases, where it can drive strategic decision. How Takt time impacts Tactical decisions: In a multi-component product, time taken for processing of 1 part could have an impact for another part. If there is a delay in the processing of one of these parts, it could delay the overall takt time of the product. Therefore, takt time value could decide the design choice for assembly line. To meet to the customer demand, assume a particular processing unit/component needs to be processed quickly. To improve that particular processing unit/component in a product, there can be automation to increase the processing speed which will result in a reduced takt time. So there is a conscious decision to improve the processing speed, with automation and thereby ensuring customer demand is met. How Takt time impacts Strategic decisions: If a company (read Senior mgmt/Key stakeholders) wants to catch hold of a market (read geographical region or specific sector of an industry), so as to get an immediate advantage Suppose the company has reached out to the ASIA-Pacific for the 1st time and they have an important client. As we saw in our example earlier, there can be 2 shifts /day for one region (Europe) and 3 shifts per day. The 3 shifts, for instance, could be meant to satisfy the important customer. That will be a potential opportunity to get a foot hold into the niche market available in that particular region. This could be till a short time or could be a long time depending upon the company’s ability to sustain this for a longer time but the gains would be to have a benefit in the longer run.
-
Central Limit Theorem: It states that when sample size tends to infinity, the sample mean will be normally distributed. Expanding this with a standard wiki definition “Central limit theorem, establishes that, in most situations, when independent random variables are added, their properly normalized sum tends toward a normal distribution (a bell curve) even if the original variables themselves are not normally distributed” Law of Large Numbers: It states that when sample size tends to infinity, the sample mean equals to population mean. Put in other words, when the quantity/size of the identically distributed, randomly generated variables increases, their sample mean (average) equals the population mean Difference Between Central Limit Theorem and Law of Large numbers : Central Limit Theorem Law of Large Numbers When sample size increases then the sample mean will be normally distributed When sample size increases, the sample mean equals the population mean. It normally takes a size of over 30, for the distribution to become a normal distribution There is no specification for minimal size for this to be realised The theorem talks about the shape of the distribution The theorem talks about the centre point of the bell shaped curve Why should we not always make use of Central Limit Theorem (CLT) and get rid of Non-Normal data? 1. There may be a scenarios where getting a considerable sample size (good enough to do) may not be prevalent for doing normal distribution 2. Also one will not know whether the sample size is “large enough” to have normalisation. How large is that? In order to understand that the required sample size varies for different sorts of data, simulations are the way to go which will reflect the kind of data that is being used
-
FTA What is Fault Tree Analysis? Where do you think it is most effective and in what circumstances is it likely to be least useful? Background: Fault Tree Analysis (FTA) introduced by BellLaboratories,are prevalently used in the fields of Reliability and Safety Engineering Fault Tree Analysis: As the name itself implies, this technique talks about the analysis of a failure or fault Why its called Fault Tree: The technique uses a top-down approach to analyze the potential reasons (causes) for the failure by stepping through a serious of steps logically. To explain more on this, a general conclusion /an undesirable state called an event (top event), is made at the beginning (at the top) of the analysis, followed by specific causes that lead to the conclusion/undesirable state, by developing a logic diagram. In other words, a visual representation of a system showing the logical relationship between the events and the causes that leads to the failure is created Purpose of FTA: 1. To help identify potential causes of system failure before the failures actually happen. 2. Additionally, probability (of the occurrence) of the top event or the undesired state can be measured either statistically or analytically How does it work? 1. Two types of basic diagrammatic notations: Events and logic gates 2. Primary or basic event(s) is/are depicted with a circle. 3. The symbols used in the logic diagram are called logicgates , much akin to the symbols used in Digital Electronics 4. AND Gate, OR gate, Exclusive OR gate(XOR) are the primary logic gates used 5. The logic gates describe the Boolean relationships between the various event outcomes Logic Gates: 1. 1. ‘OR’ Gate: Given two or multiple causes (events) that could lead to a failure (top event), the failure can happen even if any one of the causes (events) occurs. Truth Table: Determines the outcome of the various input combinations either as true or false represented by ‘1’ and ‘0’ respectively Cause 1 (Input A) Cause 2 (Input Outcome Formula =A+B 0 0 0 0 1 1 1 0 1 1 1 1 So the table implies that for the failure /event at higher level to happen, one cause (input in the above table) is suffice 2. 2. ‘AND’ Gate: Given multiple causes (events) that could lead to a failure (top event), the failure can happen if and only if all the causes (events) occurs. Cause 1 (Input A) Cause 2 (Input Outcome (Formula =A.B) 0 0 0 0 1 0 1 0 0 1 1 1 As the table shows, the failure/event at higher level happens , only if the 2 causes occur. In case of multiple inputs, then all have to occur. 3 3. ‘Exclusive OR’ (XOR) Gate: Given multiple causes (events) that could lead to a failure, the failure can happen if and if only one cause (event) occurs. Cause 1 (Input A) Cause 2 (Input Outcome Formula = A.(~B)+ (~A). B 0 0 0 0 1 1 1 0 1 1 1 0 How does the formula work: ~ àgives the inverse of the condition. If ‘A’ =0, then ~A=1 So the table implies that for the failure /event at a higher level to happen, only one can be a cause at a given time. How is it different from other techniques such as Fishbone or 5-Whys: While those techniques do a failure analysis on the damage or problem has occurred, FTA does identify potential causes for a failure to happen Essential Steps of FTA: 1. Define the undesirable state (top event) – the failure, for which the analysis is being done 2. Drill down the immediate causes (which will become events if further break-down is possible) for the undesirable state(top event) 3. Repeat # 2 until no further drill-down is not possible which means the most basic causes are found out 4. Develop the fault tree diagram based on the above steps 5. Do the evaluation of the developed FTA as what needs to be done 6. Take necessary actions post the evaluation to avoid the failure and potential risks and make your system fool-proof Benefits of FTA: 1. It prioritizes issues, the fixes of which can address the failure 2. It acts as a base for future analysis 3. It highlights the existing design flaws cum errors. 4. Provides a simple and self-explanatory view of the causes for the failure (in a tree structure) Industries where FTA is very much useful FTA is useful in industries where failure can have severe impacts/consequences. Some of the industries where FTA can be very useful are: a). Nuclear Power b). Aeronautics c). Healthcare d). Mission Critical Systems across industries e). Debugging Complex systems in Software Engineering, f). Space Programmes Eg: Circumstances where FTA is least useful: 1. Where probability of failures happening is known to be very less 2. Where the impact/severity of failure is minimal or not relevant

-
Value Add: In general, ‘Value Add’ means changing the shape or character of the product. It is the apparent transformation of the item in a process. Anything that is not changing the shape or character of the product is deemed as non-value added activity. For anything deemed as ‘Value Add’, the customer should be willing to pay for it and it should help us in achieving/providing first-time right quality. So essentially a value adding activity will use the 3 checks of a). Whether the customer is willing to pay b). Whether it is transformational by nature c). Whether is done first time right However there is one more aspect called ’Value Enablers’. They enable in ensuring that your ‘Value Add’ activities are doing their jobs smoothly. This can make a difference to success/failure in quite a few scenarios. Let me demonstrate with an example. ABC Organisation was doing a IT development project. Customer wanted Quality Assurance to be done by a different vendor. So the customers gave it to QuoxProComp, a leading company in Quality Management . How the Process looked like before Value Add was applied: AS-IS Process: The AS-IS process created issues because there were many defects captured by the vendor QuoxProComp. Customer was very much upset with the poor quality both in SIT and in UAT where customer also did testing and also the reputation of ABC organisation was at stake. In the AS-IS Process, the activity “Rework” is a non-value added activity and customer did not want rework to happen and hence he did not pay for that. So its shown in RED colour. The Green shaded activities are value added activities for which customer agreed to pay. The organisation asked the project team to brainstorm on the reasons for so many defects and to come out with proper solutions.Reasons were obvious: a). For a project of such strategic importance , the team could not do a comprehensive Unit testing. As a result , there were so many requirement conditions/validations that got missed out . b). Certain functionality worked in local box (developer’s machine) , but did not work properly in target environments . That was due to few parameters that needed to be changed before the codes were deployed in those environments. As a result, build scripts have to be manually modified. Otherwise some functionalities were not working as expected. But they were raised as defects by the QA team, which should not have been the case as those parameter changes were done earlier. So to counter those 2 problems, the project team came up with some solutions and decided to implement them as value added activities which they felt would naturally fit into. As a value-add, the project team, a) Converted Unit Testing into an automated unit testing b). Upgraded its build script such that the updated build scripts eliminated manual intervention when codes got deployed from one environment (Local box to SIT/ST, SIT /ST to UAT and UAT to Production) Let us see how the process output changes after applying few Value-added activities:. If you look at the TO-BE process, activities with * (asterisk) symbol are the 3 value adds done on top of the existing activities. In spite of adding value adds, there is still a Non-value add activity in the form of “Rework” . Does that mean those value adds are not suffice? The answer is yes. The value add brought relief to the project team and the organisation in that, there were less defects and customer was not happy but acknowledged the fact the team is putting efforts to reduce the defects. This time the results were not centred on validations/conditions or any environment related issues. There were functional defects that bothered them (project members). The team could think of scenarios only from a developer ‘s point of view. The management understood the pain point of the team and thought that the team needed different pairs of eyes to test the code. So they decided to go for a Quality Assurance team, internal to the organisation. Its job was to test the application in a local server (machine where an Enterprise application server was installed rather than a standalone server) –which could mimic the SIT/ST environment and raise as many valid defects as possible so that the developers can fix those defects before the SIT/ST date starts . This was implemented. The process diagram post the change looked like this. Improved Process that includes Value Enabling Activity: Here in this process, there were no non-value added items, however there were 3 value enabling activities which were internal to the organisation and for which the customer did not pay. What did these 3 activities bring to the table? The Internal QA team of the ABC organisation did the functional testing and gave a feedback of the system to the developers. This was a welcome change for the project team and based on their feedback, the project team (read development) started to have a different perception of the system that they were working on. This had a positive impact on the quality of the code developed. So all these extra steps of having a local server, deploying the source into the local server and QA done by an internal team resulted in a quality code delivered by the project team as the team got more and more feedback from the internal QA team of the organisation. This reflected in the SIT/ST testing as well for subsequent phases and the rework effort was within the SLA agreed with the customer, keeping in line with the dictum “no product would be 100 % defect-free “ . In UAT also, there were only cosmetic defects/changes that were needed. This resulted in high customer satisfaction and the management team felt that the project was on track and was a relieved team. The key takeaway point here is that the value enabler activities did the job for the team. Customer did not ask for those activities but they were necessary for the project to do the phase-wise delivery with high quality and on time. This is the reason why i feel , that apart from focusing on the 3 check conditions for making an activity as a Value Add , we also need to see if there are Value Enablers which can ensure that they add support to the smooth functioning of the work expected from the Value add activity. This may not be in every case, but like the above example , there could be some cases. Else , getting the first time right may only be a dream.


-
What is 5S ? 5S is a workplace organisation method. It consists of 5 Japanese words listed below along with their English equivalent: Seiri (Sort) Seiton (Straighten/Set in Order) Seiso (Shine) Seiketsu (Standardize) Shitsuke (Sustain) 5S methodology helps a workplace to - remove unnecessary items (Sort) , - organise items to get maximum efficiency and flow (Straighten/Set in Order), - clean the work area so that additional problems can be easily found out (Shine), - lay down colour coding and labels so as to be consistent with the other areas (Standardize) - create an environment that makes the workplace organized in the longer run (Sustain) . While the usage of 5S in manufacturing industry is very much prevalent, as it had its origin through the manufacturing industry, it is very much useful in other industries. Let us see some examples as where 5S can be used: Healthcare: 5S can play a quick critical role in Hospitals. Let us quickly see how Zambara hospital was there before 5S was applied and how it got transformed after 5S was transformed. Before 5S: After the physician left visiting his/her, the disposable items were not sorted out and put into the different type of waste bins available. Moreover whenever the in-patients needed new patient robes or new bedsheets, they were not able to get them on time as ward attenders searched for those items to retrieve. Also when the nurses were finding it difficult to get the right medicinal items in the stock room as the items were in total disarray more often than not. As a result, the nurses were struggling to know how much quantity of gloves, drips tubes, Syringe bottles etc.., are there as a stock. Also Sterilization was not done in the in-patient wards section and even there was no pleasant environment. Some of the In-patients insisted that they be given new medicinal dose as they felt uncomfortable after seeing the medicinal items that they were to be given. These things were a key factor in terms of the safety aspect. Now let us see how each stage of 5S was done. Sort: All disposable items were removed out quickly, after the physician did his/her work. This means that unnecessary items did not occupy space. This improved the free movement of materials/people movement. Set In Order: Ward section where in-patients are housed at, had set of gloves, drips tubes, syringe bottles which were all placed in one bin. The other bin had patients’ robes, bedsheets. The ward had specific signs, labelling, pictures related to each of the bins so that the ward attenders/sisters (nurses) or any one authorised to take can retrieve the items quickly. The bins conveyed clearly as what are the items and how much are there in each items. Because it portrayed the correct picture, it eliminated the need for excessive stock and thereby the reduced cost in buying/purchasing items.As timely retrieval of items happened, they were provided to the patients at a faster pace, resulting in quality service and high customer care as well. Shine: Cleaning is very important in hospitals. So Sterilization was done throughout the hospital right from operating theatre to the in-patient room and in the waiting hall for out-patients. The hospital eliminated the non-sterilized medical equipments.. Working Environment had a pleasant odour. Standardize: The hospital setup some standard procedures (Protocols) to maintain and also monitor on the 3 steps of Sort, Set in Order and Shine. The protocols would tell actions (to do these 3 steps on a routine basis) to be done by whom, by when and by how. Sustain: The hospital provided an effective and efficient working environment through the continuous focus on the above mentioned 4 steps. Conclusion: As we can see the above example, because its organised and space effective and also it maintains only necessary stock, 5S methodology can lessen your maintenance cost, reduce your cost of quality as you streamline your processes, reduce your purchasing cost because you will eliminate unnecessary stock and so on.. We can also do 5S in Retail, Hospitality , in Information and Technology and so on.. So we can conclude by saying that 5S can save money even for industries other than manufacturing.
-
Whenever we think/speak of Lean Six Sigma, the first and foremost thing that comes to our mind is eliminate waste and reduce variation!! Though there is nothing wrong about that mindset as so many six sigma projects in the world, do focus on that, there is another sibling of that which can do some interesting things as well.Will talk about that now. In General, Six Sigma can be broadly classified into two DMAIC and DMADV. While DMAIC is to improve an existing process, DMADV is to go for a new process for providing the service or product , because the old process cannot be improved at all or revamping the product/service itself with a new design. The concept is so powerful that there are few variations in DMADV and is there is a separate branch called "DFSS" (Design for Six Sigma). The major variations of DMADV are DMADOV(Define, Measure, Analyse, Design, Optimize, Verify) and IDDOV (Identify, Define, Develop/Design, Optimize, Verify). So much so has been done using these concepts that the modern definition of Lean Six Sigma can be rephrased as a methodology used for business improvement that enriches the shareholder values by providing high-quality product/service at affordable cost with considerable speed on a consistent basis, thereby maximising customer satisfaction I very strongly believe that use of Lean Six Sigma helps us to innovate a product/service or make it supreme. Let me provide an example. Explaining this concept with two imaginary companies. In reality, this happens across in Insurance or for that matter in any other domains. Background: Consider two insurance companies, 'StandIns' and 'TotalIns'. TotalIns was acquired by StandIns. Both the companies had a Policy Claims product, but both were written in different technologies. StandIns used a legacy system (mainframe) for its product 'SIPC' and TotalIns used its own proprietary system for its product 'TIPC'. After acquiring TotalIns , StandIns decided to migrate the 'TIPC' into its product 'SIPC' after some time of acquiring, so that it can provide continuous support to the existing TotalIns customers.Both the products were handling 3 variations/types namely individuals, corporates and other business entities. DFSS, the remedy: Now they decided to add the existing users' data from 'TIPC' product to the 'SIPC' product. This was not easy to migrate the data. Migrating the data from proprietary one to legacy system became cubersome and error-prone. Halfway through that migration project was abadoned. So it was decided that the existing users of 'TIPC' would continue with that product only . The stakeholders were at their wit's end as what could be done. The 'TIPC' product had some good features which 'SIPC' product did not have and the stakeholders at StandIns wanted to utilise them for getting better business growth. The stakeholders of 'SIPC' product felt that with a proper ground work on the needed functionalities and with a strong desgin base, they would be able to provide a high quality product which can bring profitable business, great customer satisfaction, in the longer run. One of the stakeholders who was in the quality department convinced the others stakeholders of doing a Lean Six Sigma project using DMADV(DFSS) to create a new top-notch product which can cater to both 'SIPC' and 'TIPC' customers. It was overwhelmingly approved. Problem Statement : StandIns insurance company has been struggling to migrate all the data of 'TIPC' product into its 'SIPC' product since the Oct 1 2016. All these days 'SIPC' unable to produce customer reports/data properly resulting in extremme customer dissatisfaction and also in a loss of 1 million US $ Goal Statement : Create a high quality product,'SSPC', which caters to both the existing customers of 'SIPC' and 'TIPC'. The new product will also cater to the new customers and the product should be crated by by 17,Aug 2017. How was it done: Following are the steps/activities that were done: 1. Voice of the Customer(VOC) : The stakeholders of the new product thought that focus should be given to the key customers who use 'TIPC' product and that their opinions should be heard. They believed that those customers needs/requirements should be satisfied. Those were captured. 2. The requirements data collected from VOC, was added to the existing list of requirements already available for those two products('SIPC' and 'TIPC') 3. Those captured needs were categorized/affinitized , for brevity so that none of the functionalities are missed out during the product development. For instance, all requirements/needs related to administrative activies, were put under the group "Administation". Needs related to an individual customer were put under "Personal", needs related to a corporate were put under "Corporate" and needs related to other business entities were put under "Business" and so on. 4. All the needs were prioritized with the help of a Kano model. All the must functionalities were highlighted , then satisfactory functionalities were listed out and then the delighting functionalities were drawn out. The objective was to ensure that a minimum viable product (MVP) was achieved at the earliest so that customer dissatisfaction is eliminated right at the outset. 5. Next thing was to find the characteristic through which the success output could be measured. For such a complex sytem which requires two different products to be merged , how could the critical-to-quality(CTQ) be measured ? After much deliberation ,it was decided that CTQ would be a factor called , 'SuccessCode'. A combination of certain parameters decided the fate of the CTQ. They included various fields from the existing 2 products - a).PolicyNumber (for both the products), b).location Code(for existing users of 'TIPC' -needed because both companies were in different regions), c). policystatus, d).isActivepolicy, e). response time (to user's query). 'PolicyNumber' should adhere to the validation rules specified for it. 'Location Code' should be unique and should not be a NAN. 'PolicyStatus' should be either new/renewal and ' isActivePolicy' should be true. 'Response time' should be <=5 seconds.If anyone of this had a discrepancy or throw an error, then 'SuccessCode' would fail with a '0' code , else it will pass with a '1' code. 6. Now the product team/stakeholders decided to have a brainstorming session what are the grey areas where they need to improve their design/technology so that they do not go into the same issues which is why in the first place, this project was started. How to achieve the key parameters/vital X factors which can help to achieve a better product. That was decided 7. The product team decided to go for a Pugh matrix, (named after the person who introduced it - Pugh) which can evaluate multiple options (as a solution to the problem) with various criteria against a baseline option and then allow us to pick the best one. With multiple options, they picked the combination of a web-based system with SpringBatch system, Oracle DB , j2EE . This became the selected option Below was the Pugh matrix used. Baseline Option : Mainframe System – PL/1 Criteria Option1 Option 2 Option 3 Response Time + - - Batch Processing speed + - + Concurrent Processing + S + Effective handling of all CTQ parameters + + - Total 4 -1 0 Option 1 : Uses Java EE with Object Relational Mapping database and SpringBatch Option 2: Uses Jave EE with Relational Database Management Option 3: Uses Mainframe Systems (COBOL) with legacy Database 8. Now the product team developed the product using the selected option (from Pugh), for 'Personal' type (1st variation of the product). 9. The product team loaded all the data for existing users of 'SIPC' and 'TIPC' and got amazed at the speed they were able to see the data for both the users of 'SIPC' and 'TIPC'. The team was able to add new users, seamlessly. Months of pain seemed to be gone in a trance. 10. The product team replicated the development for the remaining two variations for Corporate and Other Business Entities and loaded with data and successfully tested. 11. Product Team had a deployment flowchart and also a checklist that clearly provided how things should be done. There were great celebrations and all the stakeholders and senior management celebrated with great fanfare. 12. A full-fledged Implementation plan was created and on 17th Aug 2017, as scheduled, the product was deployed and it went into live. All the stakeholders were extremely happy. 13. The product team created a list of metrics with which the management can measure the progress of the product's success post its deployment. 14. The product team created a transition plan to the operational team and created a documentation of what was done and how they were done. 15. Three months into the production, because of the product, the StandIns company marginalised its loss that occured earlier and by the end of sixth month, the company had a surplus revenue of 1 million US $. New customers got added and there was so much customer satisfaction and the company's business grew three times. This improvement was possible only because there were tools and techniques which captured data systematically and stastically and using which the team was able to work out with a complete and proper solution. By having well organized and scientifically proven techniques/tools , the team was able to achieve its target in style. There are many other tools and techniques which can be of real use to developing a new product or designing a new product/service. For instance, its worth mentioning about the Quality Function deployment tool which helps your requirements to be converted into design. It essentially converts "What do yo want" to "how do you want" .A sound design will result in a solid product. For instance, you want to create a cage for an animal say Tiger. What would be your requirements. You would want a iron bar with a comfortable space for the tiger just walk a few steps and also ensuring enough height to accomate it. You would want strong doors. How do you convert this into a design requirement. So you would think of Iron bar or rods and you would specify the length and width of the cage (say, in feet). Then you would talk about thickness of the cage, followed by door quality(in which material, its strength ) . Now your design also has to consider the material used for the cage should not be too light. If its too light, then chances are that the Tiger could break it. So while doing design, all factors should be thought about and ensure that a balance is found out. We should know which factor is affecting which other factor and in what way whether in a positive or negative way. Instead of putting an iron cage, what if i put a wooden cage. It may be light weight(thats one factor) but would it be a safety one(Safety is another factor). These kind of analysis can be obtained through QFD which will help us to decide the design considerations which can help us in creating a best product/service. Hence i conclue that with the advent of Lean Six Sigma, product innovation has taken gargantuan proportions
