Dharanesh Mysore
Lean Six Sigma Black Belt
-
Joined
-
Last visited
Everything posted by Dharanesh Mysore
-
Dharanesh Mysore replied to Vishwadeep Khatri's topic in We ask and you answer! The best answer wins!When auditing AI-integrated systems, transparency on how the model works, the security of the data, and whether the prompt logic system is working properly all need to be evaluated. AI systems should be evaluated on whether their decisions are traceable, if there are risks of bias, and if the system meets ethical standards. Examining the sources of the training data, monitoring model drift, and examining output consistency with given prompts constitute critical tasks. Employing accountability-enhancing tools such as explainability mechanisms, inline controls, and collaborative processes bolsters overall accountability. We will ensure proper and responsible use of the systems through regular alignment checks with the overarching business goals.
-
Dharanesh Mysore replied to Vishwadeep Khatri's topic in We ask and you answer! The best answer wins!Excellence roadmaps stress stability, resilience, and sustainable performance. In contrast, AI implementations anchored on rigid prompts, static decision trees, or circumscribed logic can become brittle when conditions in the world around them change. Shifts in user expectations, the introduction of new and unforeseen exceptions, or the slow decay of reference data can degrade effectiveness in ways that first appear only as small, cumulative declines. Below are the signs that an AI is failing to hold its grip: · An increase or sudden spike in incorrect outputs. Particularly when the input variability rises, indicates the underlying logic cannot adapt leads to increased errors. · Responses that mismatched with the latest facts or policies. It leads to determined data drift surfaces when outputs oppose acknowledged truths. · A Disintegration of end user trust and engagement. It is when people aggressively retreat from the interface and confidence is the first loss. · Unpredictable failures in edge cases. Fragile systems mishap when they confront circumstances not exhaustively rehearsed in training. To adopt sustained AI health over the long haul: · Launch a regime of continuous observability. Key performance indicators and usage patterns must be watched in real time to catch decay before it compounds · Training and reference data to be received in periodic and systematic refresh cycles. · Human judgment at critical junctions to be considered. Expert review of high-stakes outputs can recalibrate the model and strengthen decision-making in situations where logic alone risks error. · Opt for adaptable frameworks: Choose modular structures that can be easily reconfigured to meet shifting operational needs over time. · Protect ethical and governance principles: Keep transparency, fairness, and accountability front and center as systems expand and mature. Viewing AI as an ever-evolving asset—rather than a static instrument—guardians its ongoing effectiveness, reliability, and commitment to operational excellence.
-
Dharanesh Mysore replied to Vishwadeep Khatri's topic in We ask and you answer! The best answer wins!Using AI in significant ways that will advantage the business requires an understanding of its true priorities. The business can achieve that by applying the “Value- Feasibility Matrix” decision tool. This framework helps assess the strategic business value AI initiatives take against the cost, data requirements and technical complexity of execution. Before advancing on AI use cases, ask the following questions: “Which business goal or KPI does this solution measure and track?” The above alignment enforces measurable outcomes like boosting customer retention, cutting processing times, or increasing revenues. Filtering out technically interesting but value-add limited initiatives ensures that resources are spent on solutions that work and propel the business forward.
-
Dharanesh Mysore replied to Vishwadeep Khatri's topic in We ask and you answer! The best answer wins!The Swiss Cheese Model serves a purpose when it comes to visualizing how risks intersect with multiple processes in a system's defenses. In the scope of my process, let’s consider the HR onboarding process for illustration; it shows how multiple gaps—often thought of individually—at different stages can lead to a larger systemic failure if not remediated. Let’s consider this situation, ‘slices of cheese’ denotes to layers of security or defense within the onboarding processes which include: Pre-employment verification, Onboarding systems with automation features, Overview of HR policies, Configuration of IT systems for new employees and Review by managers and feedback systems Each layer contains some potential problems, gaps, or ‘holes’ as we may say. A few generalized ones are: Background verification holdups, Errors occurring on documents generated by the system and Communication of policies that are vague or too broad For example, lacking guidance from managers coupled with missing steps in hardware provisioning. When gaps are lined up in these holes, a pathway is created to error such as a new hire who starts without sufficient tools, lacks role clarity about their functions, and holds unclear ideas regarding the benefits processes. Grasping this form of risk alignment facilitates using strategies such as rigorous process mapping, continuous improvement practices (Kaizen), and root cause analysis to improve any gaps. Gaps can be narrowed by predicting where the most issues will arise, addressing them in a methodical manner, shoring up controls, or bolstering existing ones, improving process dependability and the employee experience simultaneously. This posture actively encourages proactivity. Instead of responding to issues, we seek to understand how problems can arise and take measures to eliminate those possibilities, achieving greater improvement in both service delivery and quality.
-
Dharanesh Mysore replied to Vishwadeep Khatri's topic in We ask and you answer! The best answer wins!Controlling Change in DMAIC: An Essential Success Factor Appropriate change management guarantees that any improvement is embraced, implemented, and maintained appropriately and DMAIC phases are depend on change management: 1. Define - Earning Support Engagement with stakeholders marks the beginning of their alignment and ownership. Resistance is minimized when the "why" of a project is communicated well. For example: In a hospital discharge project, doctors and nurse participation was solicited early on to align and ease s about workflow changes. 2. Measure - Establishing Trust Fear of data collection is real. Data collection participation can be enhanced through trust that volunteers will not be punished. For example: In one manufacturing project, operators assisted in data collection because they were assured that the objective was process not performance. 3. Analyze - Owning Accountability Insight accuracy is improved when teams are engaged in work ownership and root cause analysis. Example: A loan processing team helped reconstruct existing policy gaps, which improved prompt processing of loans by devising more relevant strategies. 4. Improve – Changing Slowly Stakeholder confidence is nurtured and resistance lowered when they are allowed to test the provided feedback. For example: Attitudes shifted from skepticism to support with automated workloads demonstrated by helpdesk IT pilots. 5. Control – Sustaining Results Reinforced behaviors are necessary for lasting change. This can be achieved through proper training, dashboards, and sufficient leadership backing. Example: A call center project embedded changes into daily operations through the use of daily huddles and visual metrics. Role of the MBB: The Master Black Belt integrates the necessary technical detail with human acceptance and key responsibilities are: 1. Resolving issues for the supervising teams. 2. Landing leadership sponsorship. 3. Accountability and control gaps. 4. Practical steps for complex changes. Example: An MBB created standard visual boards for several departments which enhanced inter-departmental transparency as well as momentum during enterprise-wide efforts. In Summary: Solutions need change management to achieve desired results. Best improvements are rendered useless in the absence of change management. The MBB is the change catalyst who guarantees the delivery of changes while ensuring acceptance and sustainability.
-
Dharanesh Mysore replied to Vishwadeep Khatri's topic in We ask and you answer! The best answer wins!During the Control phase of improvement processes like Six Sigma, it is quite common to observe that initial benefits tend to plateau over time. This often occurs when changes are not fully integrated into routines, people revert to old habits, or lack of continual analysis, ambiguous process stewardship, or unanticipated changes in business environment factors. To address the issue and ensure the improvements are long running, below are the set of actions and strategies to implement: 1) Control Charts – To track progress towards your goals and alert you of any breaches within set thresholds promptly and most impactful monitoring tools 2) Standard Operating Procedures (SOPs) – These create uniformity and standardization through documenting framework which helps in divergent process describe and communicate step accurately. 3) Training and Communications – training impacts compliance vastly if every team member understands the why and what behind changes, while strong communications support the adherence effort. 4) Process Owners and Accountability – clear assignments of roles ensure responsibility for monitoring, maintaining, and enforcing the change lie with someone. 5) Audits and Regular Reviews – Scheduled checks provide not only compliance with the processes, but also an opportunity to provide timely adjustments as needed 6) Visual Management Tools – Dashboards or scorecards make it easy to see the process is still performing as expected or not. Eventually, the key is to make the improved process part of the organization's culture and daily habits.
-
Dharanesh Mysore replied to Vishwadeep Khatri's topic in We ask and you answer! The best answer wins!To make sure an AI solution grows with ongoing process enhancements, we need to think of it as a living part of the improvement system—not just a one-time setup. This starts by putting AI into the same feedback loops that power Business Excellence, like PDCA, DMAIC, and A3. The main objective is to create a continuous learning system from which the insight collected from the process modifications is leveraged to refine the AI system. Ways to adopt AI to advance improvement 1) AI integration at the operational level: a) Integrate AI in prevailing improvement cycles like PDCA, DMAIC and A3 for implementation b) Adopt MLOps tools to retrain AI after process modifications c) Align process review periods with AI update implementations 2) Clear Feedback System: a) Record improvement data like KPIs and root causes in organized ways b) Enable checks to spot model drift or performance gaps c) Start model updates when real-world results don't match up 3) MBBs key role: a) MBBs to act as mediators for process owners and data science teams b) Define goals for both process and AI success c) Make sure AI models shows the latest process standards and improvements AI can evolve with continuous improvement if it's designed to learn continuously. This requires automated feedback mechanisms, structured data from improvement initiatives, and strategic leadership from MBBs to ensure alignment and sustainability.
-
Dharanesh Mysore replied to Vishwadeep Khatri's topic in We ask and you answer! The best answer wins!AI solution solving the wrong problem is due to the failure of managing the scope correctly. It delivers results that is irrelevant or misleading, wasting time, resources and poor decision-making. Hence, defining issues accurately is essential. For instance, a bank that utilizes AI to predict which customers shut their accounts. The AI spots those customers with accuracy, but the fix doesn't cut down on customer loss. Because the real issue was not about identifying who would leave the bank, it was getting to the bottom of why they were going and how to keep them around? When determining the problem, ask who will be departing instead of asking why they are departing and how we can keep them. AI answers might be spot-on, but they don't help the company achieve its true aim. The main cause gets missed, so any steps taken based on what the AI predicts don't deal with the actual problem. MBBs can play a crucial role by: 1. Asking the right question and probing, Are we dealing with the actual problem? 2. Using root cause techniques such as 5 Whys and Fishbone diagrams to examine more before rushing into AI modeling 3. Setting clear success criteria and focusing on results like keeping customers instead of just how well forecasts work MBBs ensure that AI solutions are both technically correct and practical by helping teams frame problems correctly.
-
Dharanesh Mysore replied to Vishwadeep Khatri's topic in We ask and you answer! The best answer wins!In today's AI-driven world, the traditional metrics like cost efficiency and average handling time are bit outdated. Many legacy metrics were created for manual workflows and don’t capture the evolving role of AI. Considering the capabilities of automation and its capacity to handle multiple tasks at a time, these old measures frequently miss the mark when it comes to identifying the strategic value that AI yield to business outcomes. Now it is time for organizations to adopt metrics that focus on trust, agility, and how well humans and AI work together in real time and accept indicators like AI Decision Accuracy and the Human-AI Collaboration Index which provide a better understanding of performance. We need to shift organizations performance metrics from just measuring how competent processes run to assessing intelligence, adaptability and innovation which is very much essential to truly be equipped for AI. Also, AI-enabled organizations should be cautious and watch over factors like model drift, ethical alignment, impact of decisions and the systems being evaluated on their ability to learn and adopt for creating excellence that is much required for success.
-
Dharanesh Mysore replied to Vishwadeep Khatri's topic in We ask and you answer! The best answer wins!Effective solutions can be created by Lean Six Sigma MBBs and AI teams by bring into line the business goals and combining structured problem-solving with data-driven insights. Lean Six Sigma MBBs add value by defining the scope and improve processes using DMAIC and other process improvement methodologies, whereas AI improves these with predictive insights and automations and deeper root cause understanding. Collaboration of both Lean Six Sigma MBBs and AI teams ensures effective hybrid solutions that improves process efficiency and intelligence. MBBs and AI teams collaboration contributes to: 1) Better data-driven decision making can be enabled by using AI insights on frequent patterns of concern related and to make more informed decisions based on the data collected by Lean MBBs and prioritize the areas of improvement by identifying process inefficiencies and root causes of problems 2) Optimize the process by automating repetitive tasks identified by the Lean MBBs to reduce variability, eliminate waste and streamline processes 3) Improved Efficiency, Workflow and Productivity through automation based on process inefficiencies identified by MBBs 4) Enhanced Customer Experience by understanding customer needs, delivering value, offer personalize experiences and predict future needs using AI
-
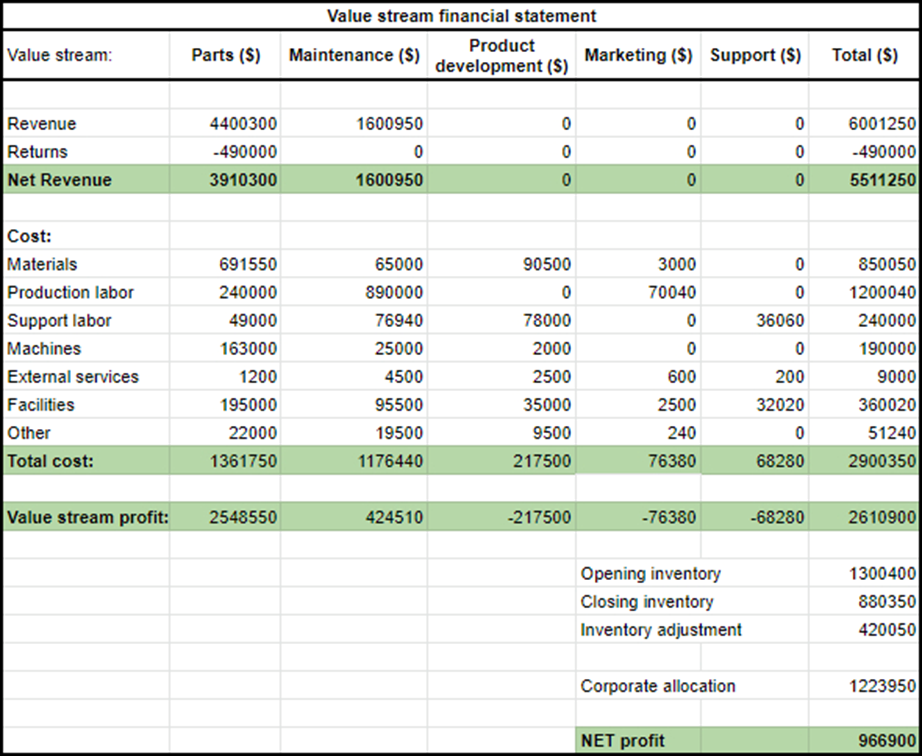
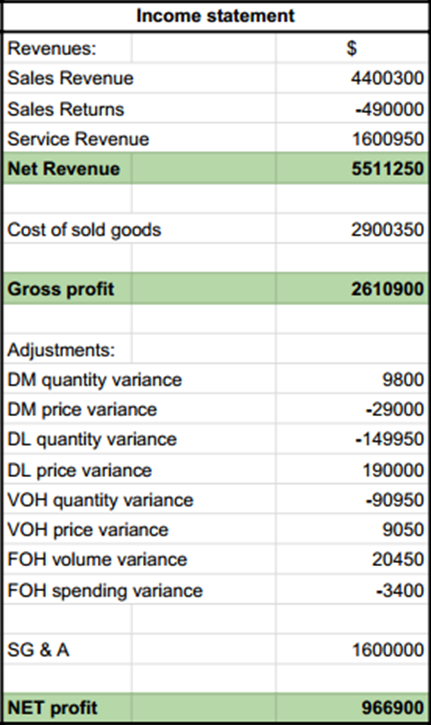
Dharanesh Mysore replied to Vishwadeep Khatri's topic in We ask and you answer! The best answer wins!Lean accounting is streamlining accounting processes within an organization to achieve maximum productivity, service, quality and profit. The purpose of Lean accounting is to collect, examine and communicate the entity performance, position, and cash reserves - all types of information utilized to make decisions on how to manage the business well. Lean accounting concentrates on two goals: 1) converting financial statements into “easy and plain English” and 2) eliminating waste by captivating the focus off the minutiae. The advantages of lean accounting: Less waste in the financial control practices, removal of cost allocation and more hands-on knowledge of business costs A better awareness of how the financial decisions influence the value stream and the client and vice versa: broader admission to business growth opportunities through the fast value-finance connection Mentioning of the organizations that initiated the implementation of Lean accounting include Toyota, Intel, Ford and Textron etc. Lean accounting vs Traditional accounting: Lean accounting will differ significantly from traditional accounting statements. Lean accounting recommends new approach of looking at numbers and calculating the health of a business. Traditional accounting is time consuming and transaction-driven, estimate cost of goods sold, standard cost accounting uses complex variance accounts such as purchase price variances, labor efficiency variances and overhead spending variances. Whereas lean accounting is relatively simple and flexible. Instead of lumping costs into overhead, lean accounting methods trace costs directly to the manufacturer’s cost of goods sold, typically dividing them into 4 value stream groups: 1. Materials cost 2. Procurement cost 3. Conversion cost (factory wages, equipment depreciation and repairs and scrap) 4. Occupancy cost Box score reports are frequently used in lean accounting to supplement profit and loss statements. Traditional accounting neglect such as scrap rates, inventory turns, on-time delivery rates, customer satisfaction scores and sales per employee. Traditional accounting frequently does not accurately capture the efficiencies of lean management techniques, where as lean accounting is designed to permit businesses to report financial data as value streams rather than the cost per unit with traditional cost accounting systems. Value streams permits businesses to see and report all the benefits of their modern lean management methods. Benefits of Lean accounting over Traditional accounting: Benefits of applying Lean Accounting right from streamlining the financial operations, increasing the level of understanding of financials and the impact throughout the value streams creating the ways of measuring the performance of financial statements to support decision-making and improving operational efficiency. Lean accounting is mainly “real-time, generates cost reports on a daily basis rather than historic reports. Lean accounting distinguishes available capacity as an asset not a liability. Traditional cost accounting identifies idle production lines. Traditional accounting compares the actual performance with set of standard variances by design. Lean accounting to support the real financial data with the operating performance. Lean accounting is also associated with the strategic goals of the business and provides improvement insights. Best practices: Lean accounting best practices help to reduce organizational and transactional costs. Most noticeable practices are listed below. • Mapping the value streams • Finding of cost and revenue cycles • Applying “box score” reports defining operational and financial results • Introducing “certified” vendors to decrease transactional costs • Utilizing yearly contracts that cover all expected purchases to reduce the amount of POs • Applying Electronic Funds Transfers (EFT) and electronic invoices Example: Let’s have a look at the traditional accounting statement and Lean accounting statement. Traditional accounting statement like the below, very often we will see notes and annexures explaining how costing calculations are distributed and how the variance is established. This limits the number of people that can understand it. Lean accounting statement changes this approach and making the report easier to grasp:

-
Dharanesh Mysore replied to Vishwadeep Khatri's topic in We ask and you answer! The best answer wins!Design of experiments (DOE) is a powerful data collection and analysis tool that can be used in many types of experimental situations with planning, conducting, analyzing, and interpreting controlled tests to assess the factors that control the value of parameters. The Shainin DOE indicates to a gathering of principles which make up the framework of a constantly developing approach to quality. Shainin DOE tools are used significantly to solve the problem of process optimization. The Shainin DOE delivers the simplest, easiest and most effective ways to get the solution. It is simple to be assumed by both the engineers and shop floor workers since its logical based on basic science and engineering knowledge. The methodology is divided into 4 steps: 1) Detection of factors and decision limits 2) Departure of significant and insignificant factors 3) Validation of important factors 4) Factorial exploration & optimal setting The Shainin DOE used to take the less number of runs to perform the test comparing to Classical DoE which is more complex in term of using high statistical analysis and need a lot of experiments to confident the conclusion. The ease of implementation of Shainin DOE is another added value than classical DOE approach. Shainin technique depends on nonparametric statistics (which make no expectations about the shape of a distribution). The disadvantage of Shainin DOE is the skill and knowledge required to carry out two tasks: (1) to identify the variables correctly and (2) to allocate those variables to the experiment.

-
Dharanesh Mysore replied to Vishwadeep Khatri's topic in We ask and you answer! The best answer wins!Juan Trilogy method is to manage a quality improvement cycle targeted at decreasing the cost of poor quality products/ services by planning quality into the whole process was presented by Dr. Joseph M. Juran in 1986. Juran sets out a process to focus on quality management and best practices to yield the best possible results for customers. The core focus is quality, when producing products/services it is important to ensure they are fit for the purpose they are created for. Juran based everything around three core processes or elements as below: 1. Quality Planning: Designing for quality to advance products and process quality. a) In this stage, it is important to define (1) who the customers are? (2) Define voice of the customer? b) After the customer needs are identified, define the desires for the product, process, service or system. c) Develop them for operations along with the corresponding stakeholder expectations d) Planning activities are finished through a multidisciplinary team, with the contribution of key stakeholders 2. Quality Control: Process evaluations aspect involved in production from process control to Regulatory requirements. Actions that adhere to a standard set of quality criteria concerned with identifying defects. a) In this stage, define what needs to be measured and set a goal for performance b) Gain feedback by measuring actual performance and act on the gap between performance and goal c) There are several tools that could be used like 7 QC tools and other statistical process control methods in this phase of the Juran Trilogy 3. Quality Improvement: Continuous Improvement using Lean Six Sigma methodologies. Eliminating all failure points is the purpose of quality improvement. There are 4 different approaches to be applied for improvements: a) Repair: Responsive approach - fix what is broken b) Refinement: Proactive approach - repeatedly improve the process that isn’t broken c) Renovation: Improve through innovation or technological expansion d) Reinvention: Abandon all current practices and start over with a new approach Juran’s diagram is always represented with time and cost of poor quality on horizontal and vertical axis. Juran model have been widely recognized, practiced and progressed over time to suit organizations with quality improvement plans/programs/initiatives: 1. Build awareness of necessity for improvement a) Survey the employees, find why mistakes or errors are made b) Select the top ten reasons after 1 week c) Take decision how mistake-causing steps are not repeated d) Have track of no. of mistakes being made and ensure they are decreasing 2. Set goals for improvement a) Decide specific goals and plans to be reached b) Allocate clear accountability for meeting the goals c) Base the rewards on outcomes realized 3. Organize to reach the goals a) Establish quality councils b) Identify problems and select projects c) Appoint teams and designate facilitators 4. Provide training a) Investment in education and training will fetch rewards 5. Execute projects to solve problems a) Break-through improvements through cross-functional teams b) Handle the chronic problems and vital few problems created the innovations 6. Document the progress a) Progress expected vs actual progress achieved b) Act to improve the operative status to decrease variance c) Provides confidence on quality improvement projects with Information on progress 7. Offer recognition a) Team/Individual Morale booster 8. Communicate outcomes a) Awareness on the approach used, likelihood to learn and improve further b) Imitate success in other areas 9. Retain score a) Observe progress, Report accomplishments and deficiencies 10. Sustain momentum with inclusion of annual improvement in the regular processes a) Individual and Team oriented

-
Dharanesh Mysore replied to Vishwadeep Khatri's topic in We ask and you answer! The best answer wins!Disney Creative Strategy is a simple brainstorming process to generate new products, services or solutions to problems. Each of the 3 phases (Dreamer, Realist, and Critic) is conducted distinctly with no overlap. The Disney Creativity Strategy is also popularly known as Disney’s Brainstorming Method or Creativity Method was proposed by Robert Dilts in 1994. The Disney strategy comprises 3 steps helps to identify project goals, clear paths and avoid risks as shown in the image below. 1. In the first thinking style, teams or individuals act as Dreamers to brainstorm ideal solutions by using divergent thinking to perceive creative and drastic ideas. In this group, thinking can be without limitations to propose the most astonishing product or the solution to a problem 2. From Realist viewpoint, teams or Individuals acts as logical thinkers and apply convergent thinking to review the ideas left by the dreamers to select the best idea and construct a strategy for it 3. Finally from Critics viewpoint, teams or Individuals review the plan prepared by the realists in order to recognize weaknesses, impediments or risks to improve the plan. Once the Critics are finished, teams may go back into the realist role again for the 2nd round of planning before returning to the Critic role for another round of feedback The dreamer without a realist cannot turn ideas into tangible terms The critic and a dreamer without a realist just become stuck in everlasting struggle The dreamer and a realist might create things, but might not achieve a high degree of excellence without a critic. The critic supports to evaluate and improve the products of creativity Advantages and disadvantages of Disney method over De Bono's Six Thinking Hats: Advantages: Disney method the sequence is constant and structured brainstorming & thinking by teams and individuals with more focus and effective to deliver innovative but practical solutions, whereas the Six Thinking Hats can be used in any appropriate order, probably lead to low focus thinking and discussions Disadvantages: Disney method may lead to increase conflict due to shift of roles and prolonged meetings, where as De Bono Six Thinking Hats recognized to reduce conflict, ensure a rounded view, speed up the meeting, faster and better decisions. It has been used in board room meetings and business discussions De Bono Six Thinking Hats helps teams to get better implementation buy-in because everyone would have participated and shared their inputs


-
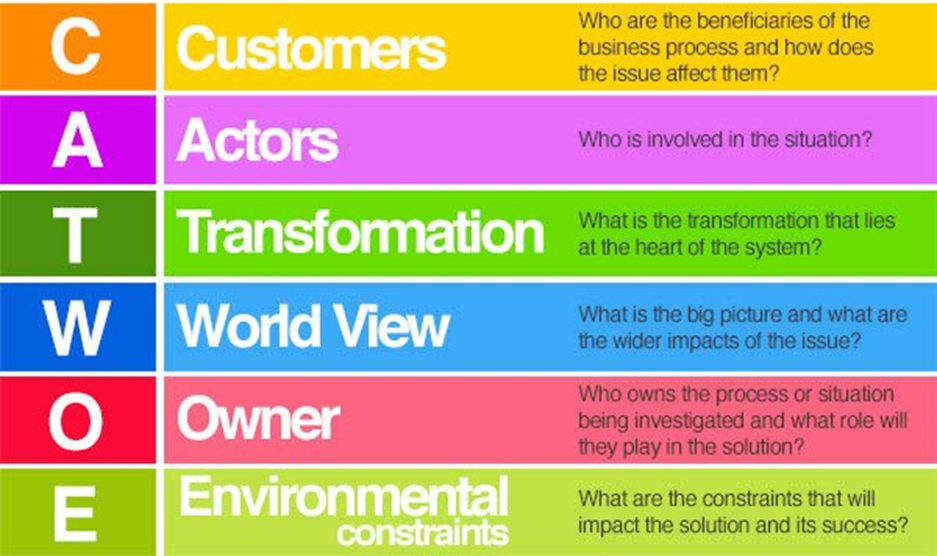
Dharanesh Mysore replied to Vishwadeep Khatri's topic in We ask and you answer! The best answer wins!CATWOE technique provides a framework for defining and analyzing business stakeholder(s) perspectives and interpretation and the impact that this interpretation will have on the direction of the business transformation. This technique is used by many business analysts to identify: (1) What the business is trying to achieve? (2) What are the problem areas? and (3) How stakeholder views affects the people involved in it? CATWOE stands for: · Customer: the receiver of the outputs from the business system · Actor: the roles that execute the business system processes · Transformation: the core process that provides outputs to the customer · Weltanschauung (or World-View): the fundamental theories and meaning that describes why the business activity exists · Owner: the stakeholder who could initiate change with the overall capacity for the business system · Environment: the rules and constraints imposed within and surrounding the business system CATWOE defined by Peter Checkland and David Smyth, it is used for motivate thinking to find solutions to problems. It offers amazing solutions and stimulates multiple approaches. Utilization of CATWOE bullet-point form is best for the actual analysis of the stakeholders’ perspectives before putting forward any recommendations, then turn the results into a root definition to present the perspective back to the stakeholder to check that it does, actually reflect their view of the situation.
-
Dharanesh Mysore replied to Vishwadeep Khatri's topic in We ask and you answer! The best answer wins!The Reliability Block Diagram is helpful to identify possible areas of poor reliability and where enhancements can be made to lower failure rates for the equipment. Reliability Block Diagram method can be used in both the design and operational phase to recognize poor reliability and provide targeted enhancements. The Reliability Block Diagram shows the logical networks of components within a piece of equipment. It is not predictably the schematic diagram of the equipment, but the functional components of the system. The equipment is made up of multiple modules/systems in series, parallel and a combination of the two. Arrangement of modules/systems provides us with the inherent reliability of the equipment. Each block in the Reliability Block Diagram signifies a component or subsystem of the system. The organization and connecting lines represent the reliability structure of the system and may or may not be characteristic of the system’s functional block diagram. The below image is basic Reliability Block Diagram with 4 subsystems the R values are the probability of success (reliability) values for that element over a specific time period. In difficult systems, the Reliability Block Diagram model in the above image may be a summary of the major subsystems. Each subsystem have an associate Reliability Block Diagram with its own diagram of its subsystems and components. Include sufficient detail with each system or subsystem level to support decision making. For example, it is not necessary to show every component on a circuit board when the decisions are under consideration do not comprise any deviations to the circuit board. Signals of a useful Reliability Block Diagram include: · Reliability statement is inclusion of all four elements: function, environment, probability, and duration · Existing reliability performance estimate with reference on source of estimate · Identification of Bottlenecks and Low Hanging Fruit, to know which areas are likely to be the most problematic and which assets are causing these issues based on frequency and period of issues created by each asset compares to others in the model · Evidence of prioritization and design decisions based on RBD information includes in design review meetings · The Reliability Block Diagram should receive regular updates as improved reliability estimates become available Reliability Block Diagram is important for the design team to understand the options available to create a reliability system. If there are multiple ‘what-if’ situations should have substitute Reliability Block Diagram’s created to evaluate system reliability performance. Reliability Block Diagram will be used in Analyze and Design Phases of a DMADV project: As 6O% of failures and safety problems can be prohibited by ensuring there is a strong equipment design and that Maintenance and Reliability is taken into account during the design phase. Equipment will be designed with the following parameters/thoughts: · For Fault Tolerance · To Fail Safely · To give early warning of the failure to the user · Built-in indicative system to identify fault location · To eliminate all critical failure modes cost effectually To ensure that the equipment design is capable and ensure the system or process can deliver requirements of the design. There are various model available to perform the analysis, but a relatively simple and widely accepted approach is the Reliability Block Diagram.

-
Dharanesh Mysore replied to Vishwadeep Khatri's topic in We ask and you answer! The best answer wins!Many companies believe that training is the best solution to everything and the lack of the same, is the cause for many problems. The Kirkpatrick 4 Level Model is best known approach to analyzing and assessing training programs. Dr. Donald Kirkpatrick, Professor Emeritus at the University of Wisconsin first published this model in 1959. Later, the model has undergone many changes and revisions from 1975 till 2016 until a book got published with title Four Levels of Training Evaluation. Kirkpatrick model: Level 1 – Reaction - Signifies the reaction of the learner to the training experience. The learner’s response to training includes their reactions to the training process itself as well as their feelings about the learning material and instructors. Level 2 - Learning – Evaluates how much the learner has learned during the training session. For example, a learner might take a written examination before and after training. A comparison of the two sets of scores indicates how much the learner gained from the training. Level 3 – Behavior/Impact - Assesses the extent to which the learner applies what was learned in the workplace. For example, a company might assign a superintendent to observe the learner's work for one day. After observing the learner's work, the superintendent provides a report describing the learner's strengths and weaknesses. Level 4 – Results - Defines the long-term impact of the training. It shows whether the learner's new knowledge and skills result in quantifiable business benefits. For example, if a company trains its staff to use a new software application, it will quantity the number of hours saved per week due to faster data entry. Benefits of the Kirkpatrick Model: 1. Evaluates – This model provides an objective, organized approach to investigating the value and impact of the training. 2. Specifics – It is not only a conceptual model but offers specific actions and recommendations for doing analysis of the training. To build a Lean Six Sigma training program that delivers a high score on Kirkpatrick model, follow the below steps: 1) Define the specific aims and desired outcomes for training and the method for taking and analyzing the data 2) The identified desired behaviors wants their Belts/Associates to exhibit in their workplace 3) Again identify, measure and improve an approach to modify behaviors as appropriate 4) Identification of the skills required to complete the first 3 steps 5) Lastly, the benchmarked and developed the actual training materials, exercises and instructional staff to provide the best training experience 6) Extensive feedback from learners were solicited and improvements made in response to learners reactions Three best practices to be followed when thinking about Kirkpatrick Model: 1) Have definable and measurable objectives for any training 2) Ensure to follow up on any training activity to observe if the learning objectives have been applied in the workplace, to provide coaching if required 3) Be patient to until the learning curve is getting completed for learners and apply the same skills in the real time environment. Be focused on follow up, coaching until the needed changes were made The Kirkpatrick Model demands to focus on the perceptions of the learners, the application of the learnings and outcomes of the training sessions, to evaluate and improve the training programs to gain maximum benefit.

-
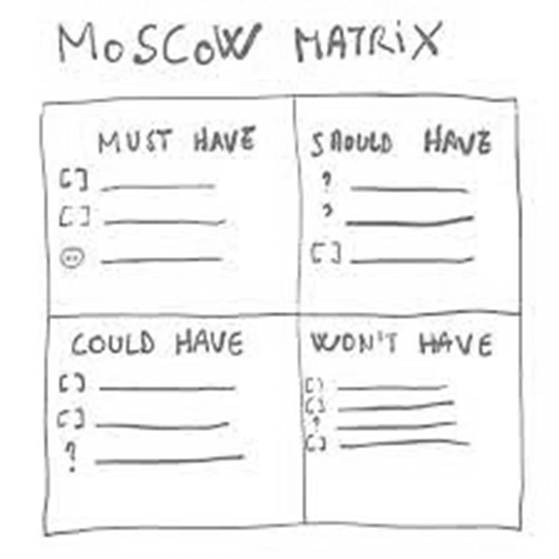
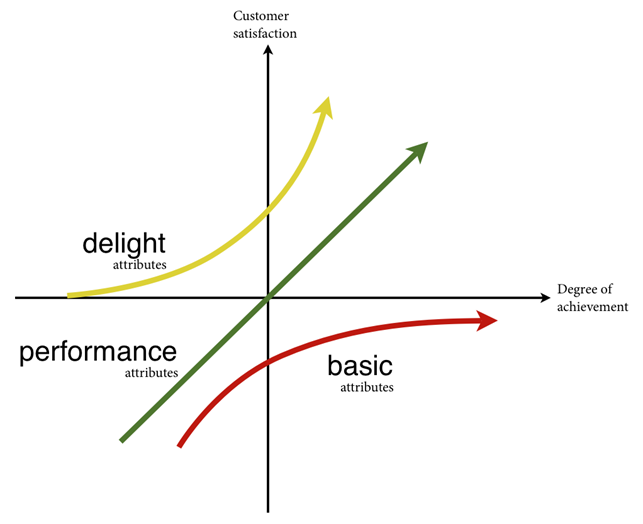
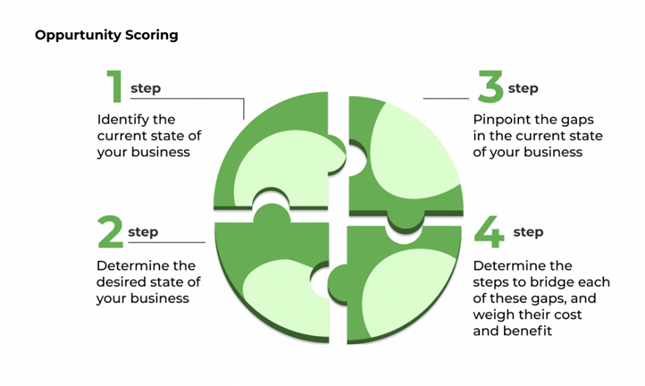
Dharanesh Mysore replied to Vishwadeep Khatri's topic in We ask and you answer! The best answer wins!Prioritization (2x2) matrices clearly define what should be focused on to accomplish more and achieve maximum productivity. This may involve organizing a group of activities that need to be finished as well as their ranking according to different factors (Impact and Criticality etc.). There are 2 common ways of defining prioritization: What should be completed first when you have a lot of activities to complete? When you prioritize them to make sure you have time for everything? A prioritization matrix tool is for task sorting that appears in the form of a table with some criteria of tasks value and demand. All the criteria make up several groups of tasks to do, that, in their turn, receive an objective picture of which group of tasks should be performed initially, which group has to be completed in the second place and which tasks do not have to be done at all. Prioritization matrix types: As we mentioned, prioritization matrix is one of the tools that help project teams/business with tasks ranking and categorization. Let’s concentrate on 7 different types of prioritization and their benefits for business. 1) Eisenhower’s prioritizing matrix Eisenhower’s matrix gets its name from a thirty-fourth American president who knew how to prioritize things well. This matrix typically consists of 4 squares for the following: Square 1 contains the basically important and the most crucial tasks and issues. They should be completed immediately. Square 2 includes a set of very significant but not so crucial tasks. Based on this square, there is the main workflow for each employee with current responsibilities and planned tasks. Square 3 presents crucial but not very significant activities. This part may look like a bunch of disturbances that should be considered carefully before their direct implementation. Square 4 involves the tasks of the lowest priority both for their urgency and significance Many experts respect this prioritization matrix for its simplicity and utilization flexibility, so it is actively used in work planning, business strategy development and other high-level management processes. 2) Value and Effort prioritization matrix This is very simple structure matrix allows experts to work their tasks in a more comfortable and systematic way. It has a classic view of four squares, each sqaure determines the value of the group of tasks and the approximate amount of effort for the task implementation. Let’s have a look at the Value and Effort prioritization matrix: · Square 1 – Quick wins: This group of tasks is different by its high significance for the entire workflow, and the tasks do not actually require a lot of efforts. · Square 2 – Big Bets/Major Projects: These tasks are quite valued and can bring the company to the success. However, they frequently need more efforts and time to be done. · Square 3 – Maybes/Fill –Ins: These activities are easy to be completed without many efforts but they hardly have a big importance for the business processes. · Square 4 – Time Sinks/Thankless tasks: This to-do list contains the activities with low priority with minimal efforts. Hence, it is recommended not to pay attention to these tasks during the day. 3) Value and Risk prioritization matrix Value & Risk prioritization matrix is easy-to-understand and to prioritize the tasks. This matrix helps experts divide the tasks into four categories by their value for the workflow and also recognize the real risk of a particular task. It should be noted that the value of each action/task/activity is determined individually by experts, but there are three different criteria for the risk scoring, as follows: · Schedule risk is the risk can be determined by the time the task starts · Cost risk is rather high amount of the task cost that exceeds the business possibilities · Functionality risk is lack of technological possibility to do the task 4) Value and Complexity prioritization matrix Value & Complexity matrix of activities prioritization gives experts many exciting options: to divide all tasks/activities into the groups by their direct business value and complexity to be implemented. In the low level there are the tasks/activities with their minimal urgency and complexity. Similarly, high sections of the matrix there are tasks/activities with their maximum value and the most complicated level of implementation. This prioritization matrix makes up that what should be done in order to achieve the best results in business processes. 5) MoSCoW prioritization model The actual name of this prioritization should consist of four letters, MSCW but two additional ‘O’s gives the name a certain zest and international charm. Let’s take a look at this method – it has four main groups for the tasks, as follows: · M (Must have this): It is a group of enforceable tasks/activities that should be executed immediately and they are tend to be out of the question. · S (Should have this if at all possible): It is a set of tasks/activities that are very significant to be done but they actually do not have strict time lines. These tasks/activities usually require a lot of time and efforts but nobody rushes the experts to do it faster. · C (Could have this if it does not affect anything else): It contains the tasks/activities that may be done in case of a full synchronization with the technological and logical structure of the project. Alternatives, these tasks should allow flexible methods to execute them, else they will not be implemented at all. · W (Will not have this time but would like in the future): It presents a list of some tasks/activities or ideas that would be good to be implemented during the next stages of the current or future projects. These tasks are supposed to be significant but they should wait for their turn. This prioritization method is perfect while working on backlogs, release planning and creating the technology roadmaps. 6) Kano model Kano model is based on different levels of users/customers satisfaction with a product or service features and behavior requires conducting surveys and user or customer interviews before prioritizing. There are various ways to implement the Kano model. · Must-be features a customer or user considers the product is functional only if their required features are included · One-dimensional features are not “must-have” for work, but they seem necessary to customers or users · Attractive features are meant to add extra satisfaction. They are unexpected but nice-to-have · Indifferent features have the least likely impact on customers or users satisfaction and essentially have no value · Reverse features are most annoying. Usually they have a negative effect on customer or users satisfaction 7) Opportunity scoring The Opportunity scoring or opportunity analysis model is the prioritization technique that uses two graphs to measure and rank opportunities: Satisfaction and Importance until the feedback shared by clients or users are turned into desired outcomes. After completing the list of ideal outcomes, the service provider will be able to survey their clients, asking them the questions: Is a particular feature that important and How? How satisfied are the customers or solutions with the solution? Then the service providers have to plot their answers on the chart, which will give the opportunity to see the features that matter the most to the customers or clients. These sort of items will be listed for the next sprint. Favorite matrix would be: Value and Effort prioritization matrix because (1) it is easy to conduct, (2) great tool for identifying quick wins and low hanging fruit opportunities, (3) no detailed calculations are required, (4) promotes shared understanding between the team and stakeholders and (5) helps us to take faster decisions on ideas or opportunities or solution prioritization. Also, it helps to identify the below: Which task is most important for business? Which task can yield more benefits? Which task fit best with my company/process visions or goals?


-
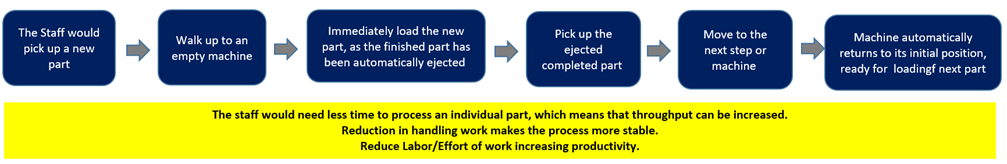
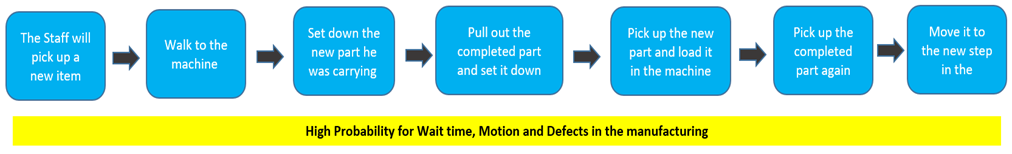
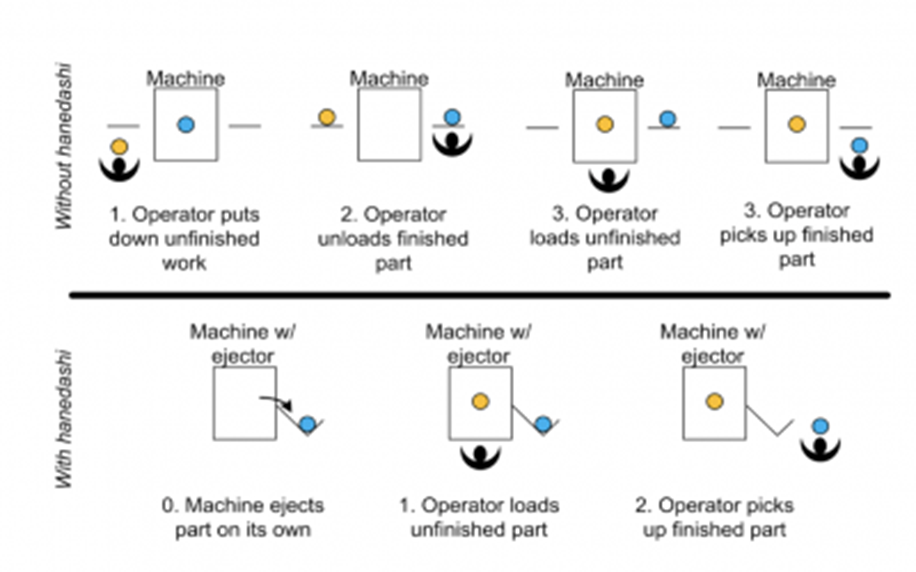
Dharanesh Mysore replied to Vishwadeep Khatri's topic in We ask and you answer! The best answer wins!Hanedashi is a Japanese word meaning automatic ejection. It is also defined as a device for automatized unload of a work item from one process or operation, given that the accurate state for the next work item to be loaded. The Hanedashi standard of the automatized unloading and orientation for the next process is frequently used in automated production systems that operate according to the Chaku-Chaku standard. Once several Hanedashi-designed machines are placed in sequence, they form Chaku-Chaku line, means “load-load.” Because of the automatic discharge functionality, the operator can run multiple machines with less waste, less effort and in a safer manner. Implementing the Hanedashi in manufacturing line, it would eliminate the Wait time (Delay), Motion and Defects wastes exists in the manufacturing unit. Difference between traditional Set up and Hanedashi Set up: Traditional Set Up: Hanedashi Set Up: The only manual operation involved in Hanedashi principle is to insert the work piece. The processing and afterwards the discharge is fully automated, work piece than can be transported to the next machine or handed over to the next operator. Difference between traditional Set up and Hanedashi Set up: Example of Hanedashi: One of the largest auto battery manufacturers in the world traditionally used a single operator to load, run and unload their machines which was costly, time-consuming and frequently unsafe process. After visiting another plant in Japan, the plant manager decided to copy the Japanese branch work ways and install a Chaku-Chaku line using Hanedashi automatic ejectors. Productivity increased intensely because the operator could now simultaneously run four machines. Safety improved because the operator no longer had to reach to the machine to pull out a completed part or movement around to load it.


-
Dharanesh Mysore replied to Vishwadeep Khatri's topic in We ask and you answer! The best answer wins!A/B testing is a direct comparison between two or more different versions of assets or random experimentation process of two or more versions of variable. For example, an airline company can market the same international airfare price through different forms of email and social media marketing post over the course of a week. They be able to use the data and analysis to determine which performed best and generated customer engagement, clicks, comments and actual ticket sales. Continuous A/B testing additionally helps us to understand customer audience and what they like, respond to or are influenced by to improve your success and increase sales and revenue. The main aim of A/B testing is to enhance a customer's experience to generate more revenue and profits. The better a customer understands a website and knows how to use it, the more motivated they are to make a purchase, sign up for services or convert into a repeat user. Applying A/B testing allows us to learn what consumers enjoys and uses on our websites/pages/applications. Example of A/B testing in E-commerce sites: E-commerce websites and mobile applications depend on on A/B testing to provide the best customer experience, as the smooth purchase funnel is critical to gaining orders and profit. Companies test out where and how to display shipping costs, promotions, sales, shopping cart and checkout page perceptibility and placement throughout. Each change is to encourage the consumer to buy or shop again. If there is one item often in continuous A/B testing is the shopping cart feature, which almost every e-commerce site has and the shopping cart icon stays visible no matter which page you logged in. It serves as a reminder for products in your cart but also encourages you to: • Keep shopping • Discover daily deals • Check items on your wish list • Buying items in cart • Enable the one-click payment feature The one-click ordering button is usual for several well-known online retailers and results from extensive A/B testing.