

Sabyasachi Jana.
Members
-
Joined
-
Last visited
-
Sabyasachi Jana. replied to Vishwadeep Khatri's topic in We ask and you answer! The best answer wins!Inventory Inventory is any component that is used to build finished products/services or Inventory can be the finished products themselves as well, until sold. Though inventory is a little differently conceived in Service industry, Inventory in any industry effectively means 'idle cash' and businesses try to liquidate inventory to achieve business values. Inventory is therefore considered as a waste among the 7 wastes in Lean approach. Inventory is definitely a must for products or services but it must be carefully controlled to optimize business value. Inventory has different 'avatars' in different industries. Retail: In retail industry, all goods waiting to be sold is Inventory. Business target to reduce the shelf-life of inventory and lesser shelf-life clearly means better turnover ratio. Manufacturing: In Manufacturing industry the meaning of Inventory is rather straightforward and widely understood as the raw materials and work-in-progress components. It includes the finished products as well and they are expected to have as shorter shelf-life as possible. Healthcare: In healthcare area we can take examples of a pool of patients waiting for treatment ( and effectively billing). This can be considered as 'inventory' as the pool can only be 'liquidated' when served. In a certain customer base, less number of patients waiting surely denotes the process effectiveness in terms of timely turn around. Airlines/ Theatres: In the case of airlines or theatres, unsold seats can be treated as Inventory. It is understood that those 'idle opportunities' can turn into wastes when a plane needs to take off and the theatre needs to start the movie with empty seats. Service Desk: In a Service Desk environment ( BPO, KPO, Network management), inventory can be in a number of forms. All requests/ incidents either unattended to or being worked on can be considered as inventory as until they are served to/ resolved, 'liquidation' does not happen. Similarly, emails waiting in inbox can be considered as inventory as well depending on the process objective. Defence: In a defence regiment, all unused bullets and warheads can be considered as Inventory as they block cash. Soldiers awaiting deployment can as well be taken as Inventory using Lean Philosophy. Training: Let's take an example of a pilot training centre where simulators are used, The simulator ( hybrid structure of hardware & the associated software) can be taken as inventory when not in use. Similarly, any procured but unused license can be considered as 'idle cash' or inventory. Looking at the above examples, it is evident that not all industries will try to just 'reduce' ( manufacturing)inventory but some will like to ' fill up' ( airlines), 'use more' ( license) or 'optimize inventory size' ( defence) depending on the industry & the specific process objectives.
-
Sabyasachi Jana. replied to Vishwadeep Khatri's topic in We ask and you answer! The best answer wins!The overall discussion is captured in the table below. There are situations ofcourse ( examples in table as well) when correction becomes the most preferred option compared to corrective or preventive measures. A specific example would be the case when a implanted pacemaker is not accepted by a patient's body and treats it as a foreign element resulting in severe health deterioration. Certainly an urgent correction ( replacement) is warranted here and not a corrective or preventive one as the cost("the life") for a FTA would be too high from the patient's perspective. In another scenario if a sensor on a in-journey spaceship stops working due to unpredictable solar storm disturbance, correction ( recalculating analysis/ decision by correlating with other sensor data)is the most preferred option as the cost of preventive actions would be too high. Correction Corrective Action Preventive Action What is it? Action to eliminate a DETECTED nonconformity Action to eliminate the cause of a DETECTED nonconformity Action to eliminate the cause of a POTENTIAL nonconformity Approach Correction is done using the following approach- o Determine the magnitude of the problem. o Determine how to prevent it from getting bigger. o How to address current situation. Corrective action takes steps to correct the detected nonconformity by fixing the specific cause. The approach is as follows- o What’s the chance it will happen again? o Estimate of any future threat Need to assess the risk and mitigate it based upon severity. The following tools are helpful: o Checklists o FMEA – Failure mode & effects analysis o Hazard and operability analysis (HAZOP) o Fault tree analysis (FTA) When Best o High Impact and high urgency, o Cost of corrective or preventive actions is high, o isolated event o Event repetitive in nature, o Cost to implement corrective action is viable o Just correction is not sufficient, o Causes known and other potential failures are unidentified o Correction or corrective action is not sufficient o High impact risks involved that needs proactive risk control o Complete risk model of the process is known o Cost for implementation is viable Examples Isolated events e.g.- - natural disasters which cannot be controlled -event due to sudden political scenario change, includes wars etc -pure human mistake which cannot be prevented/controlled Potentially repetitive known events can be fixed by corrective actions e.g.- - single point of failures fixed by back up links -process guidance like visual workflow diagrams/ check lists When complete FTA or FMEA of the process is done, preventive actions can be implemented e.g.- - automated safety check mechanism -live capacity utilization dashboard for trend analysis that leads to preventive actions
-
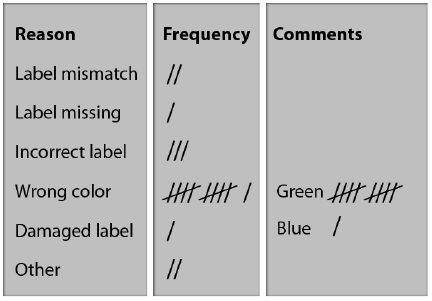
Sabyasachi Jana. replied to Vishwadeep Khatri's topic in We ask and you answer! The best answer wins!Check sheet and its relevance in BPM world The check sheet is one of the seven basic tools of quality control . It is a simple document that is used for collecting data in real time and at the location where the data is generated. The document is typically a blank form that is designed for the quick, easy, and efficient recording of the desired information, which can be either quantitative or qualitative. A defining characteristic of a check sheet is that data is recorded by making checks (marks) on it. A typical check sheet is divided into regions, and marks made in different regions have different significance. Data is read by observing the location and number of marks on the sheet. The Check Sheet is not just one of the seven QC Tools, but it’s also one of the primary tools used during the Measure Phase of a Six Sigma DMAIC Cycle to collect data. Five basic types of check sheets include: 1. Classification Check sheet, 2. Defect Location Check sheet, 3. Frequency Check sheet, 4. Measurement scale check sheet and 5. Check list. Different check sheets: 1. 2. 3. 4. 5. Using a check sheet is appropriate when the data can be observed and collected repeatedly by either the same person or at the same location. It is also an effective tool when collecting data on frequency and identifying patterns of events, problems, defects, and defect location, and for identifying defect causes. While BPM aims to improve operations by managing the business as a whole, the six sigma set of tools seeks to improve business processes by decreasing variability and defects. Though BPM / tool based approach seeks to implement business process automation, it does not warrant Six Sigma approach & BPM to be mutually exclusive. Six Sigma and Business Process Management principles can be used together until teams find the optimal mix of methods that produce the desired results. To that extent check sheet plays a crucial role. As a quality control concept, check sheet is very much there as a logical premise of new era BPM tools. In real world practice where automated BPM tools are not fully implementable ( e.g. small scale manufacturing units, real estate construction quality checks, small and medium scale service /hospitality industry ), Quality Managers still use check sheet as an effective tool- either in its basic form as an A4 sheet or a little advanced excel /tally based templates. While BPM uses sophisticated advanced tools for automated data collection, data analysis and issue identification; the basic check sheet remains as the backend concept. In quality education, concept of check sheet will surely remain, in its original form to start with, and in modified forms in terms of its application. [image source: http://www.sixsigmadaily.com/ ]


-
Sabyasachi Jana. replied to Vishwadeep Khatri's topic in We ask and you answer! The best answer wins!False Alarm vs Missed Alerts The acceptance of both is subjective to business scenarios. In general cases, it appears that false alarms are more acceptable considering they do not directly/immediately affect customers in financial terms while missed alerts could be fatal depending on criticality of the parameter in question. It is a trade-off decision to set thresholds for both false alarms and missed alerts considering the industry and scenario. This trade-off produces two different cognitive states. A false-alarm prone process reduces 'compliance' and may lead to all alarms including true ones being responded to late or possibly not at all. A miss-prone process reduces 'reliance' and it will warrant to use spare monitoring capacity for the alerted event in the course of correction. A false-alarm prone situation might be acceptable when there is evidence that it does not impact overall effectiveness with the presence of other triggers / standard process behavior of monitoring the event. In the scenario of health-monitoring related automations ( e.g. system to detect possible seizures) , a false alarm is often taken as more preferred compared to missed alerts. This will impact the quality of the underlying algorithm though but patient wellbeing takes higher priority than system effectiveness. A missed-alert prone situation might be acceptable if there are other means of fault detection/mitigation available. A study was done in the case of unmanned air vehicles and it concluded that other triggers like visual monitoring took up larger attention over system generated alerts and mitigated the risks to great extent. In this study, a false alarm prone system proved to be more 'costly' compared to missed-alert prone system. [Source: http://www.aviation.illinois.edu/avimain/papers/research/pub_pdfs/hfes/dixonwickchang.pdf ]
-
Sabyasachi Jana. replied to Vishwadeep Khatri's topic in We ask and you answer! The best answer wins!Central Limit Theorem and Law of Large Numbers The Central Limit Theorem tells us that as the sample size tends to infinity, the distribution of sample means approaches the normal distribution. This is a statement about the shape of the distribution. A normal distribution is bell shaped so the shape of the distribution of sample means begins to look bell shaped as the sample size increases. In other words, as sample size goes to infinity, the sample mean distribution will converge to a normal distribution. The Law of Large Numbers tells us where the centre (maximum point) of the bell is located. The sample size approaches infinity the centre of the distribution of the sample means becomes very close to the population mean. In other words, the average of independent (many) samples will converge to the mean of the underlying distribution that the observations are sampled from. The Central Limit Theorem describes the relation of a sample mean to the population mean. If the population mean doesn't exist, then the CLT doesn't apply and the characteristics of the sample mean, Xbar, are not predictable. We can always compute the numerical mean of a finite number of observations from any density (if every observation is finite). But the population mean is defined as an integral, which diverges, so even though a sample mean is finite, the population mean is not. The distribution of the sample average is that same as the distribution of an individual observation, so the scatter never diminishes, regardless of sample size. The Central Limit Theorem almost always holds, but it’s application needs caution. If the population mean doesn't exist, then the CLT is not applicable. Further, even if the mean does exist, the CLT convergence to a normal density might be slow, requiring hundreds or even thousands of observations, rather than the few dozen in these examples. Therefore, we cannot get rid of non-normal data set always.
-
Sabyasachi Jana. replied to Vishwadeep Khatri's topic in We ask and you answer! The best answer wins!Fault Tree Analysis What is it: Fault Tree Analysis (FTA) is a part of the Root Cause Analysis ( RCA) toolkit used during the Analyze and Improve phases. It is a tool/approach that helps to identify underlying reasons for a specific failure or event. Unlike a Fishbone diagram where all possible causes are listed without their inter-relation, FTA also helps to determine the relationships between causes and failures. It may highlight both 'OR' and 'AND' conditions for multiple causes to a failure mode. A single fault tree is used to analyze only one top event which can then be a basic cause of another higher level event. FTA is commonly used to search for the causes of an already observed or potential failure so that problems relating to processes, products, service, or quality can be either controlled or eliminated. Therefore, this is useful for both RCA and also to find solutions for root causes as even solutions can be verified through inter-relationships between factors that constitute the optimum solution. FTA is essentially a top-down approach whereas FMEA ( Failure Mode & Effects Analysis) is a bottom-up approach. Approach: FTA starts with identifying the top event that is in question. It's then followed by identifying probable high level causes along with their relations ( 'OR' gate or 'AND' gate) towards the effect. Naturally, causes with 'AND' relation need to happen together for the failure to happen and any of the causes with 'OR' relation may result in the failure. All these causes then are drilled down further until low level actionable causes are identified. 'Minimal cut set' approach is followed that identify the smallest combination of basic events which, if occur, will cause the top event to occur. With the help of subject matter experts, probabilities are assigned to each basic cause and they are prioritized. The last logical step is to evaluating the tree and brainstorm to find solutions to root causes so in effect the failure can be either controlled or eliminated. Most effective at: In manufacturing industry, automotive or health care where large and complex systems of mechanical and structural components exist FTA is highly effective to analyze system/process/ structure reliability. For software bug analysis or risk assessment , FTA is proven to be immensely effective. Least Useful at: It does not work well when human actions are inserted as a cause. This is because human failure rates have wide variance and this prevents accurate results. Construction of a FTA for a large complex system is often tedious. Basic shortcomings of FTA are often identified as (i) correlation between all basic events are difficult to model, (ii) an exact solution to correlated events does not always exist. Therefore, FTA is prone to subjective decisions. Because this technique is highly reliant on judgment and insight that are based on subjective opinions, there is a risk of erroneous information, which may cause erroneous result . If wrong failure sources are identified in an FTA, the subsequent results may face a ripple effect of this error. Results may, therefore, not be valid or accurate. FTAs may fail if the technique is not implemented in a disciplined fashion or if the system problem is so complex that multiple levels of potential causes exist for each problem type. When the system of focus for the FTA is very large, quantitative analysis software may be required to analyze the results. [Sources used: https://wesharescience.com , https://www.slideshare.net/ ,http://reliawiki.com ]
-
Sabyasachi Jana. replied to Vishwadeep Khatri's topic in We ask and you answer! The best answer wins!Product Innovation vs Six Sigma Lean Six Sigma is generally taken as a methodology & data driven approach for improvement while Product Innovation is about delivering customer values through new ways. While Six Sigma stresses on measurement-based statistical approach, innovation requires creative design thinking. Due to this it appears that there is a natural conflict between the two. Innovation is more of a skill-based process while Six Sigma is analysis-based but they surely complement each other in today's fast changing technological landscape. A number of Six Sigma tools e.g. the Cause and Effect diagram and the Failure Mode and Effects Analysis (FMEA) promote innovative thinking and team brainstorming. Tools like DoE, Pugh matrix & Poka-Yoke surely validates the target designs in the best possible way and put a confirmation on innovative ideas on whether they are sustainable and delivering the exact values they are intended to deliver. It definitely needs a balance. Today's corporations seem to find that balance between structured methodology and free creative thinking and they have also established an approach to merge the two. At Caterpillar Inc., stagnant revenue growth prompted the company to undertake a massive transformation in January 2001. Through a Lean Six Sigma initiative, the company developed a strategic vision and a road map for change guided by fact-based analysis. The initiative led to product innovations, like Caterpillar's phenomenally successful low-emissions diesel engine, and to redesigned processes, including a streamlined supply chain. By 2005, the company's revenues had grown by 80 percent. [ source: http://businessfinancemag.com ] Six Sigma's focus on fact-based analysis and direct customer input , it is fit to transform, helping a company rethink its entire business and create a more innovative climate. The leading companies like IBM have deliberately expanded the scope of the methodology, using it to surface significant innovation opportunities that have impacts well beyond operations. Doing so has enabled these companies to improve performance and establish an organizational culture with an inherent inclination toward innovation.
-
Sabyasachi Jana. replied to Vishwadeep Khatri's topic in We ask and you answer! The best answer wins!Measurement vs Management: Measurement is without any doubt an essential part of identifying areas that need improvement. A business's regular health check remains dependent mostly on balance scorecard data. When Peter Drucker imposes stress on measurement, he highlights the aspect of setting up actionable items supported by data. Without a robust measurement and therefore governance model in place, a business is bound to be driven just by assumptions & human instincts which are highly susceptible to failure due to their inherent nature of bias. Therefore, for a business to excel, it is essential to know how it is performing today against measurable performance indicators and based on data, decision needs to be made on improving areas of concerns. The above stands apt as long as a Business just thinks about the material aspect. However, customer experience is not just about what he gets but also about how he feels about 'what & how' he gets. An organization, apart from it's financial performance, is also a way of improving people's lives, enhancing the social experience around them. It has an extent of spirituality around it which cannot me measured. When Deming says "the most important numbers are unknown and unknowable", in my view, he highlights the aspect of Wholistic enhanced experience that a business should aim to deliver. When a leader plans to improve e.g. Employee Satisfaction, he may put some measurable attributes like working hour flexibility, additional benefits, or say 'free meal', however the aspect of how an employee feels about being valued, or the kind of working relationships people share in the organization cannot be measured. These, 'unknowable' aspects impact the target metric greatly though. And these aspects of customer experience cannot be measured but can definitely be managed & improved. That's the reason, an organization puts it's mission on top and drills down it into vision & objectives: material ways to achieve the ultimate purpose. My take is- a business should make every effort to take decisions based on data driven inputs but at the same time, must keep space for human instincts to play, the spirituality around the company mission & values to take calls.
-
Sabyasachi Jana. replied to Vishwadeep Khatri's topic in We ask and you answer! The best answer wins!Excellence is the journey towards being in the best form one can attain. While Business Excellence is a Wholistic improvement approach around all aspects of the business, Operational & Process excellence are the fundamental building blocks. Personal Excellence is more at an individual level, however impacts all the said aspects of a business and it's people who drive things. Business Excellence works at High Level balance scorecard that includes Go to Market approach, Customer Experience, Financial Performance. Operational excellence is set up against operational KPIs and usually works within Operational boundary. It measures baseline performance and tries to deliver against an improved target. Process Excellence while measured at Organizational Level, tries to assess the as-is process maturity level and establishes framework to improve it further against set goals. Personal Excellence is about one's personal approach to become a better person, a better professional and more effective in everything he does. A Business however, needs to consider all 4 excellence models to achieve optimal efficiency.