
Topics
-
The latest setback has fueled worries that Google was losing momentum just as OpenAI and Anthropic and a host of Chinese rivals have accelerated the pace of model releases. On the call on Wednesday, Pichai struck an unusually defensive tone as analysts pressed him on the state of Google's frontier models and whether they could still compete at the cutting edge of AI development. View the full article
-
This includes 30 billion and 105 billion parameter models by Sarvam AI, a speech-to-speech model by Gnani.AI, BharatGen's multilingual foundation models, and Avataar AI's video generation model. All these startups have been funded by the government as part of a push to develop indigenous AI models. Of the 20 models, five have been released so far. View the full article


Leaderboard
-
B.Ravi Sankar
Members1Points16Posts

Popular Content
Showing content with the highest reputation on 09/22/2023 in all areas
-
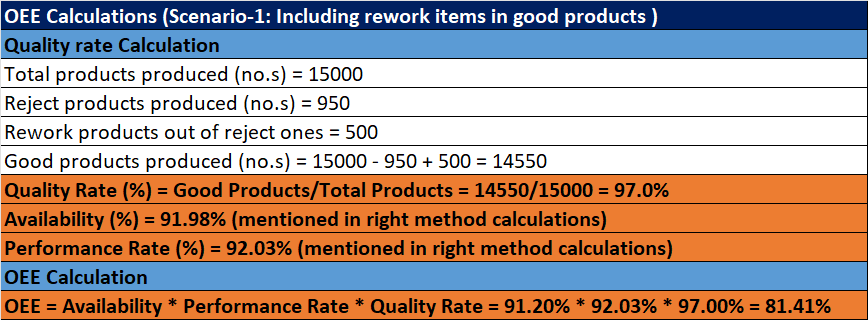
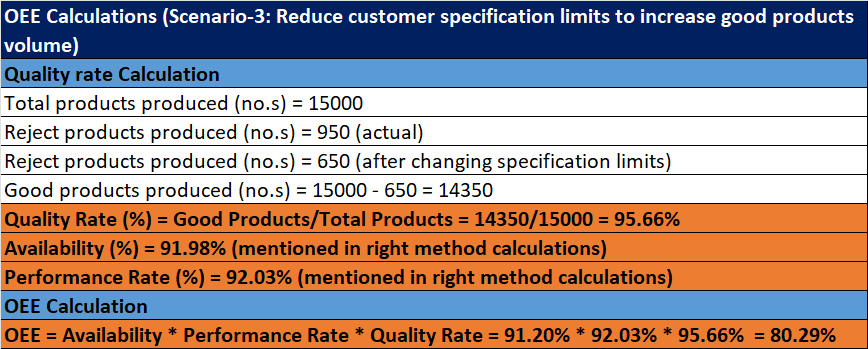
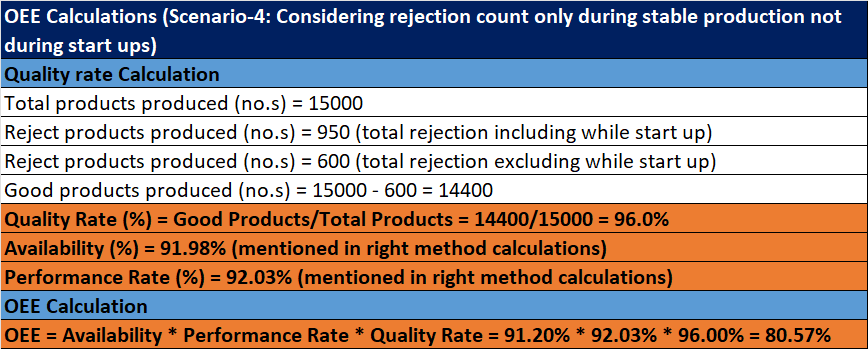
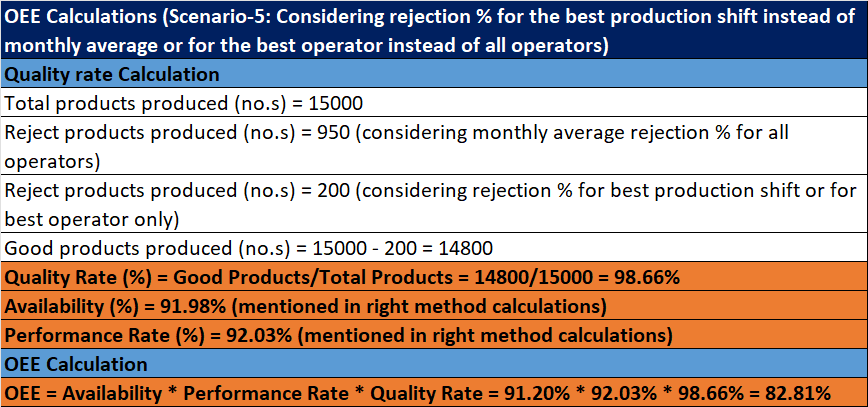
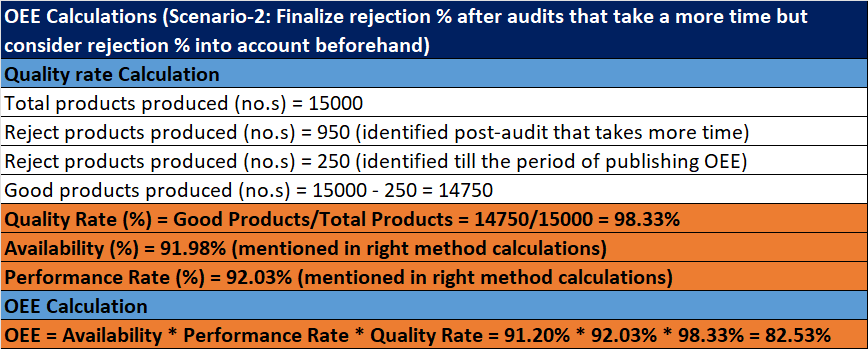
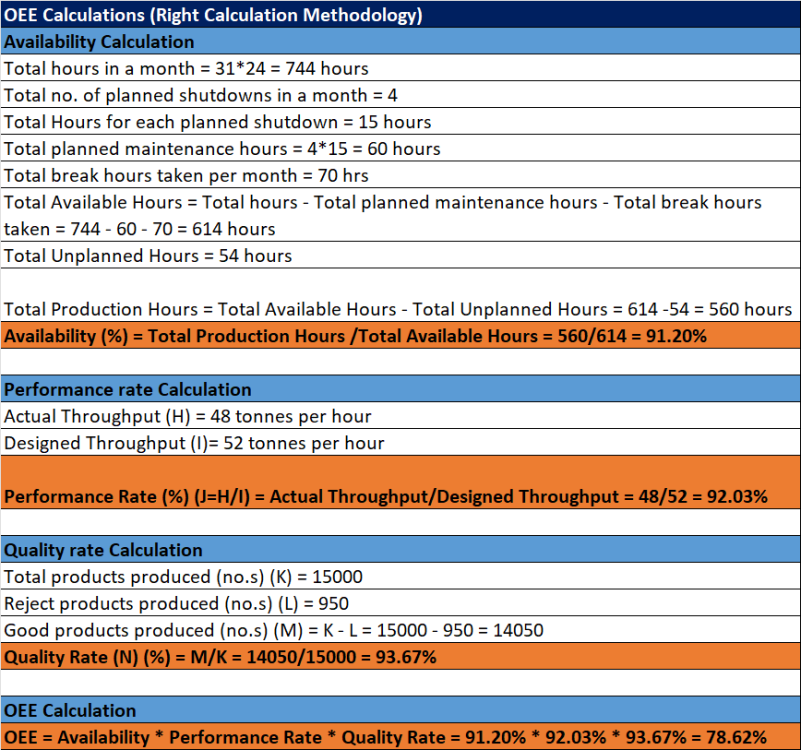
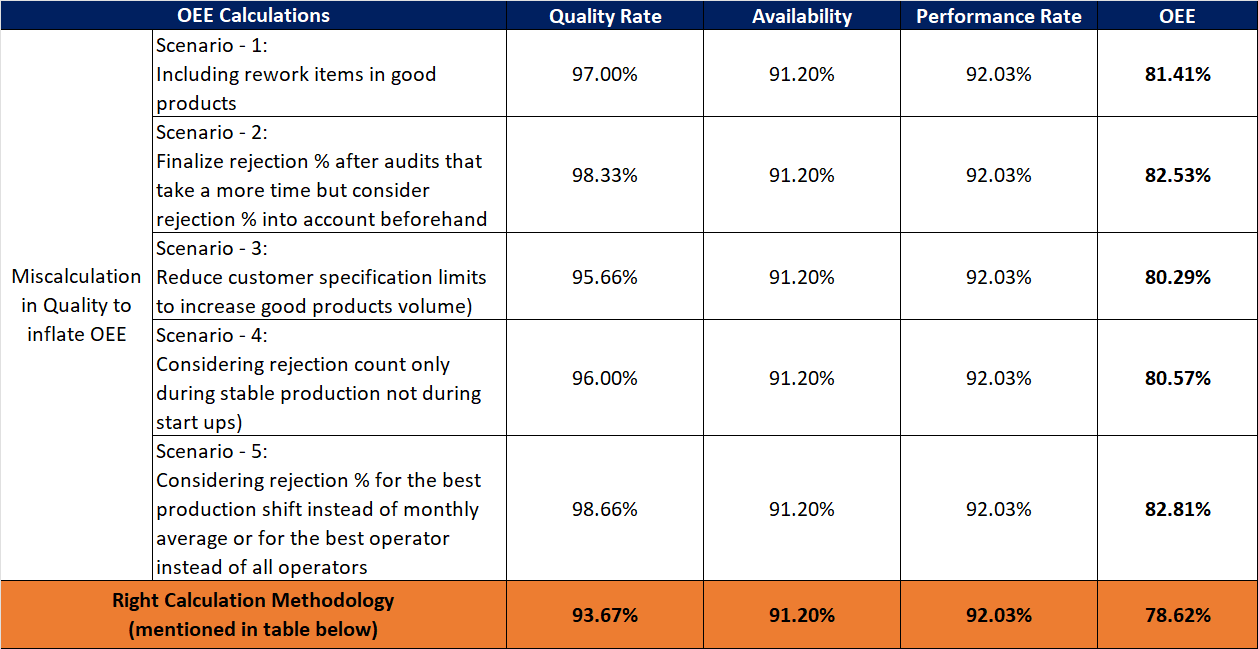
1 pointOEE, which is determined as the product of availability, performance rate, and quality rate, is a tool used to assess the real performance of a process. Availability is the tool used to measure process performance by considering operating hours out of total available hours. Performance Rate is the tool used to measure actual throughput against designed throughput. Quality Rate is the tool that measures efficiency of products produced by considering good product output out of total product output. Generally, benchmark of OEE for manufacturing sector is taken as 85% and all manufacturers try to achieve the best in class results OEE calculations for a manufacturing process that yields finished goods at the needed throughput using the correct calculation methodology has been shown in table below. The following 5 scenarios show how quality is frequently measured inaccurately in order to unnaturally increase OEE for the process: Scenario 1: Including reworked items in good products – In a few manufacturing processes, some of the rejected products are reworked to get a good product, and calculated those reworked items in good products. Scenario 2: Finalize rejection % after audits that take a more time but consider rejection % into account beforehand. Scenario 3: Reducing the customer specification limits to increase good product volume – Sometimes, process shift managers slightly reduce specification limit to get less rejection % compared to other shifts Scenario 4: Considering rejection count only during stable production not during start ups – During production start-ups, rejection % is high as compared during stable production and so managers consider only rejection% while stable production Scenario 5: Considering rejection % for the best production shift instead of monthly average or for the best operator instead of all operators

 1 point

This leaderboard is set to Kolkata/GMT+05:30