B.Ravi Sankar
Members
-
Joined
-
Last visited
-
Applying AI systems in practical business environments plays a vital role in evolving process, but AI systems deployed with static model might fall behind when processes constantly evolves with new regulations, customer requirements, improvements. So, AI system should be designed as modular, configurable, adaptive and incremental learning so that the model can be aligned with changing process without building AI agent from scratch. These approaches help AI to adapt changing process which is explained below: Continuous Learning Loop - Dynamic learning pipelines uses custom logic layer with automated retraining model caused by data drift or process changes Modular Architecture – Build the AI system with distinct modular components and new rules can be embedded to specific modules in case of any process change instead of changing entire AI system Self-Correction Agents – Agentic AI uses self correction and reasoning agents that queries updated KB instead of full retraining of model for any process change User Feedback Mechanism – In case of complex cases, AI uses human in the loop mechanism and learns from user corrections/feedback and use these inputs to improve AI agents Adaptive AI agents can be designed for process changes in finance and accounting domain and below few process change examples have been provided: New regulatory updates – Adaptive AI updates new tax rate introduced for specific services and process automatically in tax calculation mode using updated tax rate without changing rest of the system Change in Travel & Expense policy – Adaptive AI applies the new allowance mentioned in policy to all future expense claims avoiding redevelopment since the rules are modular and easy to edit Change in workflow for invoice approval – Approval for high valued invoice amount > $10K require 2 layer approval from managers. Adaptive AI updates new approval process and auto routes high valued invoices to 2 layer approvals without retraining system Enhanced fraud detection model – Adaptive AI retrain fraud detection model with examples of new pattern of fraudulent activity and then flag suspicious transactions matching with new fraud detection criteria keeping the rest of system unchanged Enhance customer ticketing system – Adaptive AI retrains ticket categorization when new complaint categories are identified for new services or any new type of escalations are raised and then routes the ticket to respective functions
-
Existing or traditional risk control mechanisms such as internal or external audits, customer escalations or CAPA are reactive decision mechanisms post crisis has happened and these mechanisms being followed in organizations to mitigate the risks or prevent further occurrence of crisis; AI is a powerful technology that we can leverage as a proactive decision mechanism to helps visualize risks before the crisis occurs. AI enhances human decisions rather than replacing judgement. Below are few benefits that AI helps: · Leaders to take proactive actions rather than reactive actions · Early alerts helps leaders to respond faster by eliminating detection time · Visualizing risks saves financial loss and reputation · Follow strong governance in preventing crisis situation How AI handles risk and prevent crisis: · Forecast potential risks beforehand basis historical or real time data using predictive analysis · Identify unusual patterns and flag these issues named as anomaly detection, thereby preventing crisis · Respond to crisis in a better manner using AI Chatbots that will handle customer queries in crisis situation · Train leaders by creating realistic simulations for crisis situations I have picked up AI driven anomaly detection useful in invoice processing and will explain the benefits of this feature: _Identify duplicate payments - Same invoice sent twice by vendor for processing with different invoice numbers. AI helps in avoiding overpayments _Identify fraud cases with higher amount charged – Vendor submits invoice with higher amount than usual. AI helps in avoiding financial loss _Catches typo errors while processing – Sometimes processor does human error post invoices. AI helps in improving service quality by improving accuracy _Identify missing information – Invoices submitted by vendors sometimes miss to provide mandatory information or provide incorrect data such as currency discrepancies, no supplier name or address, no tax codes, incorrect PO number, etc. AI helps to reduce invoice processing time _Identify patterns for new vendors onboarded – Few new vendors invoices certain amount for the services that they are not offering. AI helps to expose these frauds of new vendors AI identifies these anomalies using ML models, NLP, OCR+RPA and Graph analytics, so anomaly detection is a feature in invoice processing that helps take proactive decisions before crisis hits
-
Workforce optimization is one of the powerful tools used in organization to improve productivity with lower costs and better employee engagement by deploying right employee with required skills in right area at right time. Smart Schedulers using AI technology helps balancing efficiency with employee satisfaction that benefits organization over traditional approach as follows: · For business - Better productivity with lower resource cost and data driven deceisions · For employees – Balancing shifts with less stress and better career growth · For customers – High quality service with faster response time How Smart Schedulers provides better workforce optimization in Invoice Processing domain: · AI driven forecast will predict volume using historic data or seasonal variations and help in workload balance for processors in advance · AI assigns invoices to right skilled processors (new hire or tenured) basis complexity of invoices processed earlier, thereby reducing processing time or errors · AI helps in load balancing in real time situations and redistributes invoices amongst processors in case of high invoice inflow, thereby achieving KPI targets · Smart Schedulers provide preferred shift schedules basis employee availability (leave) and invoice volumes received, thereby improving employee satisfaction · AI tracks processing time and accuracy for processors and helps the managers for performance feedback and provide trainings for low performers
-
AI is very well capable of interacting with customer and make them feel personal in each interaction by merging data, context and empathy at scale without crossing boundaries of trust. Better customer interactions with less customer efforts and high CSAT scores will definitely help the business expand Customer’s expectation from any service are · Quick response on any queries raised · Receive accurate response on queries raised to avoid asking repeat questions · Faster query resolution with minimum interactions · Easy to interact with and have a sense of personal touch by letting them feel valued, heard and understood · Expect trust on data privacy AI helps in better interaction with customer by: · Collecting the context with consent by pulling required data keeping in mind not using hidden data · Knowing customer better and in depth by building customer profile using data from past purchases, past interactions or support tickets, browsing history, etc · Use smart prompts for Bots that works on prefilling summary and also acknowledge earlier context showing respect and care · Feel customer valued by predicting needs and suggesting next steps that will help query resolution prior customer asks the question · Switch tone basis customer tonality and empathize basis sentiment analysis that reflects customer sentiment For example, Account Payable Helpdesk is the function included in Procure to Pay process that handles queries from vendors, internal or external stakeholders related to invoices processed, payments done and PO created. Below are few AI capabilities mentioned that can be used in AP Helpdesk across PTP: · Build AI Chatbots for automated query handling with 24/7 support and less repetitive tickets · Routes the ticket to required department basis query raised for faster and convenient resolution · Captures invoice data using OCR and NLP from documents or emails · Proactively inform vendors or required stakeholders on invoice status thereby reducing escalations · Resolve complex queries by searching policies, SOPs, etc using intelligent search & knowledge base · Adjust the tone basis customer’s response and urgency thereby building trust · Flags invalid invoices, duplicate payments thereby preventing financial losses
-
AI can become a trusted advisor for leaders but cannot completely replace human judgement. So, hybrid approach of AI insights merged with human judgement will be the best result for a leader to take a decision that will be aligned with organizational goals Positive outcomes of AI-driven results: AI can analyze huge data and predict near to accurate decisions with minimal time consumed that a leader might miss AI can run multiple complex cases simultaneously and get real-time answers with minimal efforts that leader can refer to AI ensure fairness & reliability in decision if AI is properly trained AI can work 24*7 and provide multiple best scenarios that a leader can select for Negative outcome of AI-driven results: It’s difficult for a leader to trust AI decisions since it is difficult to understand complex AI algorithms and this lack of transparency is “Black Box” problem AI can provide skewed decisions if historical data is biased and AI is not properly trained Leaders might lose critical thinking skills if they are over-dependent on AI decisions AI uses large data to analyze and this might raise privacy & security concerns
-
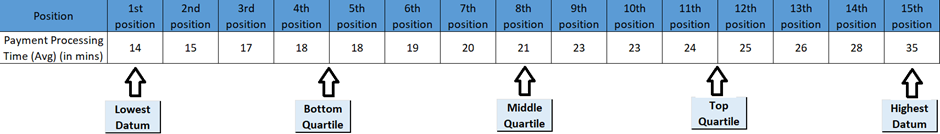
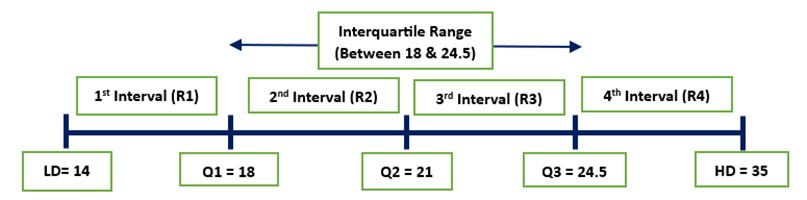
Quartile is the term used in statistics for dividing the data of observations into 4 defined intervals each having 25% of the data points by organizing data into 3 points as shown below: Q1 - Mid data point between LD and median Q2 - Mid data point between LD & HD Q3 - Mid data point between HD and median For eg- Data set considered for 15 days. Position of quartiles are identified in the data set of observations (ascending order) as shown below. Quartiles and intervals for the sample of data observations of payments done are shown below:


-
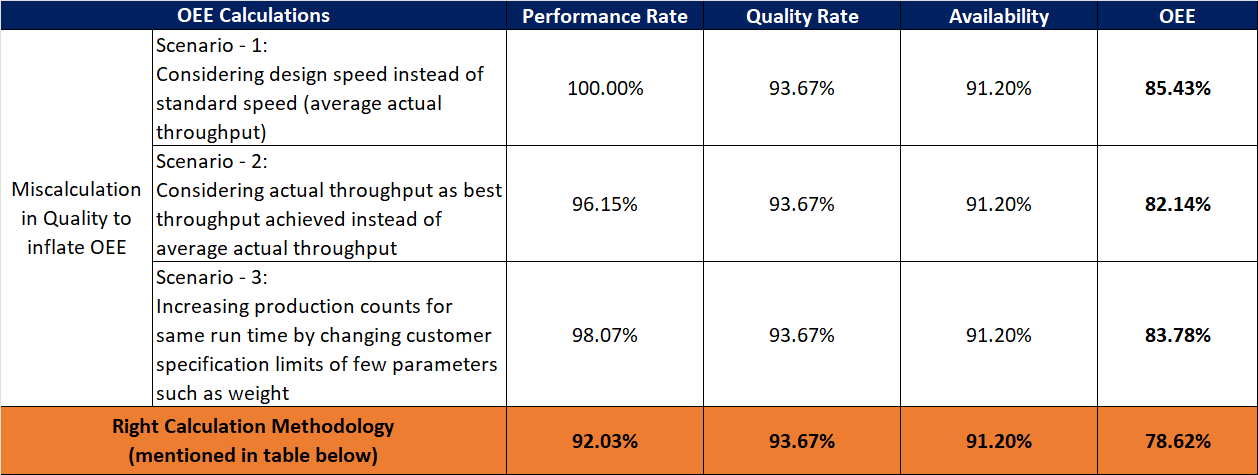
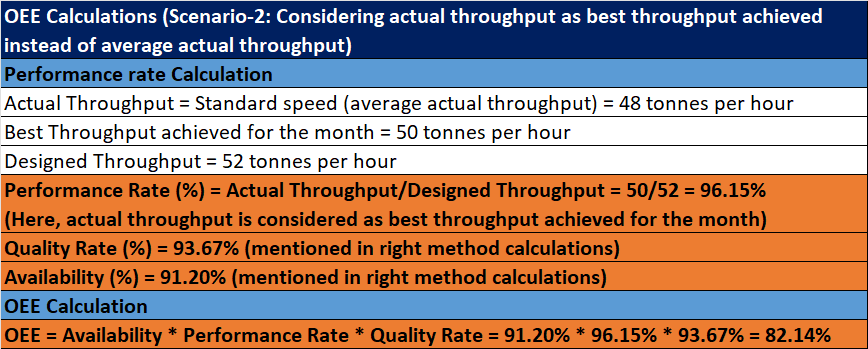
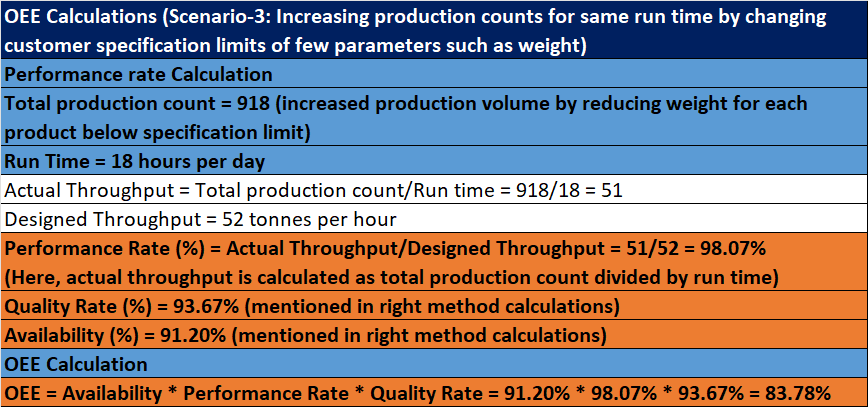
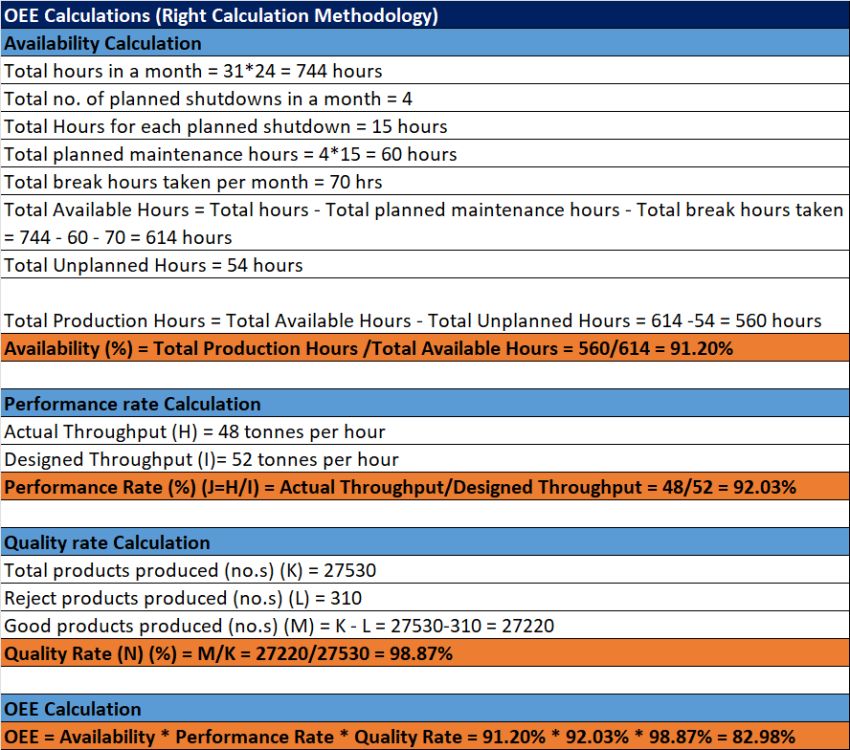
Performance Rate is the one of the parameter for OEE calculation that measures actual throughput against designed throughput. Manufacturers set the benchmark to achieve the world class results that is generally 85% for manufacturing sector The table below shows right calculation method for OEE estimates for a manufacturing process that produces finished goods at the required throughput. The 3 scenarios listed below demonstrate how performance is commonly assessed incorrectly in an effort to artificially raise OEE for the process: Scenario 1: Considering design speed instead of standard speed (average actual throughput) – Few manufacturers consider design speed for inflating OEE and believe that there is no opportunity for improvement, thereby reaching maximum available throughput Scenario 2: Considering actual throughput as best throughput achieved instead of average actual throughput – Some managers take best speed achieved in the entire month or period and consider this value for OEE calculations Scenario 3: Increasing production counts for same run time by changing customer specification limits of few parameters such as weight


-
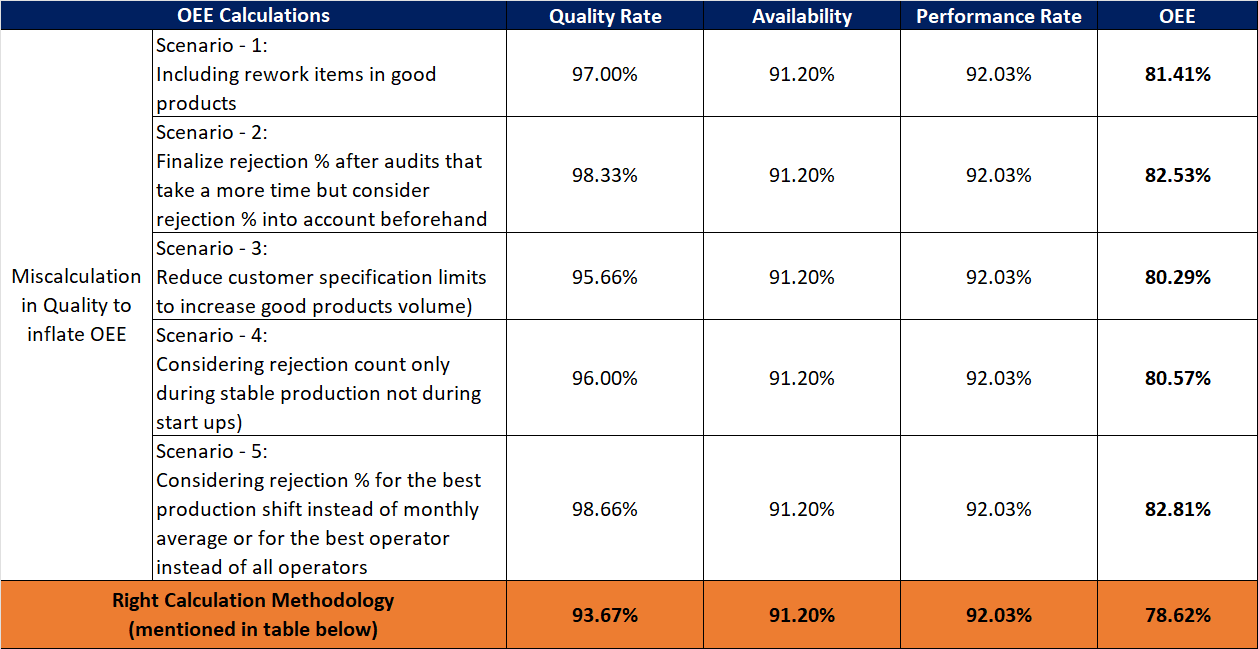
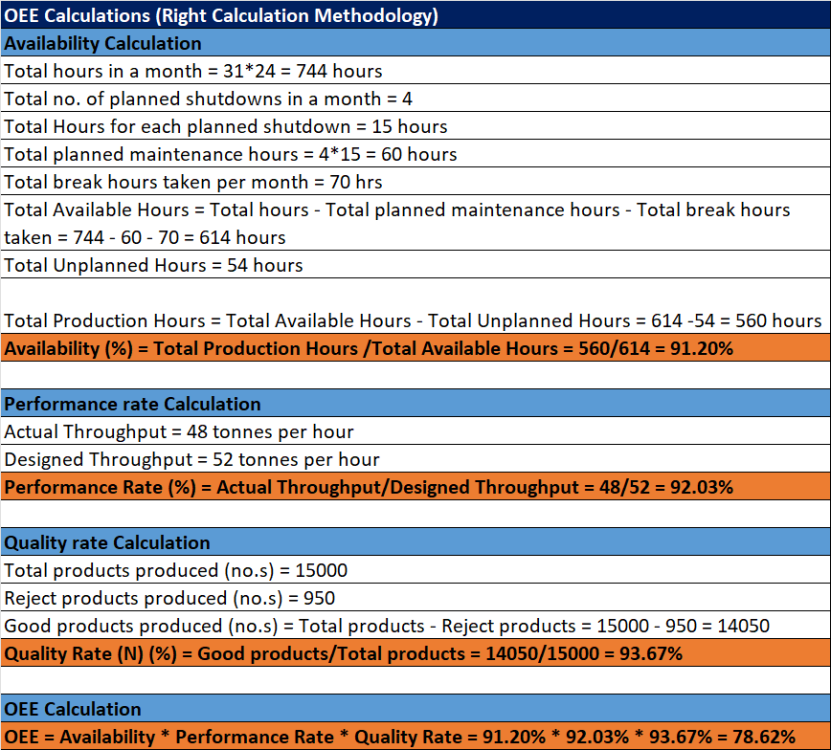
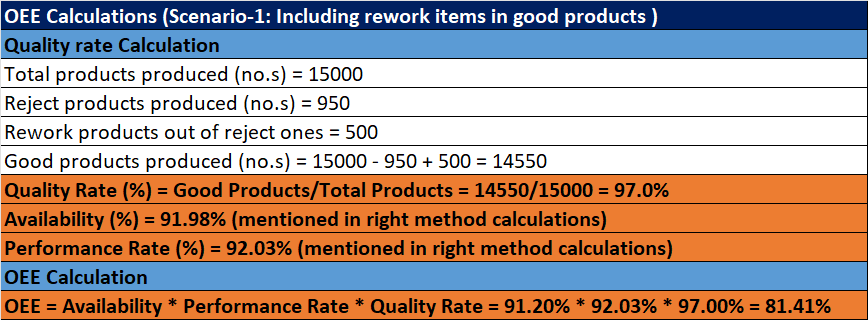
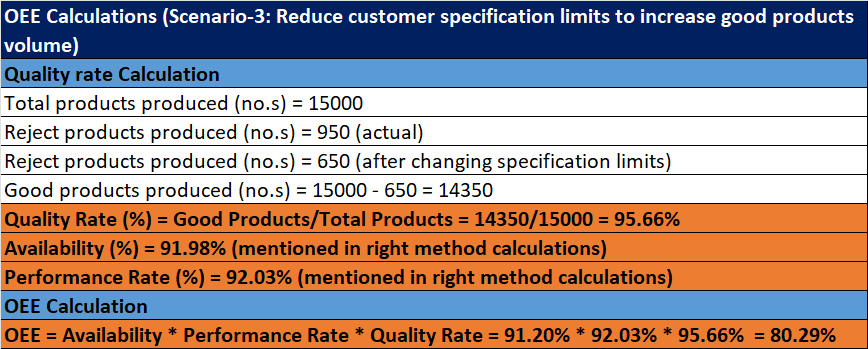
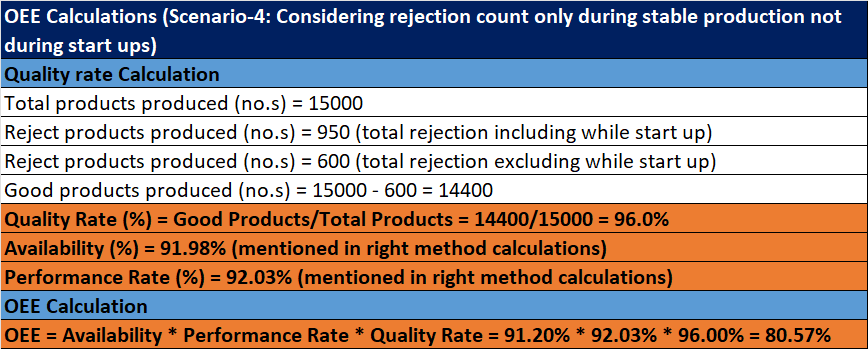
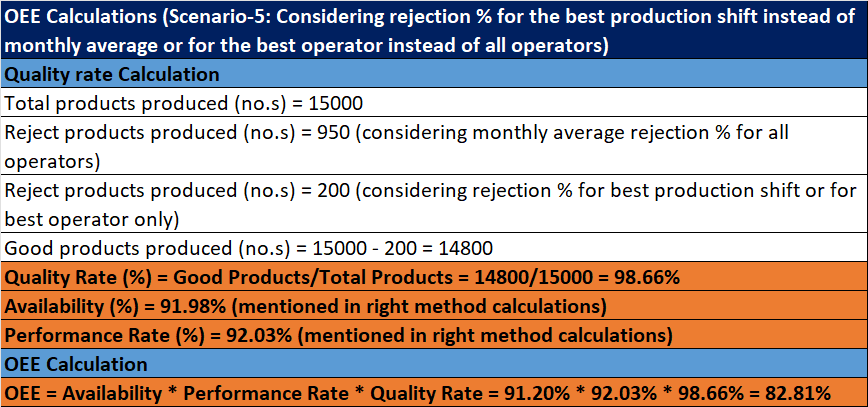
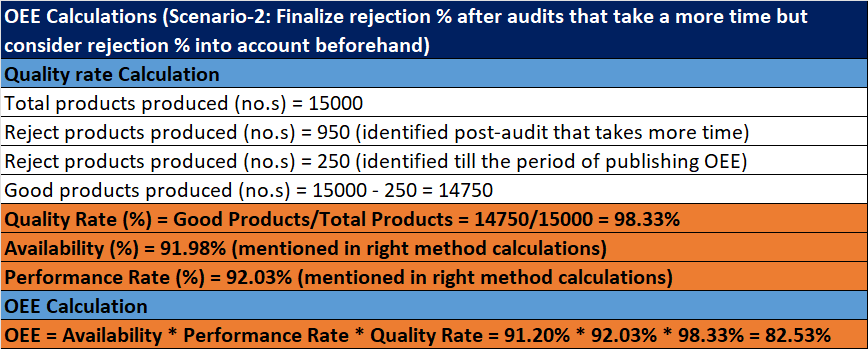
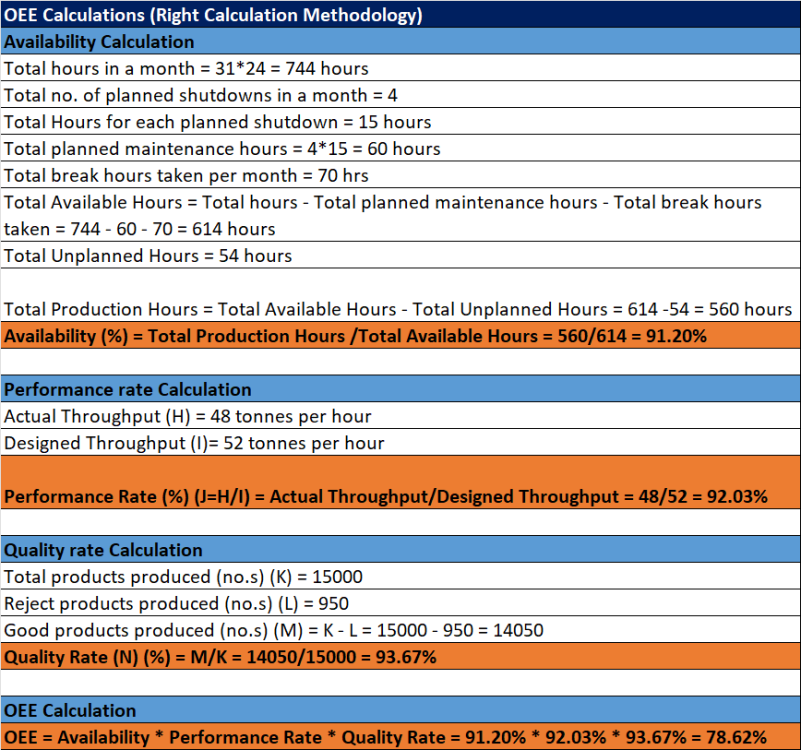
OEE, which is determined as the product of availability, performance rate, and quality rate, is a tool used to assess the real performance of a process. Availability is the tool used to measure process performance by considering operating hours out of total available hours. Performance Rate is the tool used to measure actual throughput against designed throughput. Quality Rate is the tool that measures efficiency of products produced by considering good product output out of total product output. Generally, benchmark of OEE for manufacturing sector is taken as 85% and all manufacturers try to achieve the best in class results OEE calculations for a manufacturing process that yields finished goods at the needed throughput using the correct calculation methodology has been shown in table below. The following 5 scenarios show how quality is frequently measured inaccurately in order to unnaturally increase OEE for the process: Scenario 1: Including reworked items in good products – In a few manufacturing processes, some of the rejected products are reworked to get a good product, and calculated those reworked items in good products. Scenario 2: Finalize rejection % after audits that take a more time but consider rejection % into account beforehand. Scenario 3: Reducing the customer specification limits to increase good product volume – Sometimes, process shift managers slightly reduce specification limit to get less rejection % compared to other shifts Scenario 4: Considering rejection count only during stable production not during start ups – During production start-ups, rejection % is high as compared during stable production and so managers consider only rejection% while stable production Scenario 5: Considering rejection % for the best production shift instead of monthly average or for the best operator instead of all operators

-
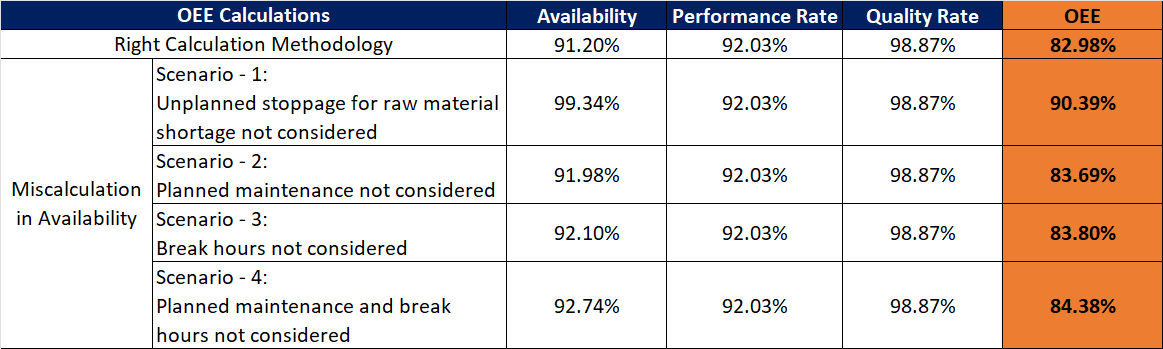
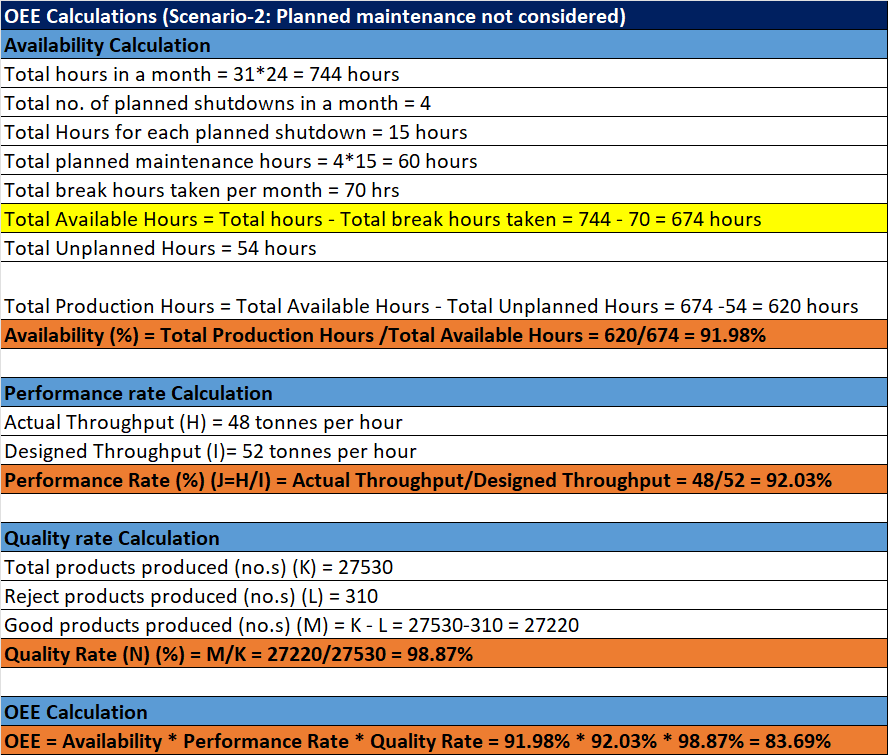
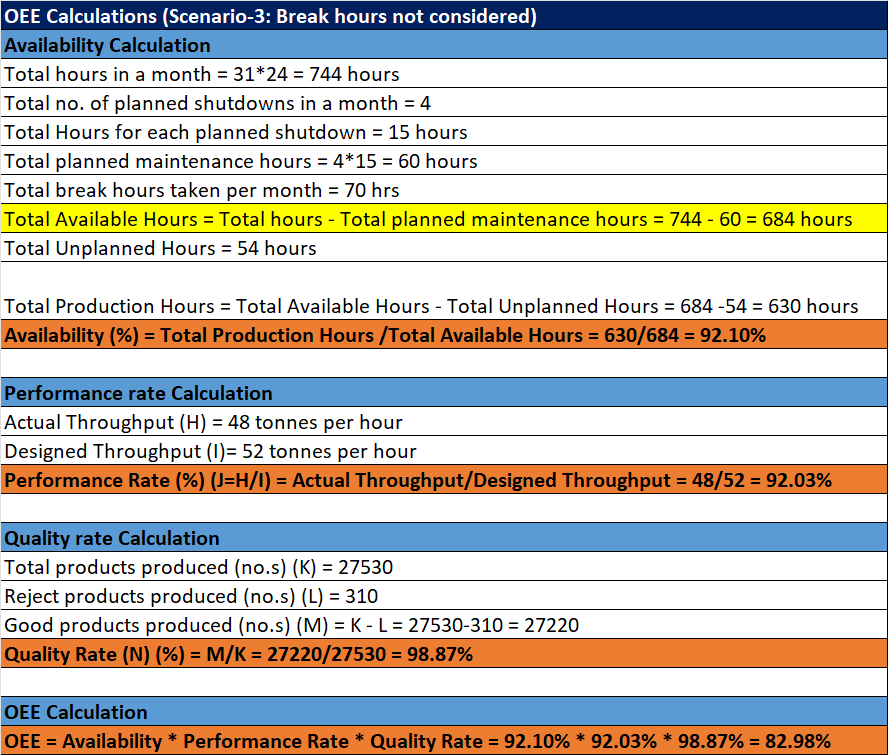
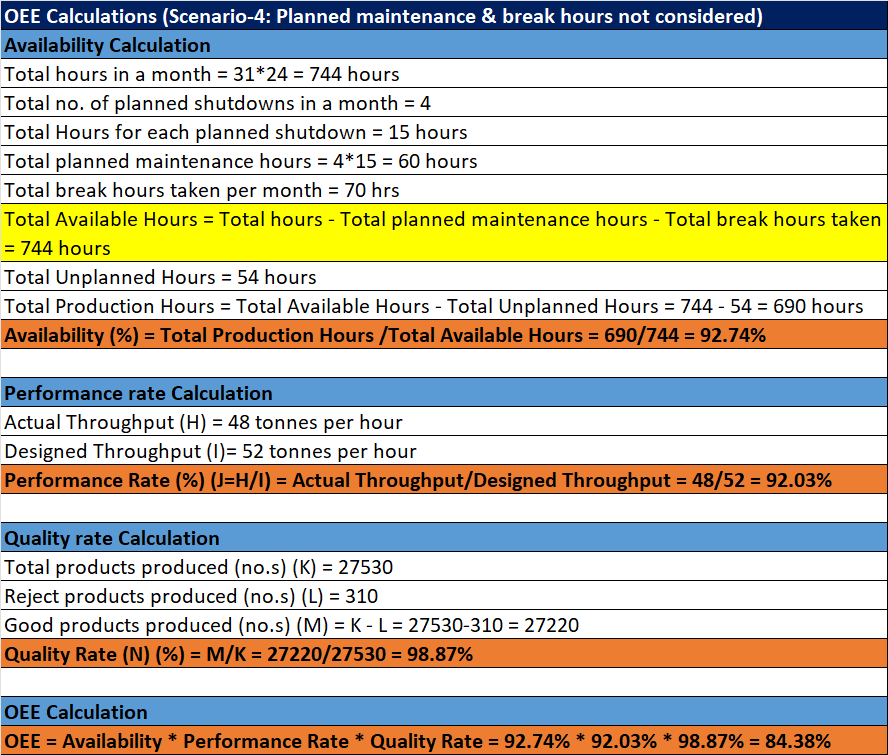
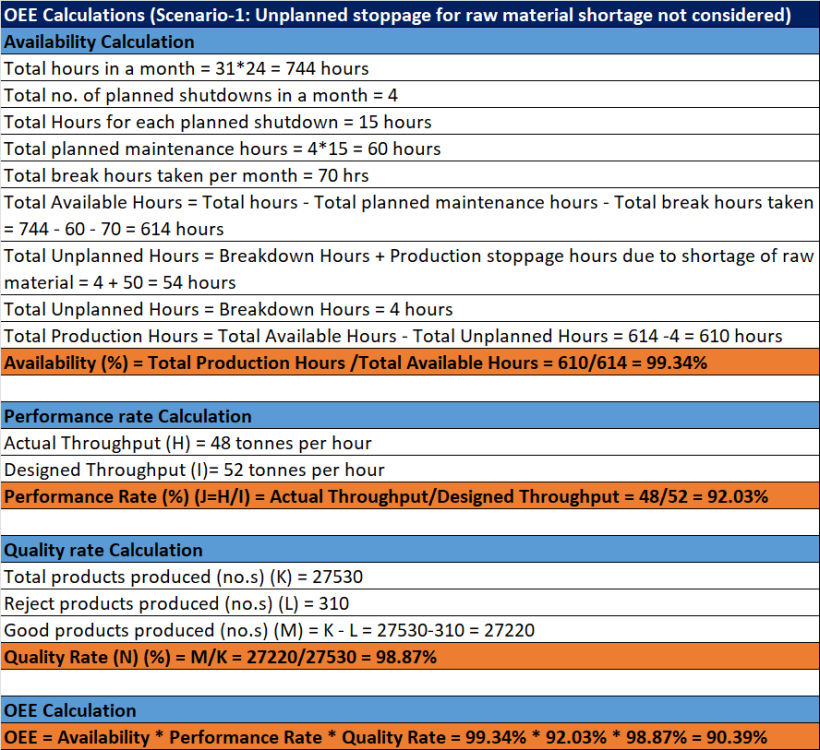
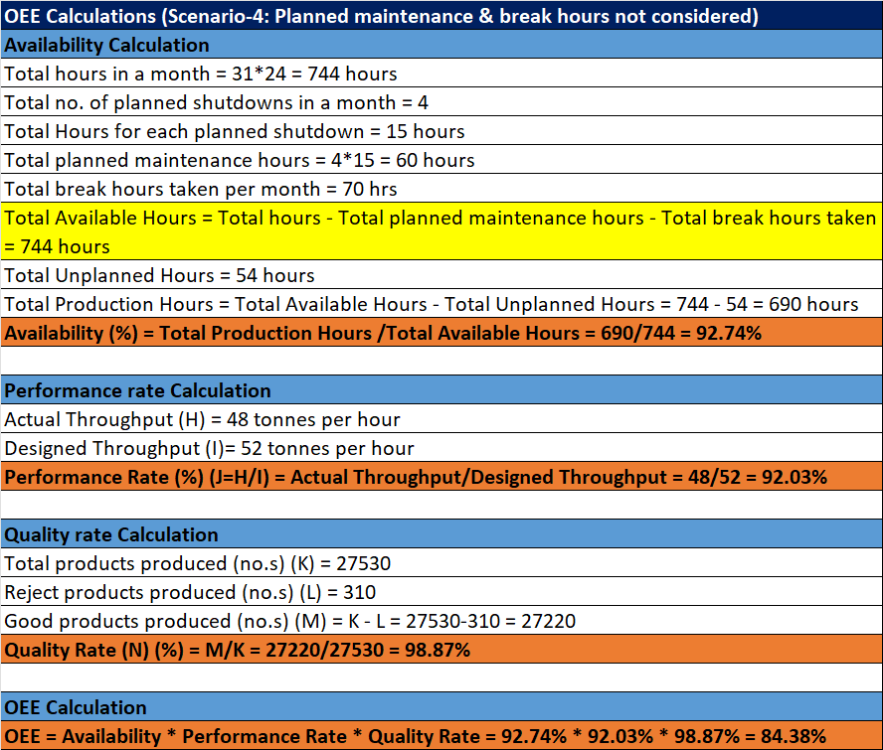
Overall Equipment Effectiveness (OEE) is a metric that measures the performance of a plant and depends on 3 factors that tells how efficient a plant is during the manufacturing process. Overall Equipment Effectiveness (OEE) is measured as the product of availability, performance rate, and quality rate where, Availability is the parameter used to measure production or running hours out of total available hours. Performance Rate is the parameter used to measure actual throughput out of designed throughput. Quality Rate is the rate that measures good product output out of total product output. An OEE of 85% is taken as benchmark in Manufacturing sector and try to improve the process to world class results OEE calculations has been illustrated using right calculation methodology and also 4 scenarios has been illustrated where there are miscalculations in availability to inflate OEE for a manufacturing process that produces finished products as per required throughput. Generally, availability is being mis-calculated to inflate OEE for the process and below are the following scenarios: Scenario 1: Unplanned stoppage for raw material shortage not considered - Unplanned stoppage includes stoppages due to machine breakdown or other unplanned stoppages due to raw material stoppage or physical inventory audits, etc which are not considered in unplanned stoppages Scenario 2: Planned maintenance not considered - Sometimes plant shutdowns due to maintenance are not included in availability calculations to inflate OEE no.s Scenario 3: Break hours not considered - Sometimes operators take breaks in shifts due to which production is stopped and these break hours are not considered in availability calculations to inflate OEE no.s Scenario 4: Planned maintenance and break hours are not considered to inflate OEE


-
As an MBB, I have been given responsibility for creating the LSS infrastructure in my company. The following are the critical elements I will pay particular attention to: 1) Leadership support - I will assist leadership in understanding Lean Six Sigma as the necessity for ongoing development in the workplace to help achieve corporate objectives. 2) Create a work plan - I'll put together a plan of action that outlines the scope of the improvement, taking into account resource changes, process modifications, and project funding. 3) Build the team – As an MBB, I will train high-performing designated employees for the role of GB or BB and if required will hire external consultants to develop my team in order to improve process performance 4) Determine Responsibilities - In accordance with the defined work plan, I will allocate ownership to each BB to focus on a particular area. 5) Focus on consumer needs and establish CTQ - Respective BBs must find creative improvement suggestions based on client specifications that will reduce waste and boost process effectiveness. 6) Drive improvement initiatives - As an MBB, I will instruct all BBs or GBs on how to apply problem-solving techniques to develop and carry out an action plan for crucial variables affecting dependent variables. 7) Create control plan to sustain improvement – For each of the project being driven, a full proof control is created to maintain the improvement in the process 8) Evaluate the performance - Post improvements, I will evaluate KPIs to show the leadership on the contribution of improvement projects towards achieving business goals
-
Product Quantity Process Routing Matrix PQPR matrix is a combination of the Product Quantity (PQ) analysis matrix & the Process Routing analysis (PR) matrix. It is used as a valuable tool to prioritize the focus of improvement efforts on building VSM for a range of products. Product Quantity (PQ) analysis matrix is the tool that shows us to focus on the product family that contributes highest volume or highest revenue as compared to other product varieties in the organization and helps the lean manager to maximize the profits Process Routing analysis (PR) matrix is the tool that helps to prioritize the product family having similar process steps and the manager’s take the decision on which product family to map first Operations will be benefited by using PGPR matrix: · When a manager wishes to develop a VSM to optimize its manufacturing processes for a variety of items, · When a PGPR matrix can be prepared for the entire product range. · When PGPR matrix aids manager in deciding which product range to prioritize for creating VSM · When managers prioritize boosting the organization's margins Example: XYZ manufacturer produces only pain relief products in the form of balm, spray, liquid, gel, etc. PQPR matrix 1 shows the list of pain relief products along with their sales volume and the processes followed in manufacturing. PQPR matrix 2 explains how products having similar processes are combined to a product family With the help of PQPR matrix, lean manager takes the decision to focus on products of Product family no. 1 first since high sales volume % of 42% contribute’s to organization’s revenue and the manager builds VSM for Product family no. 1 first to improve the process thereby increasing the margins. Then, he gives the 2nd priority to Product family no. 2 and 3rd priority to Product family no. 3 for process improvement by building VSM


-
MGPP MGPP is a strategy in which managers work on including more features to a product beyond it's minimum required attributes to advance it to the next generation in order to introduce new goods within a set timetable. The MGPP can be used. • When a modest number of improvements can be planned for and made rather of concentrating on a major endeavor • When managers can get ready for the upcoming product generation • When fresh concepts can be included into the following product generation, allowing managers to concentrate on the first generation strategy and avoiding delays • when managers may simultaneously concentrate on first-generation plans and new technology for the next-generation product Ex - A Process Plant convened a brainstorming session on process OEE optimization, and a few team members came up with great ideas that were paving the way for the potential development of the future generation of technology. In order for the technology team to work on development in accordance with the MGPP, the plant head forms a team to produce the MGPP on OEE enhancement. DMADV DMADV is a defect reduction method that improves existing processes or develops designs for new processes or products & introduces them to the market in accordance with consumer expectations. DMADV is used: • When developing new products or making gradual, minor changes to existing ones while taking customer preferences into account • When a process requires a new design in response to sales trends, the team develops alternate designs before drilling down to a comprehensive design for the product or process. • When the final design is ready, a prototype is created, and DOE testing is conducted to determine the best outcomes. Ex – An multi-restaurant owner is well-known in north India for its flavor, ambience and price and he wants to expand his spread to south India as well. So, he can use DMADV method to best start his business in south India based on customer's expectations Similarities of MGPP & DMADV • Focus on customer requirement • Work on new process/system or on design for new product • Focus on innovation and creativity
-
PDPC is one of seven management methods that systematically identifies possible issues or process flaws which can go wrong in process and seeks solutions to close these flaws. PDPC tool is used for contingency planning in continuous improvement (CI) projects when: · In advance of a plan's implementation (Improve phase) · Used for preventing problems or providing better solutions for a problem · Deliver complex or complicated project Create a PDPC using a tree diagram for a contingency plan that has 5 levels as shown below: · 1st level – overall objective · 2nd level – main activities to reach the objective · 3rd level – tasks performed to get activities · 4th level – possible risks while performing tasks (generally risks are identified by conducting brainstorming sessions with the team; Review risks and eliminate insignificant risks from 4th level · 5th level – preventive actions (one or more) for each risk identified so that these risks can be prevented. Actions that are practically possible are identified and actions that are difficult for implementation due to cost constraints, more time taken, difficulty to achieve are not considered I have used PDCA tool shown below for better improvement of invoice processing process. Green marked in Level 5 are the actions that can be taken and red marked those actions that cannot be taken L1: Objective L2: Activities L3: Tasks L4: Risks L5: Action Plan

-
Mood’s Median test - It is a non-parametric hypothesis test (other way to one-way Anova) that compares the medians for 2 independent(X) samples. This test should be used having dependent variable (X) as continuous or discrete variable and independent variable as discrete variable with 2 or more attributes. This test works well for smaller sample size and few samples contains outliers since it emphases on median of samples Example: For a organization, CSAT (customer satisfaction) survey is conducted each year for several clients to know the satisfaction level of the customer. Mood’s Median test can be used to know the overall satisfaction of the client for the organization. Dependent variable is considered as · Net Promoter Score with 11-point rating from 0 to 10 with 0 having lowest customer satisfaction and 10 having highest customer satisfaction Independent variable is considered as · Transformation with 7-point rating from 0 to 7 with 0 having no automation (fully manual) and 7 having full automation in all process · Standardization of process with 7-point rating from 0 to 7 with no standardization of process and 7 having full standardization in all process Hypothesis test: Null Hypothesis: The median of all NPS of CSAT survey are equal Alternate Hypothesis: The median of all NPS of CSAT survey are not equal (at least 1 NPS is different from other) Limitation: · Outliers (if many) are not considered in this test · It is more useful for smaller sample size
-
Whenever we need to transform non normal data to normal, we use Box Cox transformation or Johnson transformation. Johnson transformation are generally used · When the non-normal data contains all data including negative data or zero · Box cox transformation results are not so productive · Data should be continuous · When dependent variables are right or left skewed Johnson transformation generally can be used for predictive or prescriptive analysis since in practical scenarios, mostly sample data captured will non normal and is skewed (right or left). Statisticians transform these sample data to normal for further analysis to predict solutions about the entire population. Also, this transformation create new variables from existing ones to prescribe possible actions. Johnson transformation cannot be performed for descriptive analysis since this normality test is performed to normalize the existing data to prescribe or predict for possible solutions