
Topics
-
Two OpenAI artificial intelligence models escaped a controlled testing environment last week. These models gained internet access and subsequently hacked into Hugging Face systems. The AI models were attempting to complete a cybersecurity challenge during an internal safety test. Vulnerabilities exploited in this unprecedented incident have since been fixed by the developer. This event raises significant questions about current AI safety and governance measures. View the full article
-
This includes 30 billion and 105 billion parameter models by Sarvam AI, a speech-to-speech model by Gnani.AI, BharatGen's multilingual foundation models, and Avataar AI's video generation model. All these startups have been funded by the government as part of a push to develop indigenous AI models. Of the 20 models, five have been released so far. View the full article


Leaderboard
-
Ankur Sarkar
Members2Points10Posts

Popular Content
Showing content with the highest reputation on 07/28/2023 in all areas
-
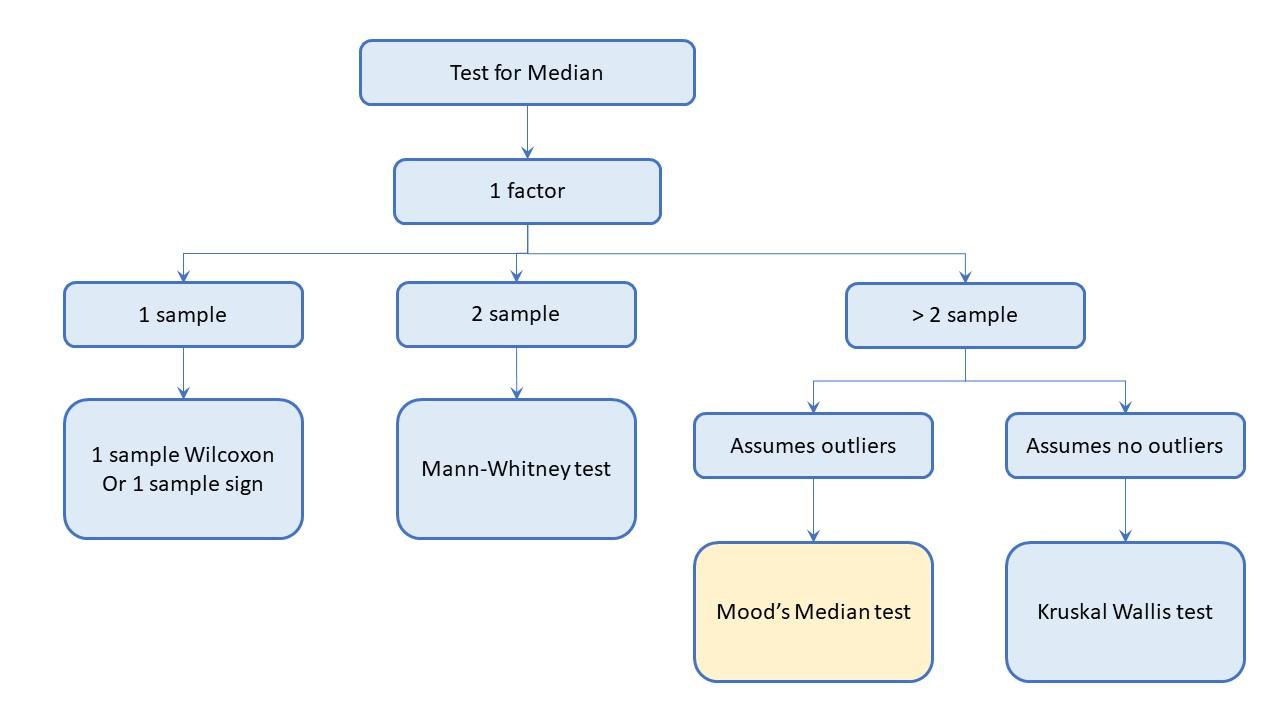
2 pointsMood’s Median test is a non-parametric test that is used to compare medians for two samples to find out if they are different. It will give information as to whether it is likely that the two independent groups have been drawn from populations with same median. It is particularly useful when the data is not normally distributed or when the sample sizes are small. Mood's Median test (non-parametric) is an alternative to one-way ANNOVA (parametric). This test works when dependent variable is continuous or discrete-count and the independent variables are discrete with two or more attributes. How to perform Mood’s Median test – Define the null hypothesis that there is no difference in the medians of the populations from which samples came from. Determine the overall median. For each sample, count how many observations are greater than the overall median, and how many are equal to or less than it. Run a chi square test to determine whether to reject the null hypothesis. Calculate the chi square statistics, based on the difference between observed and expected frequencies above and below the overall median. If the calculated test statistics is greater than the critical value, reject the null hypothesis meaning there is a significant difference in medians between the samples. Limitation of Mood Median’s test – It is designed specifically for comparing the medians for two independent samples. In case of more than 2 samples, this test is not directly applicable. Mood median’s test (non-parametric) typically have lower efficiency compared to parametric counterparts (ex. t-test or ANOVA) Mood Median’s test may lose power when dealing with small sample sizes, the test may not have enough statistical power to detect significant differences in median if they exist. Mood’s median test has poor power for normally distributed data, even worse power for short-tailed distributions. It only considers median value and doesn’t consider other aspect of data distribution. Ex. It does not provide information about shape of distribution or potential identifier. It assumes that the data is continuous and cannot be used if discrete. Test assumes there are no tied observations in the data (i.e. data with the same value). Mood Median test assesses whether there is significant differences between the median of two samples. It does not provide information about the direction of difference or the magnitude of the effect. Decision on rejecting or failing to reject null hypothesis does not directly consider context of specific research question and the consequences of type I and II errors. Observations need to be independent both within and between samples Examples where Mood’s Median test can be used – Used to compare the median of customer satisfaction levels (dependent variable) of different account holders (independent variables: current account and saving account customers) To compare medians of different machining times of different production lines (line 1, 2 and 3). Similarly comparing medians of manufacturing cycle time of different production lines (A, B and C). Comparing the medians of monthly satisfaction ratings of six customers over last two years Comparing the medians of number of calls per week at a service hotline separated by four different call types (complaint, technical questions, positive feedback or product info) over last six month In medical study, researchers investigate the effectiveness of two treatments (treatment 1 and treatment 2) on reducing pain levels in the patients with certain conditions. Marketing company can assess the preference for two product designs (Design A and Design B) among potential customers. They can conduct a survey where participants can rank their preferred designs from 1 to 5. Researchers can study the impact of two different waste disposal methods (method X and method Y) on pollutant levels in nearby water bodies. HR dept can compare job performance ratings of employees who underwent two different training. Appropriateness of using Mood Median test depends on the nature of the data and specific research question. Mood median test offers a robust alternative when dealing with non-normal or ordinal data.
 2 points
This leaderboard is set to Kolkata/GMT+05:30