Ankur Sarkar
Members
-
Joined
-
Last visited
-
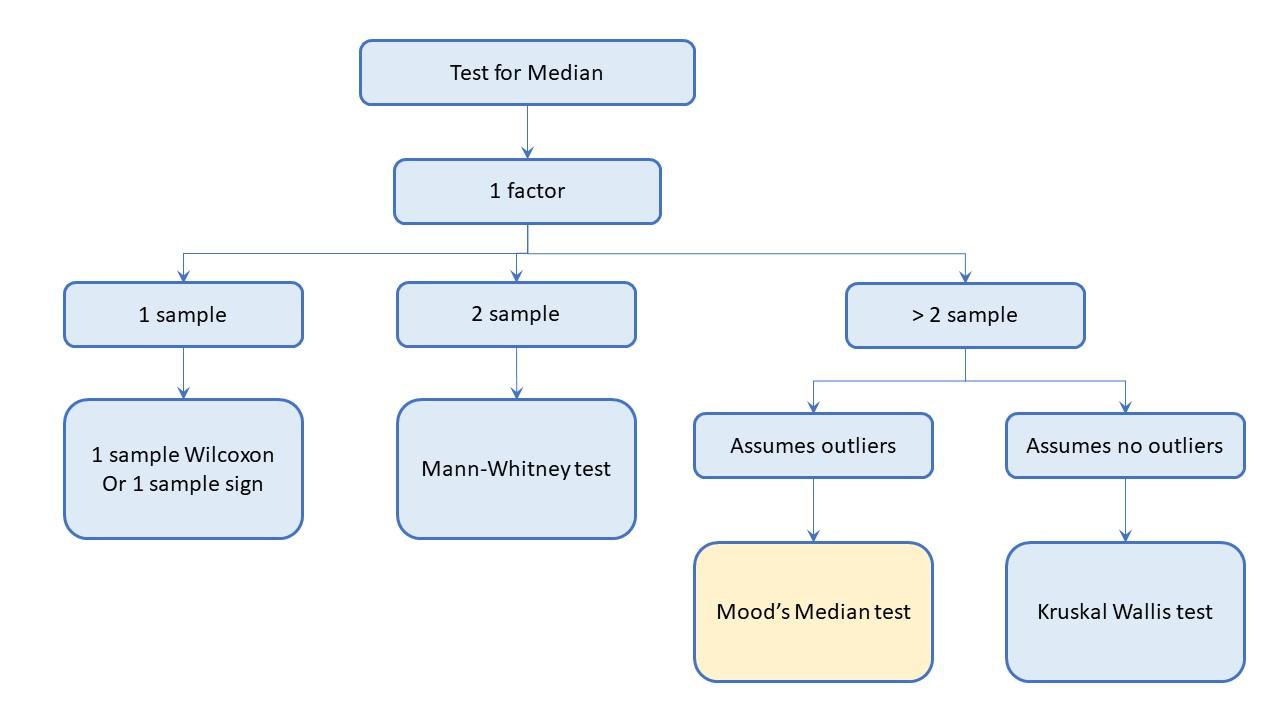
Kruskal-Wallis test Mood’s-Median test Number of groups Non-parametric test used to compare medians of two or more groups. Ex. Comparing exam scores of 3 groups. Kruskal Walley test will rank all exam scores from the combined three groups and calculate test statistics. Mood's Median test is not applicable in this scenario as it is specifically designed for comparing exactly two groups. Non-parametric test used to compare medians between exactly two independent groups. Ex. Comparing satisfaction ratings of two group (before and after service improvement). In comparing exactly 2 group, we can use Mood’s Median test and also Kruskal Walley test. Applicable scenario Appropriate when there are three or more independent groups Ex. Comparing median weight of three different new born babies. Comparing the median employees in three different departments basis their performance rating. Comparing the median number of errors made by students in three different math classes. Suitable when you have exactly two independent groups Ex. You are comparing the median scores of students on a math test before and after receiving tutoring. You are comparing the median heights of men and women. You are comparing the median number of days spent in hospital for patients with different types of cancer Ranking process It assigns a rank to each observation with the smallest observation getting the rank of 1 while the largest observation getting the rank of the total number of observations. These allotted ranks are used to compute the test statistics as a difference in the median between different samples. Observations greater than median gets assigned a rank of 1. Observations equal to median gets assigned the rank of 0 while the ones smaller than median gets assigned the rank of (-1). It assigns rank basis if the observation is larger or smaller than overall median and these allotted ranks are used to calculate test statistics. Assumptions Groups being compared have similar shapes and variances. It does not assume specific data distribution. It assumes that the data from each sample is drawn from a continuous distribution (continuous like weight in kilograms or ordinal like Likert scale) It does not make any assumption about the shape of the distribution. Ex. Determine whether or not 3 drugs have different effect on knee pain in scale of 1 to 100. It is a distribution independent test and does not assume any specific distribution for the data. It assumes that the data for each sample is drawn from a symmetric distribution. It assumes data for each sample comes from populations with a continuous rather than discrete distribution. The distributions of populations the samples were drawn from all have same shape. Ex. Determine if there exists statistical difference in sales volume between 2 cities. Handle ties Robust in handling ties naturally owing to its ranking procedure Can be less robust to ties specifically in small samples Outliers Kruskal Walley test is more sensitive to outliers than Mood’s Median test as Kruskal Walley test takes into account the ranks of all observations. Few outliers in data can impact the ranks of other observations leading to incorrectly rejecting the null hypothesis. Mood's median test is more robust to outliers than the Kruskal-Wallis test, but is less powerful in the absence of outliers. Mood’s median test takes into account whether an observation is smaller or larger than the median. Power Usually more powerful than Mood's Median test. Less robust than Kruskal Walley test. Sample size With larger sample size tends to have higher statistical power It can still be applied to smaller samples but with reduced power Generally more suitable for smaller sample size; less powerful with larger sample sizes Post hoc testing (determine where difference lies) If Kruskal Walley test indicates a significant difference among the group, post hoc tests can be conducted to determine which specific groups differ significantly from each other Mood's Median test is not typically followed by post hoc tests since it only compares two groups directly
-
Mood’s Median test is a non-parametric test that is used to compare medians for two samples to find out if they are different. It will give information as to whether it is likely that the two independent groups have been drawn from populations with same median. It is particularly useful when the data is not normally distributed or when the sample sizes are small. Mood's Median test (non-parametric) is an alternative to one-way ANNOVA (parametric). This test works when dependent variable is continuous or discrete-count and the independent variables are discrete with two or more attributes. How to perform Mood’s Median test – Define the null hypothesis that there is no difference in the medians of the populations from which samples came from. Determine the overall median. For each sample, count how many observations are greater than the overall median, and how many are equal to or less than it. Run a chi square test to determine whether to reject the null hypothesis. Calculate the chi square statistics, based on the difference between observed and expected frequencies above and below the overall median. If the calculated test statistics is greater than the critical value, reject the null hypothesis meaning there is a significant difference in medians between the samples. Limitation of Mood Median’s test – It is designed specifically for comparing the medians for two independent samples. In case of more than 2 samples, this test is not directly applicable. Mood median’s test (non-parametric) typically have lower efficiency compared to parametric counterparts (ex. t-test or ANOVA) Mood Median’s test may lose power when dealing with small sample sizes, the test may not have enough statistical power to detect significant differences in median if they exist. Mood’s median test has poor power for normally distributed data, even worse power for short-tailed distributions. It only considers median value and doesn’t consider other aspect of data distribution. Ex. It does not provide information about shape of distribution or potential identifier. It assumes that the data is continuous and cannot be used if discrete. Test assumes there are no tied observations in the data (i.e. data with the same value). Mood Median test assesses whether there is significant differences between the median of two samples. It does not provide information about the direction of difference or the magnitude of the effect. Decision on rejecting or failing to reject null hypothesis does not directly consider context of specific research question and the consequences of type I and II errors. Observations need to be independent both within and between samples Examples where Mood’s Median test can be used – Used to compare the median of customer satisfaction levels (dependent variable) of different account holders (independent variables: current account and saving account customers) To compare medians of different machining times of different production lines (line 1, 2 and 3). Similarly comparing medians of manufacturing cycle time of different production lines (A, B and C). Comparing the medians of monthly satisfaction ratings of six customers over last two years Comparing the medians of number of calls per week at a service hotline separated by four different call types (complaint, technical questions, positive feedback or product info) over last six month In medical study, researchers investigate the effectiveness of two treatments (treatment 1 and treatment 2) on reducing pain levels in the patients with certain conditions. Marketing company can assess the preference for two product designs (Design A and Design B) among potential customers. They can conduct a survey where participants can rank their preferred designs from 1 to 5. Researchers can study the impact of two different waste disposal methods (method X and method Y) on pollutant levels in nearby water bodies. HR dept can compare job performance ratings of employees who underwent two different training. Appropriateness of using Mood Median test depends on the nature of the data and specific research question. Mood median test offers a robust alternative when dealing with non-normal or ordinal data.

-
Definition - Mixture design is a type of experimental design used when the factors being studied are proportions or compositions of multiple components that make it up. The sum of proportions of components is usually equal to 1 for each experimental run. This constraint makes the design and analysis of mixture experiments more challenging, but it also allows for more precise estimation of the effects of the different components on the response variable. The goal of mixture design is to determine the optimal combination of components leading to desired outcomes. It enables researchers to understand the effects of changing the proportions of components on the response variable and with these varying proportions, researchers can analyze the main effects, interactions, and non-linear effects of the components in the mixture. Different type of mixture designs exist – simplex, simplex centroid, extreme vertex. Key difference between mixture design and other broad type of DOEs are – In factorial design and RSM, factor levels are completely independent of each other. Ex. Temperature, speed, material type In mixture design, there are ingredients (or components) instead of factors. Equivalent of levels in fractional DOE is proportion of components in mixture design If the proportion of one ingredient is changed then the proportions of atleast one ingredients has to be changed to compensate (means there is interdependence of proportion of ingredients) Advantages of mixture design over traditional methods in DoE – It allows more efficient use of resources by considering the proportion of components rather than testing each component separately. It is effective at capturing interactions between components in a mixture as well as non-linear effects. Traditional designs often assume additivity (effect of different components are not confounded) which may not hold true for mixtures. Mixture designs provide a more accurate representation of complex relationships between components. Optimizing formulation by allowing exploration of component proportions to optimize the desired characteristics of the mixture. It can handle various constraints such as the requirement that the proportions sum to a constant value (e.g 1) Mixture designs can handle both continuous and categorical components in the mixture. It is statistically efficient in terms of estimating the effects of components and their interactions. The design can provide precise parameter estimates with fewer experimental runs compared to traditional designs. Examples - Mixture designs are commonly used in various fields such as product development, formulation optimization, industrial process optimization and market research. Examples where mixture designs are valuable – A cosmetic chemist while formulating a new skincare product, can use mixture design to determine optimal proportions of active ingredients, preservative, oil, surfactants, emulsifiers, fragrances, etc. can be determined to achieve desired texture, sensory attributes, efficacy. In developing a new recipe for a sauce, the ideal ratios of spices, herbs, etc. can be determined to achieve desired taste. In pharmaceutical manufacturing, mixture design can be used to determine optimal proportions of different raw materials APIs, excipients in drug formulation to maximize yield, control impurities. In formulating pesticides or fertilizers, the proportions of active ingredients carriers, surfactants, nitrogen, phosphorous, potassium, etc. can be optimized to control effective pest control, crop yield or desired nutrients level while minimizing environmental impact. Paint formulation optimization – the components pigments, binders, solvents, additives, etc. can be optimized to achieve desired properties such as color, gloss, durability, drying times. Determine the optimal proportions of various components to achieve desired concrete properties such as strength, workability, durability with the comprising components of cement, aggregates (sand and gravel), water and sometimes additives. In order to optimize the tensile strength of stainless steel, the factors would be proportion of iron, copper, nickel, chromium in the alloy. The mixture components are subject to the constraint that they must sum to one. In order to optimize the formulation of automotive clear coat paint. It’s a 3 component mixture of monomer, crosslinker, resin. 5 <= A – monomer <= 25, 25 <= B – crosslinker <= 40, 50 <= C – resin <= 70 with constraint that A + B + C = 100. In all the examples above, mixture design is ideal because it allows to study components simultaneously and study their combined effect. Researchers can use simplex centroid or simplex lattice design (type of factorial designs used for mixture designs) to identify specific combinations. Feature Simplex Centroid Simplex Lattice Location of design points Boundaries of simplex factor space Interior of simplex factor space Efficiency Less efficient More efficient Number of design points 2p - 1 3p - 3
-
Johnson Transformation is preferred over Box Cox Transformation when the data has high or low skewness and kurtosis. High skewness means distribution curve has longer tail on one end and shorter tail on the other. Kurtosis is used to described shape of probability distribution. Higher kurtosis refers to t-distribution with sharper peak and heavier tails compared to normal distribution. Lower kurtosis (platykurtic) refers to flatter peak and thinner tails. Johnson Transformation can handle a wider range of distributions than Box Cox Transformation. Johnson transformation can be considered as an alternative when Box Cox transformation does not achieve the desired result. Box Cox transformation is limited to transforming data with positive values to fit a specified distribution shape such as normal, log-normal or gamma distribution. Once the data has been transformed using Johnson Transformation, most statistical analyses can be performed on the transformed data as if it was normally distributed. However, the interpretation of the results need to be confirmed and validated in the context of original data. Conditions where Johnson transformation is preferred over Box Cox transformation: If the data exhibit non-normality, including high skewness and kurtosis and the Box Cox transformation does not sufficiently normalize the data. It can handle situations where the data does not conform to common distributions assumed by Box Cox transformation (ones with positive skewness such as log-normal, gamma, exponential and Weibull distribution). Johnson transformation can accommodate broader range of distribution shapes with high or low kurtosis or skewness. If the data exhibits multi-modality, has got multiple peaks and clusters Johnson distribution is more suitable as it can handle both positive and negative values. Unlike Box Cox transformation where it assumes positive data values in order to apply logarithmic and power transformations. Once the data has been transformed using Johnson transformation, various statistical analyses can be performed just like with normally distributed data. Descriptive statistics such as mean, standard deviation, median and quartiles Parametric hypothesis tests such as t-tests or analysis of variance (ANOVA) Process capability analysis to assess whether a process meets specification limits, such as Cp and Cpk, which assumes normality in process data Regression models to examine the relationship between dependent variables and one or more independent variables. Confidence intervals for population parameters (e.g. mean, proportion) based on transformed data However, it is important to note that the interpretation of the results on transformed data may differ from the original scale. To ensure meaningful conclusions it is generally necessary to transform data back to original scale. First, understand the purpose and rationale behind data transformation and consider how the transformation affects the distribution, scale and interpretation of data. Conduct necessary statistical analysis, modeling or computation using the transformed data. Examine the outcomes and draw conclusions based on transformed data. Transform results back to original scale Determine the type of Johnson transformation (SU, SB, SL, Sb) that was applied to the data Obtain the transformation parameter lambda, gamma, xi, delta value Apply inverse transformation formula involving parameters and transformed data points Confirm the validity and relevance of the findings in the context of the original data set.
-
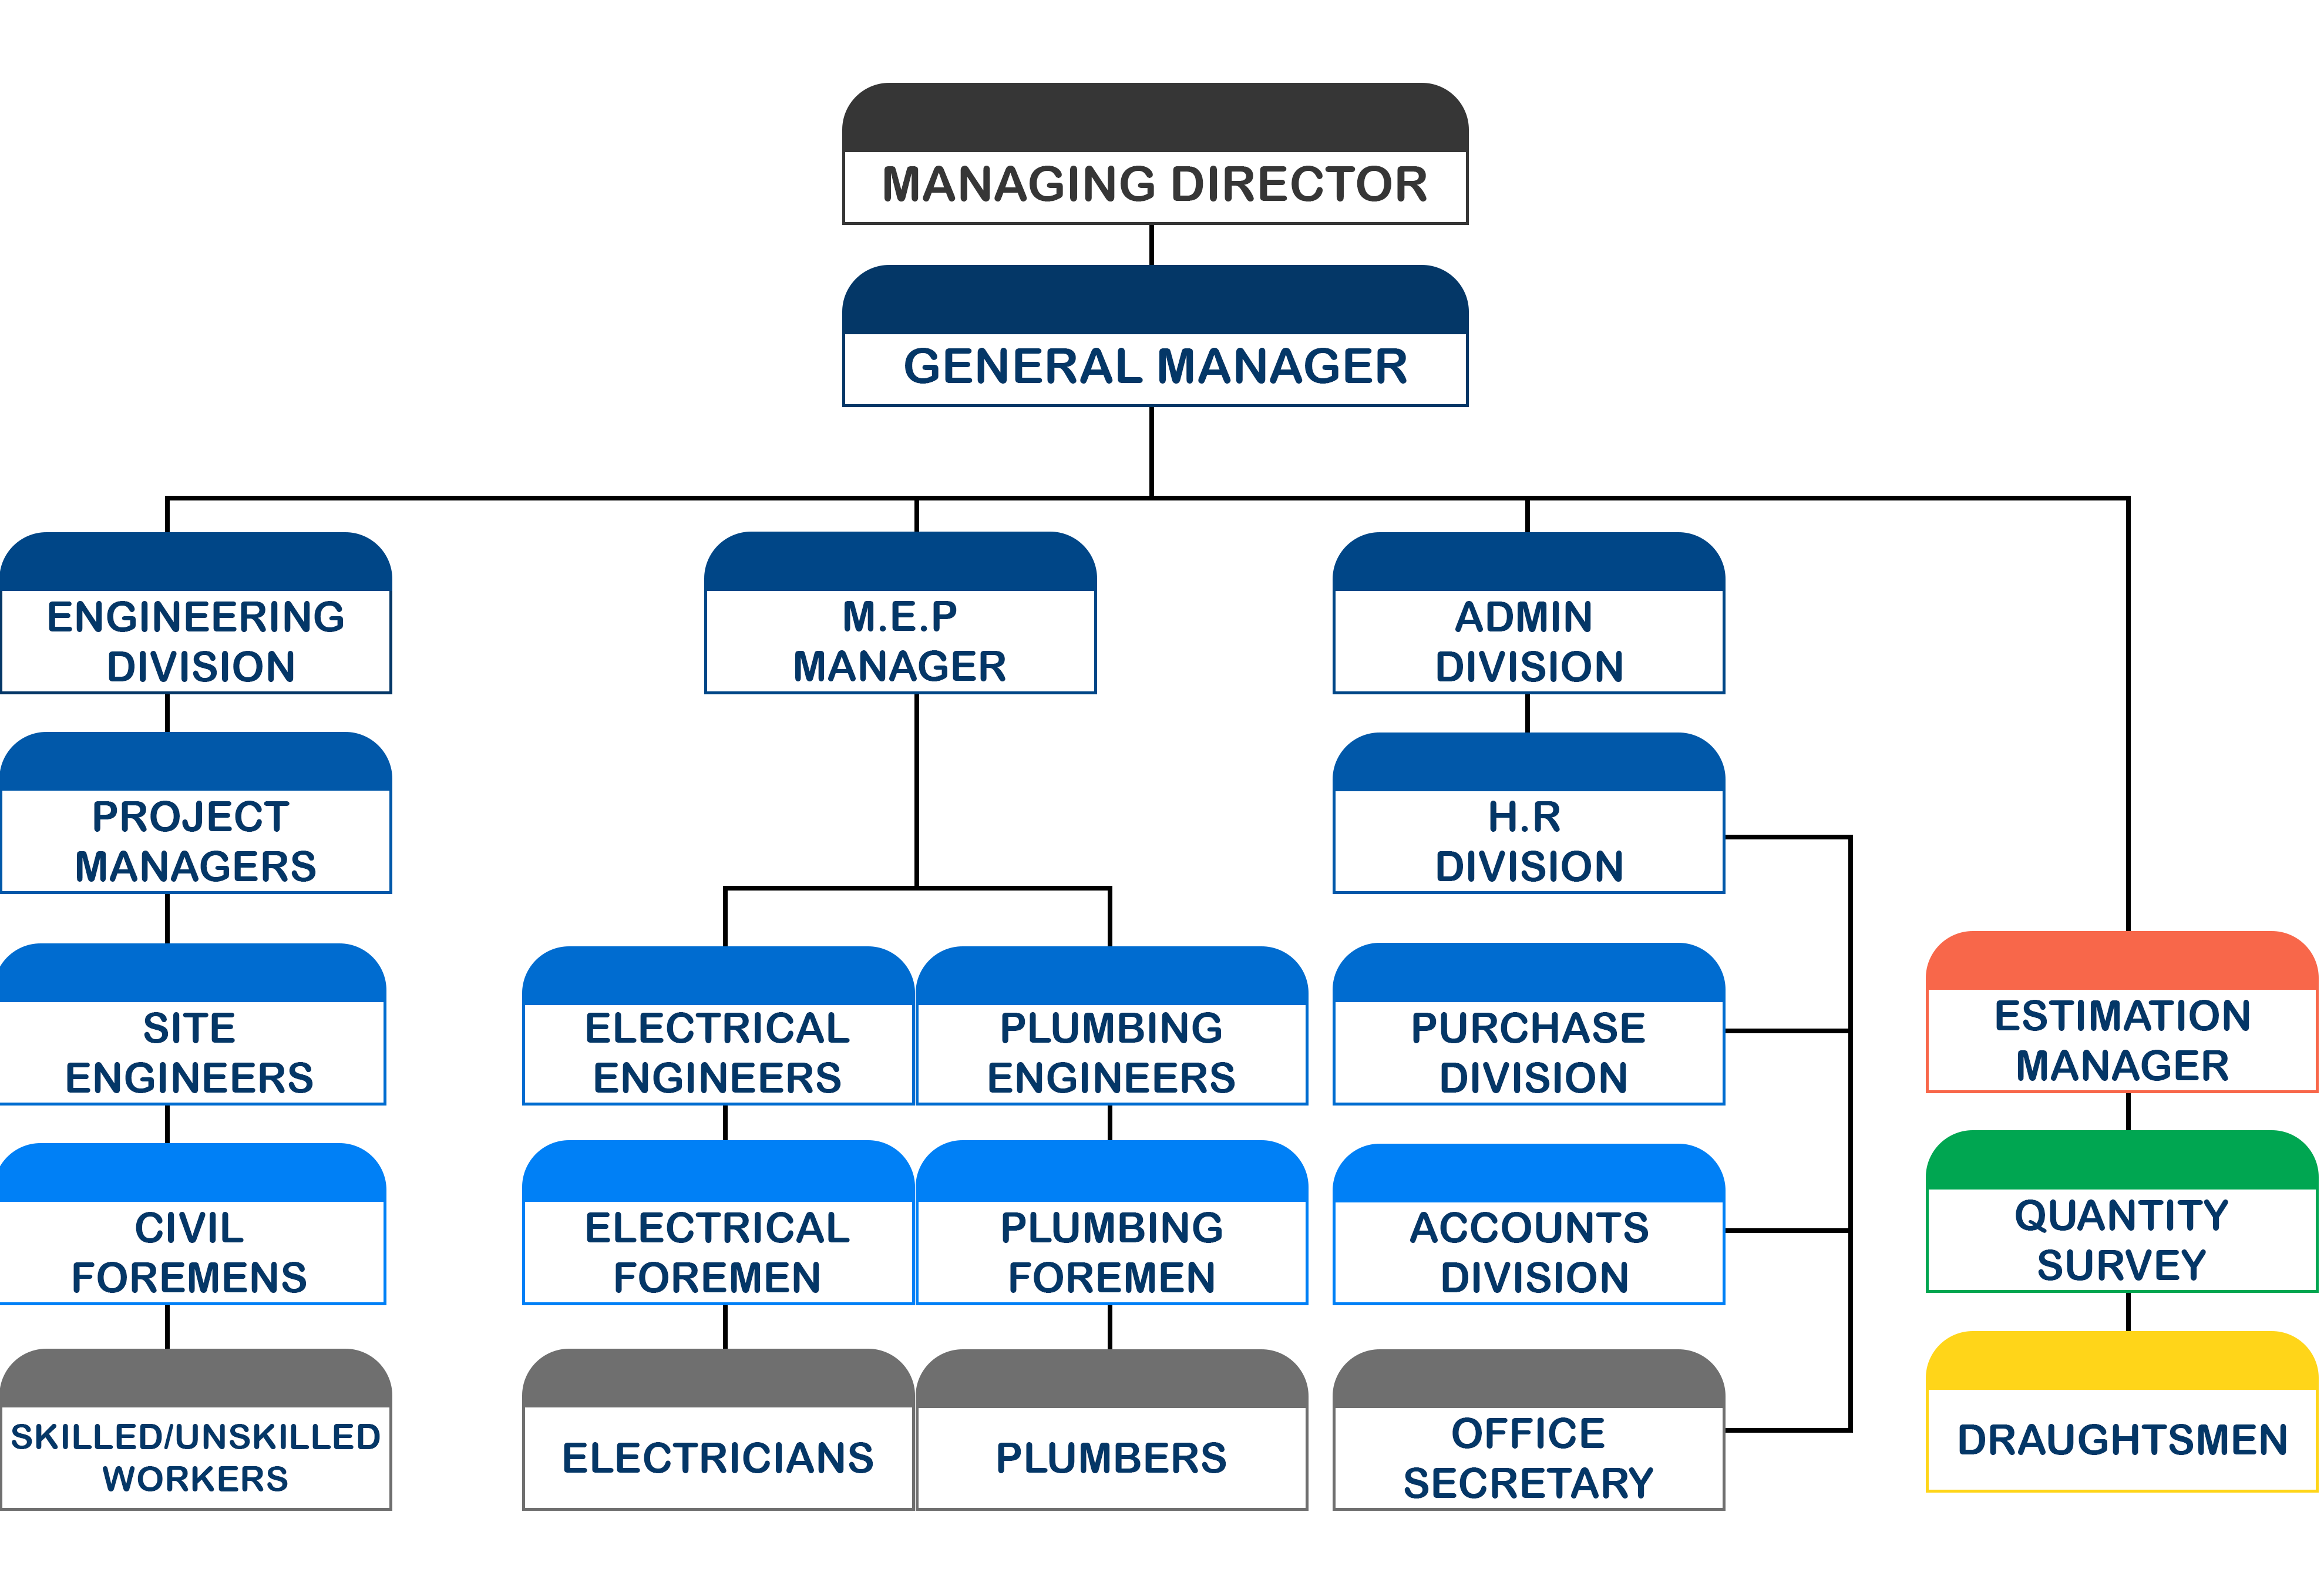
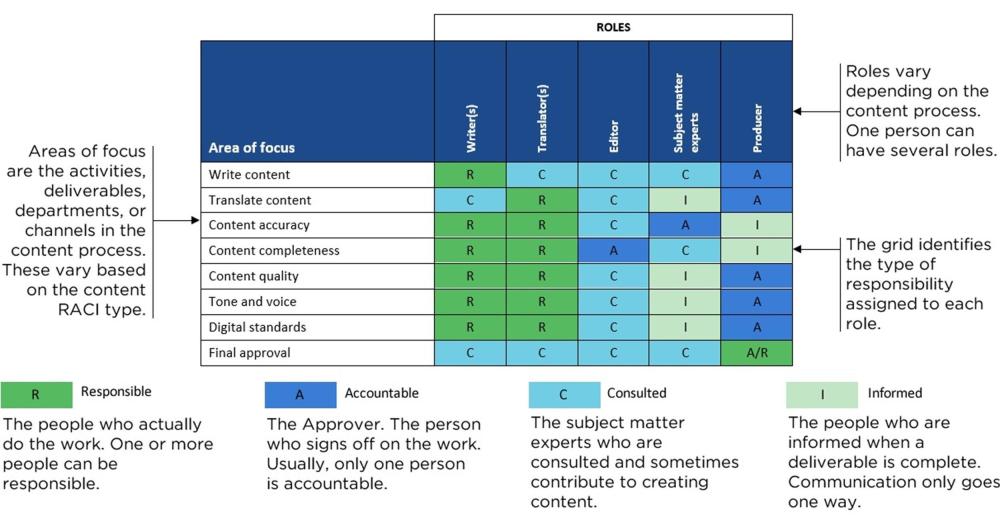
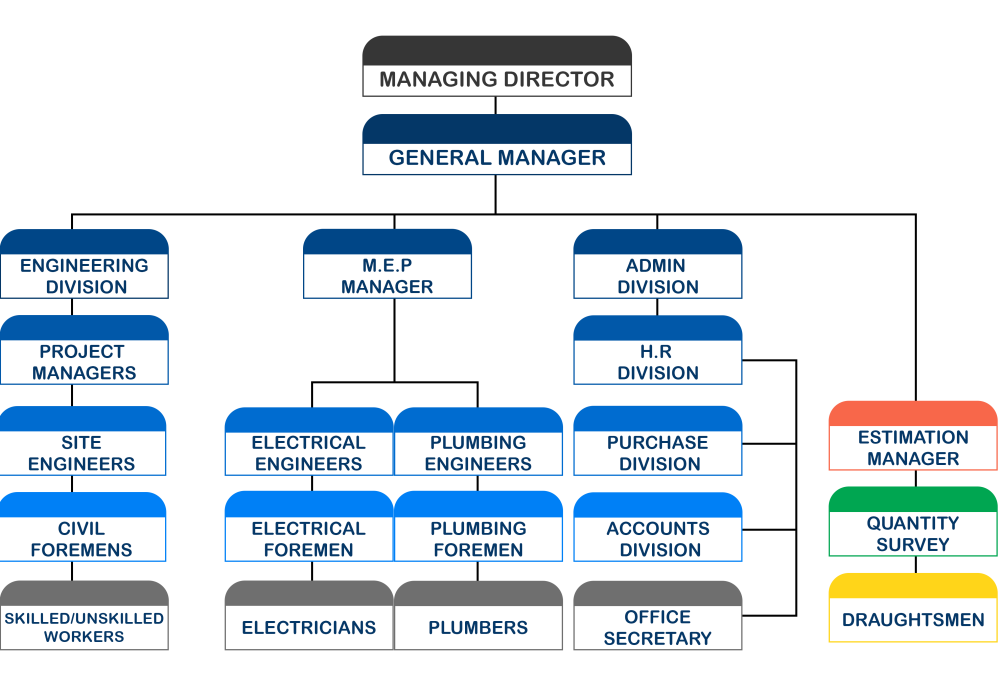
Accountability Diagram (also known as RACI - Responsible, Accountable, Consulted, Informed) matrix – it’s a visual representation of the roles and responsibilities within a team or organization. Its similar to organization hierarchy chart where it shows the reporting structure, but it goes beyond by outlining the specific task and function that each person is responsible for. Comparison - Organization hierarchy chart represents overall structure of an entire organization, displaying various departments, positions and reporting relationships across the organizations. Organization hierarchy chart is used to provide a broader overview of overall structure and reporting relationship within an organization, organization planning and corporate communication. Accountability diagram represents project, process or task within an organization and provides a detailed breakdown of individual responsibilities. It includes detailed breakdown of individual responsibilities for that particular scope. Accountability diagram is commonly used in project mgmt., process improvement. Impact to stages of team formation - Accountability diagram is a useful tool for any team or organization looking to improve communication, minimize confusion and increase productivity. Teams can move through the stages of team formation quickly by providing clarity and structure. Forming (beginning of the team formation process) – it gives clarity about other members and their roles and responsibilities. For example, in software development team, one team member is responsible for front end development, another for back-end development, another for QA. By visually representing these roles and accountabilities, team members can quickly align and start collaborating on their respective tasks. Storming (conflicts and disagreements may arise as team members express opinions and ideas) – it minimize conflict by clarifying who is responsible for what. Referring to accountability diagram would remind team members of their individual responsibilities. For example, in marketing team, the accountability diagram may highlight that the team leader has the final decision making authority for campaign strategies. In case of conflict with team members, the diagram may show that they should first attempt to resolve the issue among themselves, but if unsuccessful, escalate the matter to team leader. This clarity ensures that conflict can be resolved promptly. Norming (resolve conflict and find common ground) – it helps establish norms and expectations around accountability. This encourages mutual trust and respect among team members as they work towards shared goals. For example, in project mgmt., the project manager is accountable for overall project coordination, while individual team members are accountable for specific tasks. AD can indicate how team members need to collaborate and communicate with each other to ensure smooth workflow and progress. Performing (team is highly productive and functions efficiently) – it helps to ensure that everybody is working together effectively towards a shared goal. It requires to regularly revisit the accountability diagram to reinforce individual and collective accountability. For example, in sales team, the accountability diagram may emphasize that while individual team members have specific sales targets, the team as a whole is collectively accountable for meeting overall sales objectives. This reinforces the idea that success is dependent on collaborative efforts and encourages team members to support and rely on each other to achieve exceptional results. Adjourning (team completes its objectives and disbands) – it facilitates a smooth transition or handover of responsibilities if applicable and capture any lessons during the team’s journey for future reference. Accountability diagram for a project around content writing Organization hierarchy chart in a manufacturing organization.
-
Robust Design is an engineering approach aimed at creating products or processes that are less sensitive to variations and uncertainties in manufacturing, usage, or environmental conditions. The primary goal of Robust Design is to improve the reliability and performance of a product or process while minimizing the effects of unavoidable variability. This is achieved by designing products that consistently meet performance requirements under a wide range of operating conditions. Meeting customer expectation also under non-ideal conditions. This is particularly important because real-world conditions are rarely constant or predictable and variations can occur due to factors such as manufacturing tolerances environmental changes or user behavior. By adopting this approach, companies can reduce the risk of product failures, warranty claims, and customer complaints, leading to improved customer loyalty and overall business success. Robust Design is particularly valuable in industries where consistency, reliability, and customer satisfaction are paramount. Common examples of robust design include – Replacement parts that will fit properly (unit-to-unit variation) Umbrella fabric that will not deteriorate when exposed to varying environment (external variation) Food product that will have long shelf lives (internal variation) Below are some tools commonly used in Robust Design: 1. Design of Experiments (DOE): DOE allows engineers to systematically vary input factors and measure the corresponding output responses. It helps identify the optimal combination of factors that result in the desired performance and robustness. Henkel Corporation, makers of adhesive, sealant, surface treatment technologies, several years ago switched to the design of experiments (DOE) method. By varying the values of all factors in parallel, DOE drastically reduces the number of runs required to determine the optimal value of each factor. This approach determines not just the main effects of each factor but also the interactions between the factors. 2. Taguchi Methods: Developed by Genichi Taguchi, these methods emphasize the reduction of variability and improving quality during the design phase. These method focus on concept of signal-to-noise ratio (SNR) which quantities relative contribution to variation to overall performance . It is a structured approach to determine the best combination of inputs to produce a product or service based on DoE methodology for determining parameter level. Example – use it to identify factors that affect fuel efficiency and determine optimal setting, the factors being engine turning parameters like tire pressure, vehicle weight and aerodynamic design. Using Taguchi method, the DOE is designed to explore the effect on control factors on engine performance while minimizing the impact of noise factors. Instead of having to test all possible combinations like the factorial design, the Taguchi method tests pairs of combinations. Only the main effects and two way interactions are considered in the Taguchi method. The Taguchi orthogonal arrays are based on judgment sampling (using one’s best judgement) and are not randomly generated as with runs for a traditional DOE. With a traditional DOE, noise is treated as a nuisance variable and should be blocked out. Taguchi treats noise as a major focus of analysis. 3. Tolerance Design: Tolerance Design involves determining the allowable variations or tolerances in various components or processes to ensure robustness. Statistical techniques, such as Six Sigma, are often employed to set appropriate tolerances. Example, designing and manufacturing engines, where the goal is to create robust piston design that can accommodate manufacturing variation, thermal expansion and wear while still maintaining optimal performance. It involves analyzing the dimensional and geometric tolerances of various piston parameters such as diameter, height, skirt shape. Tolerance method combined with Six Sigma principles is a powerful approach to achieve robust design. 4. Quality Function Deployment (QFD): QFD is a structured approach that helps translate customer requirements into specific engineering characteristics. It ensures that the design meets customer expectations and provides a framework for robustness considerations. A car manufacturer may identify customer needs such as fuel efficiency, safety and comfort. These needs are translated into specific engineering characteristics such as aerodynamic design, advanced braking system, ergonomic interior. Through QFD, potential sources of variability and uncertainty are identified and addressed resulting in amore robust and reliable vehicle design. 5. Failure Mode and Effects Analysis (FMEA): FMEA is a systematic approach to identify potential failure modes, assess their severity, detectability, and occurrence, and prioritize actions to mitigate or eliminate them. It helps design robustness by proactively addressing failure risks. There are 2 broad categories of FMEA – 1) Design FMEA – explores possibility of product malfunctions, reduced product life, safety and regulatory concerns derived material properties, tolerances, interfaces with other systems 2) Process FMEA – discover failure that impacts product quality, reduced reliability of the process, customer dissatisfaction, safety and environmental hazards derived from human factors, material used, machine used. In pharmaceutical industry, FMEA can be used to identify failure modes and their effect on the production process such as contamination or incorrect dosing. Manufacturers can use robust design principles such as automated quality control systems or process optimization technique to reduce the likelihood of failures and improve the consistency of pharmaceutical products. Examples of products developed using Robust Design techniques include: 1. Automobiles: Automotive manufacturers use Robust Design to create vehicles that can perform consistently across different driving conditions, climates, and manufacturing variations. Car manufacturers use Robust Design to develop engines that deliver consistent performance across different operating conditions, such as temperature, altitude, and fuel quality. Toyota's Prius hybrid car, which was designed to be more reliable and fuel-efficient by reducing the impact of variations in driving conditions. The Toyota Prius, which was designed using Taguchi Methods to optimize fuel efficiency and reduce emissions 2. Consumer Electronics: Companies designing smartphones, laptops, or televisions employ Robust Design to ensure the devices function reliably and consistently under various usage scenarios and environmental conditions. Mobile phone manufacturers implement Robust Design to create devices that maintain reliable performance regardless of user habits, network conditions, or variations in component manufacturing. Apple's iPhone, which was designed to be more durable and less prone to failure by using high-quality materials and designing components that are less sensitive to variations in manufacturing. Whirlpool's washing machines, which were designed to be more reliable and efficient by using advanced control systems that adjust the washing cycle based on the load size and type of fabric. 3. Aerospace Systems: In aerospace engineering, Robust Design techniques are utilized to create aircraft and spacecraft systems that can withstand extreme conditions, variations in fuel quality, and operational uncertainties. Boeing 777: The aircraft was designed using Robust Design techniques, which helped to improve its safety and reliability. The Boeing 787 Dreamliner, which used FMEA to identify potential failure modes and ensure reliability and safety. 4. Medical Devices: Robust Design is crucial in the development of medical devices to ensure their effectiveness, safety, and longevity under different patient conditions and usage scenarios. Medical device manufacturers apply Robust Design principles to develop devices with consistent performance, even when used by different healthcare professionals or in diverse patient populations. A robust cleaning method (either manual or mechanical) use a worst-case approach for the numerous study variables. 5. Industrial Equipment: Equipment used in factories or industrial processes often undergoes Robust Design to handle variations in input parameters, such as temperature, pressure, or load, and deliver reliable performance. Manufacturers of complex industrial machinery use Robust Design to design equipment that maintains precision and efficiency despite variations in input materials and operating conditions.
-
The suitability of the top-down or bottom-up approach for Lean and Six Sigma implementation can vary depending on the specific context and goals of the organization. Bottom-up approach is often more suitable with Lean implementation Lean focuses on eliminating waste and improving efficiency throughout the organization. Bottom-up approach is often more suitable with lean because the bottom-up approach empowers employees at all levels to identify and address inefficiencies in their own work processes, leading to more effective and sustainable improvements. In most cases, the firm rewards the team that came up with the improvement and not the individual. Bottom-up approach aligns with the concepts of lean as it leverages knowledge and experience of frontline workers. It encourages employees to be more autonomous, take initiatives and share their ideas openly with their team members. It drives a culture of continuous improvement throughout the organization. Kaizen (continuous improvement) encourages employees to participate in identifying areas of improvement as they have firsthand knowledge of the daily operations and challenges. Gemba (Go to the Source) frontline workers possess deep knowledge about the gemba and provide accurate information around current state, potential bottleneck and improvement opportunities. 5S (sort, set in order, shine, standardize, sustain) requires active involvement of employees in organizing their workplace and maintaining cleanliness. Value Stream Mapping (VSM) involves mapping the entire value chain from customer to supplier. Frontline workers have direct knowledge of each step and contribute valuable insights to identify waste and inefficiencies. Just in Time (JIT) requires critical input on adjusting production schedules, inventory levels and material flow. Kanban involves visualizing work and reducing work in progress requires active participation of frontline workers. Poka Yoke (error proofing) – frontline workers can identify potential source of errors and suggest practical solutions to minimize mistakes. Andon (problem notification) requires frontline workers to stop the line or escalate issues through the Andon system. Involving employees in the improvement process enhances their engagement and ownership. Disadvantage – Lack of alignment with strategic goals Lean projects require resources, and without top level support, securing adequate resources can be challenging. Example: In adopting Lean principles, the bottom-up approach involves frontline workers analyzing their tasks, identifying waste, and suggesting improvements to their immediate supervisors. These suggestions can then be aggregated and implemented at the department or organization level. In early 2000s, Maruti Suzuki faced intense competition in the Indian automobile market which triggered their kaizen journey. They established a dedicated Kaizen Promotion Office (KPO) to involve and encourage all employees in improvement process to eliminate waste, streamline process and improve productivity. Toyota Production System (TPS) or Lean Manufacturing, places great importance on empowering and involving frontline workers in the improvement process. During the course of their journey, Toyota discovered that “pulling” improvements from the front line was critical to continually improve operations instead of “pushing” work improvement from the top usually generated lukewarm front-line enthusiasm. Top-down approach is generally more suitable for Six Sigma Six Sigma aims to reduce defects and variability in processes, typically using statistical methods and rigorous problem-solving techniques. The top-down approach is generally more suitable for Six Sigma implementation. This is because Six Sigma projects often require strategic planning, resource allocation, and executive support, which are more effectively facilitated through a top-down approach. Senior mgmt. drives Six Sigma implementation and sets strategic direction for the organization. Top-down approach must be used for implementation because the engagement of senior management is crucial in the starting. A top-down approach is holistic thinking and planning especially for a complex problem. Six Sigma DMAIC DMADV requires leadership with authority, strategic vision and resources necessary to drive successful process improvement initiatives. In complex-problem solving scenarios, a top-down approach allows senior leaders to apply their expertise and experiences to identify potential root causes. CTQs (critical to quality characteristics) - enables senior leadership to define key performance indicators and establish targets aligned with strategic objectives. Project selection aligns with the strategic objectives of the organization and allows to prioritize projects based on impact of business outcomes. VOC (Voice of the Customer) to understand and drive prioritization of customer needs across all levels of the organization. DMAIC methodology – top down ensures senior management supports the project, allocates necessary resources and removes roadblock. Data driven decisions - allows senior leaders to emphasize the importance of data analysis and decision making based on facts. Hoshin Kanri or policy deployment is an intrinsic part of lean, can never be successful without top-down leadership. Strong leadership commitment is needed to ensure buy-in and support throughout the organization. Top-down approach enables senior management to establish standardized processes, communicate across organization and ensure consistent implementation. Continuous improvement culture by actively supporting and recognizing improvement efforts at all levels of the organization. Disadvantages – It may lead to resistance from employees if they feel that the initiative is being imposed on them without their involvement or input. Example: Implementing Six Sigma may involve a top-down approach where senior management identifies key areas of improvement based on business goals and customer requirements. They then allocate resources and assign Black Belts or Green Belts to lead the improvement projects, utilizing data-driven methodologies. In the early days at General Electric (GE) there was a strong communication to tap huge market share and save significant costs and Six Sigma was all that mattered, and this message was strongly reinforced by senior leaders embracing six sigma themselves by championing projects, celebrating early successes. The company widely adopted Six Sigma principles and methodologies throughout its various divisions. GE's former CEO, Jack Welch, was a vocal advocate of Six Sigma and played a crucial role in promoting its implementation within the organization. Tata Steel followed a top-down approach in implementing Six Sigma methodologies. They started by setting goals and objectives and then cascaded down to all levels of the organization. It's worth noting that in practice, organizations often combine elements of both approaches, as they can complement each other. For example, a top-down approach can set the overall improvement direction and provide resources, while a bottom-up approach can involve employees in problem-solving and implementation at the operational level.
-
Difference between Plackett-Burman design and Regular 2-level design Plackett Burman Design Regular 2-level design Plackett-Burman (PB) design is used to identify the most important factor in the experiment. It helps to develop an efficient screening method to identify the active factors using as few runs as possible. PB design used in manipulating seven-two level factors require 8 experimental runs vs 2^7 runs as required by full factorial deign (1 – (8/128) = 93.75% economy achieved) Regular 2-level designs typically referred to as 2^k designs -k factors where k denotes the number of factors investigated in the experiment. They are factorial experiments in which each factor is investigated at only 2 levels. For example, a two-level experiment with three factors will require 8 runs. The number of experiments increases rapidly, it is satisfactory for up to 5 factors. These designs are used to identify and screen main effects when it can be assumed that the 2-way interactions are negligible. It is most important to find out contributing and non-contributing factors. All effects are clear, there is no confounding by interactions. Regular 2-level design is useful for estimating main effects and interactions by varying the factors together. PBD is the starting point for screening where there is desire to identify few main factors affecting the outcomes. It greatly reduces the amount of data you have to collect. Once the significant factors are available and their interactions are required, it will be better to go with full factorial design. Experimental runs are in the multiple of 4. Experimental runs are in power of 2 i.e. 2^k where k is the number of factors in study. Plackett-Burman design is used when neglecting higher order interactions is possible, when there are more than 5 factors making it more economical and appropriate to run. Regular 2-level design works best up to 5 factors else the number of runs increases exponentially making it too expensive to run. It is helpful when complete knowledge about the system is unavailable or in case of screening with higher number of factors. Regular 2-level designs are appropriate once few significant factors from a list of many potential ones are identified. The greater number of dummy factors results in better estimate of measurement error, so it is common for experimenters to use large PB designs than is strictly necessary Random errors (noted differences in data are statistically significant) can be reduced by repeating experimental runs. Plackett-Burman Design (Pros and Cons) Pros Cons These designs are very useful for economically detecting large main effect, assuming all interactions are negligible when compared to few main effects It does not verify if the effect of one factor depends on another factor. Very efficient screening designs when only the main effects are of interest Main effects may be aliased by two-way interactions. Used to investigate (n-1) variables in n experiments proposing experimental designs for more than 7 factors and especially for n*4 experiments. Theory shows that in a PB design the main factors are not confounded, but there is strong confounding between the main factors and any two factor interactions that may arise (difficult to distinguishes between the main effect and their interactions). So, if there are significant interactions, PB design can give misleading results. Real life examples of PB designs PB designs are extensively used in chemical and biochemical studies, spectroscopy, electrochemistry, chromatography, etc. There have been many studies made to improve yield in farming. Used in determining best composition present in the fermentation media so as to get the maximum yield, screen out factors affecting the production process Biopharmaceutical industry uses PB designs to develop high performing processes to meet increasing customer demand and reduce manufacturing cost. Clinical studies having many factors included as part of study like determining influence of protein and carbohydrate contents on cell density
-
Laney U’ Chart U Chart C Chart Purpose Laney P’ chart is useful in the situation when process data has large sub-group size and exhibit over dispersion or under dispersion (wider or narrower control limits). U chart is used to monitor average number of defects per sample unit (average defect rate per unit). U chart is more useful when subgroup sizes are different. C chart is used to monitor number of defects in one subgroup and compare with other subgroups. Similar, to np except that it counts for defect rather than defectives. Example For example, if the volume of sample subgroup is varying and very large, it would be appropriate to use Laney u chart. Ex. track the number of errors in the bills in the hospital billing department For example, in a varying sample subgroup unit, different count of defects, DPU of one subgroup can be compared to another subgroup For example, in a fixed sample subgroup of 50 units, defects in one subgroup can be compared to another subgroup Appropriateness Laney u' chart is widely used in healthcare quality monitoring that has a very large sample size (n > 5,000). The u control chart is used if the area did not stay constant. The plotted values are fraction of the subgroup sizes. The c control chart is used if the area stayed constant from sample to sample Over/ Under Dispersion The calculations for the Laney attributes charts include Sigma Z, which is an adjustment for overdispersion or under dispersion. A low number of samples in sample subgroup make the band between high and low limits wider resulting in all data points falling inside of the control limits. (Under dispersion). Similarly larger sample size resulting in over dispersion. A large number of samples in sample subgroup make the band between high and low limits narrower resulting in the data points falling outside of the control limits. (Over dispersion). Similarly, lower sample size resulting in under dispersion. Control limits Depending on Sigma Z value, control limits are adjusted for under or over dispersion 1. If Sigma Z = 1, control limits are same as on traditional u chart 2. If Sigma Z > 1, control limits are wider than traditional u chart to adjust for over dispersion 3. If Sigma Z < 1, control limits are narrower than traditional u chart to adjust for under dispersion Centerline = u bar = Sum of all defects / Sum of units inspected Avg. number of samples in a subgroup = N bar = Sum of units inspected / Number of subgroups Control limits = u bar +/- 3 * sqrt (u bar / n bar) Centerline = c bar = Sum of all defects / Number of subgroups Control limits = c bar +/- 3 * sqrt(c bar)