
Topics
-
Fifty-five women engineering students completed an AI bootcamp focused on rural Karnataka. Participants developed AI-based solutions after visiting villages and conducting field interviews. The She Innovates bootcamp partnered with several organizations to achieve its goals. This initiative aims to boost women's participation in AI and entrepreneurship. It encourages AI applications for rural development and community-focused sectors. View the full article
-
Besi's quarterly orders more than doubled, fueled by AI and hybrid bonding technology. The company saw increased customer adoption of its advanced chip packaging solutions. Demand for AI applications continues to drive growth in data centers. Besi anticipates revenue growth between ten and fifteen percent. This strong performance aligns with other semiconductor sector reports. View the full article


Leaderboard
-
Rahul.Arora2
Members1Points44Posts

Popular Content
Showing content with the highest reputation on 09/28/2022 in all areas
-
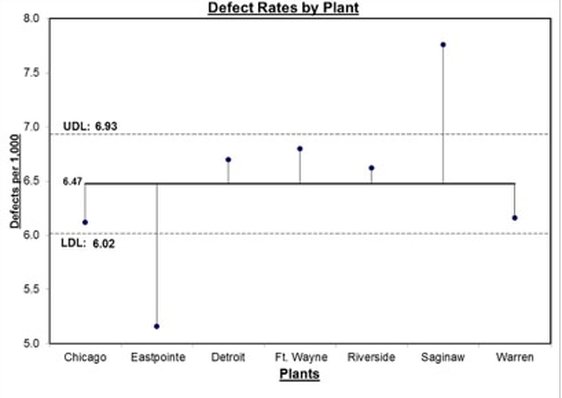
1 pointANOM or Analysis of Means is a systematic procedure for analyzing the difference among groups or sub-groups in a visual form. it allows the data to be graphically visualized. It is a graphical variation of ANOVA or Analysis of Variance. The graph shows the decision limits, overall mean & mean for each group. If a point in the chart falls outside of the decision limit for any given group, it will thus showcase a significant difference between the group mean & the population mean. Below is an example of this graphical representation:- In the above visual, the centre line represents the overall mean & the dots represent the means of different groups, also the line connecting these dots with the overall mean center line represents the difference of the group mean with the overall mean. UDL & LDL represents the upper & lower limit values of the decision limits. Also one can see that there is a large difference between the mean defect rate of Eastpointe & Saginaw sites when compared with the overall defect rate for the entire company. While conceptually both ANOM & ANOVA serve a common objective, there are still marked differences between the two approaches. Let us try to understand these differences basis certain criteria:- Framing the Hypothesis :- In case of ANOM below are the hypothesis that can be framed : Ho : Means of all groups are equal. Ha : Mean of at-least one group is not equal to the population mean. Below are the hypothesis in case of ANOVA : Ho : Means of all groups are equal. Ha : Mean of at-least one group is not equal to other group means. Distribution Assumptions :- While ANOVA only takes data which belongs to a normal distribution, ANOM can take into consideration data belonging to both Normal & Binomial Distribution. Calculation Approach :- ANOM calculates the overall mean of all the data from all the samples & then measures the variation of each group mean from the overall mean. Here the identity of the sources of variation is retained. ANOVA takes into account two calculations while assessing variations i.e. Variation between groups is summarized into Mean Squares Between or MSB, variation within each group is summarized into Mean Squares Within or MSW. Here the individual identities of the groups are somehow lost. Flexibility of Result Interpretation :- ANOVA tell us whether or not there is a statistically significant difference amongst the group means, however it cannot tell whether which of the group(s) is different from the others. Here we generally leverage tests like Fisher LSD or Tukey Post Hoc test in order to identify the statistically significant difference creating group in terms of absolute difference. ANOM on the other hand in addition to telling whether there is a significant statistical difference between the group mean & the overall mean, also tells which group mean is having a significant difference when compared to the overall mean & can be visually represented as well. Now let us take an example of a bank where we want to see the impact of performing wire transfer to four countries eg : India, Brazil, USA & France on the wire transfer cycle time. Here we want to analyze the whether there is a significant variation in cycle times when compared to the overall cycle time. By applying ANOM in this case, we will first able to find out the variation in mean cycle times for each country with respect to the overall cycle time & also will be able to find out that the transactions to which country is generating the most variation when compared to the overall cycle time. This would not have been possible while using ANOVA as we would not have been able to figure out the country(s) are contributing the most to the variation in wire transfer cycle time. Thus to conclude in this example, that ANOM not only reveals the statistically significant difference amongst the wire transfer cycle times for different countries, but also identifies those countries which are contributing to these differences which would not have been possible through ANOVA.
 1 point
This leaderboard is set to Kolkata/GMT+05:30