
Topics
-
Fifty-five women engineering students completed an AI bootcamp focused on rural Karnataka. Participants developed AI-based solutions after visiting villages and conducting field interviews. The She Innovates bootcamp partnered with several organizations to achieve its goals. This initiative aims to boost women's participation in AI and entrepreneurship. It encourages AI applications for rural development and community-focused sectors. View the full article
-
Besi's quarterly orders more than doubled, fueled by AI and hybrid bonding technology. The company saw increased customer adoption of its advanced chip packaging solutions. Demand for AI applications continues to drive growth in data centers. Besi anticipates revenue growth between ten and fifteen percent. This strong performance aligns with other semiconductor sector reports. View the full article


Leaderboard
-
Saravanan MR
Members2Points11Posts -
Mohammad Mahmudul Hassan
Members2Points10Posts -
Vishwadeep Khatri
Administrators1Points6,722Posts -
Mokshesh
Members1Points10Posts


Popular Content
Showing content with the highest reputation on 09/28/2021 in Posts
-
1 pointQ 405. Explain Heinrich's Accident Triangle that helped shape the safety and security in organizations in the last century. What are some of the limitations of this approach for workplace safety and how can they be overcome? 🔹Best Answer: Click here to jump to the best answer1 point
-
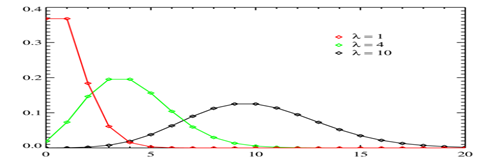
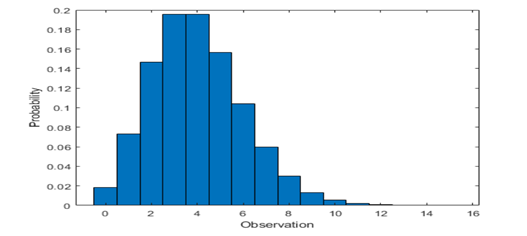
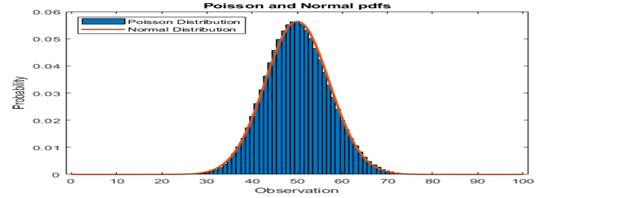
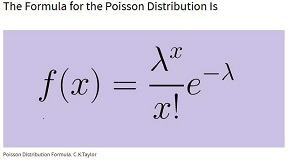
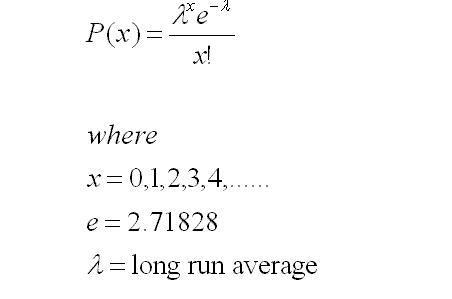
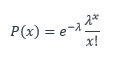
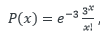
1 pointPoisson Distribution The Poisson Distribution is a discrete function used in probability theory statistics to show how many times an event is likely to occur over a specific period. This describes an average probability of an event happening per unit (Per unit of time, cycle, event). For example, Event “A” happens, on an average “x” times per hour. It was originated by a French Mathematician Simon Denis Poisson in 1837. This distribution is used for rare events. Poisson distribution is very similar to Binomial Distribution. Binomial describes the exact probability happening number of times out of x (i.e. 10 times out of 100 or 90 times out of 1000). Fig: Poisson Distributions, (λ) Also known as μ is expected number of events occurrences on the horizontal axis. Poisson Distribution can be used as: 1. Determining variations measure will likely be from that average number of occurrences. 2. To determine the probability of maximum and minimum number of times the event will occur within the specific time period. Conditions of Poisson Distribution: 1. Number of possible occurrences is not limited. 2. Occurrences are independent. Average number of occurrences is the same from unit to unit Fig: Computing the Poisson Distribution with parameter lambda (λ) or μ = 4 Fig: The Normal distribution closely approximates with the Poisson distribution Mean and Variances of Poisson Distribution: √ When λ is large the Poisson Distribution can be approximately by the normal distribution with μ = λ and σ2 = λ (where, σ is Standard deviation and μ is Mean) √ μ is the average number of occurrence in a given time interval or region in the Poisson distribution, then the mean and variance of the Poisson distribution are both equal to μ. Note: In a Poisson distribution, μ is needed to determine the probability of an event. Poisson Characteristics: Poisson Distribution focuses on the number of discrete events or occurrences over a specified interval like Time, Length, Distance etc. 1. Discrete outcomes like (x = 0, 1, 2, 3….) 2. The number of occurrences in each interval ranging from zero to infinity (Theoretically) 3. Describes the distribution of infrequent events or rare events 4. Each events in independent of the other events 5. Describe discrete events over an interval (Time, Distance etc.) 6. Expected number of occurrences are assumed to be constant throughout the experiment. Given above condition, x is a random variable and distribution of x is a Poisson Distribution. Important Business Applying Poisson Distribution: √ Birth defects and Genetic mutations. √ Traffic Flow and ideal gap distance. √ Failure of a machine in one month. √ Queuing theory (Waiting time problem). √ The demand of a product in equals intervals of time. √ Arrival pattern in a departmental store. √ The occurrence of defects in a manufacturing units. √ Car Accidents. Examples of Poisson Distribution: 1. Check for adequate customer service staffing: Average number of services calls per hour requires 10 minutes to handle. By applying Poisson distribution formula, we can find the probability of maximum number of calls per hour that might come more than 10 minutes per hours. Then, we will evaluate the staffing are adequate to handle the calls of 10+ minute without making customer wait on hold. 2. Evaluate to financial viability to keep a store 24 hours a day: Calculating the average number of sales made by store from mid night to 8:00 am for a night shift of company ElectroCom. Using the Poisson distribution formula, we can calculate the lowest selling from store during that time, then we can determine the total running cost of wages, electricity to decide the store needs to opens 24 hours a day to make financial viable or not for the company. More Examples in the business: √ No of accidents √ No of deaths in floods √No of mistakes per page committed by typist √ No of goals games of football and Hockey √ No of arrivals at a Car wash in one hour √ No of network failures per day √ Number of hungry persons entering McDonald restaurant per day. √ No of births, deaths, marriages, divorces, suicides over a given period of time. Description of a Problem: At ElectroCom Ideas & Technologies Ltd, an average daily sales volume of Diesel Generator in whole the country is Five (5). Calculate the probability of ElectroCom Ideas & Technologies Ltd that exactly nine (9) diesel generators will be sold tomorrow. Solution: Poisson distribution formula in below equation where the mean (Average) number of events within a specified time period is designated by μ. The probability formula is P (x; μ) = (e-μ) (μx) / x! μ=5, Since five (5) diesel generator is the daily average sales by all the distributors of ElectroCom. x=9, Because we want to solve for the probability of Nine (9) diesel generators being sold tomorrow. e= 2.72 1828 since e is a constant equal to approximately 2.71828 Putting these values in the below formula: P (x; μ) = (e-μ) (μx) / x! = (2.71828-5) (59) / 9! = (0.0067) (1953125) / (3262880) = 0.036 Thus, 3.6% is the probability of selling nine (9) no’s diesel generators being sold tomorrow. At the end, a wide range of industries including medicine, astronomy, business, and sports etc. can use the Poisson distribution to examine the capability to take necessary steps to improve their operational efficiency. By analyzing Poisson distribution, the management able to better handle the peak periods by necessary staffing rearrangement and many other operational activities. Also can get into more insights to improve their operational efficiency.
 1 point
 -
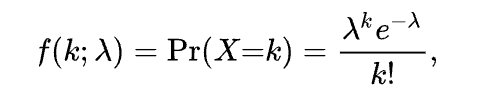
1 pointThe Poisson Distribution is named after the French mathematician Simeon Denis Poisson. It is a discrete distribution that gives the probability of the number of events in a fixed interval of space, time, distance, volume, area, etc. These events should take place independent of each other and at a constant rate. The Poisson distribution is generally used where the number of events is very large and the occurrence of these events is rare. In simple terms it can be described as the average rate at which a specific event happens in a specific time frame, the event will follow a Poisson distribution. Assumptions k is the number of times the event can occur (k= 0,1,2,3,…..) The events are independent of each other The average rate at which events occur, are independent of the occurrences and may vary with time. Two events cannot occur at the same time. Examples The number of calls received in a Call Centre every hour. The number of decay events that occur from a radioactive source every day. No of Accidents in a day on Highway No 4. The number of meteorites greater than 0.5-meter dia that strike Earth in a year. The number of customers arriving at a Mall between 8 and 9 am. Number of Tsunamis that hit the East Coast of India in a decade Number Goals in a match. Number of Injuries in a football match. Number of Hat tricks in a cricket match Examples that are not Poisson Distribution The arrival of students for a class The arrival of spectators for a match. These are not Poisson Distributions since the rate of arrival is not constant and the events are not independent of each other since students and spectators come in batches. Occurrences of earthquakes may not follow a Poisson distribution since the aftershocks may not be independent of each other. Formula The formula for Poisson distribution is Where k is the number of occurrences, e = 2.71828 (Euler’s Number) Lamda = E(X) [The mean] = Variance(X) Lamda can also be taken as the rate for the number of events. Poisson Distribution in Management Poisson Distribution is generally used to improve operational efficiency. Poisson Distribution is used in Queueing Theory as the arrival rate, whereas the Exponential Distribution is used in the Service times. Managing Demand. Study of the demand through the Poisson Distribution can help in developing complementary services, managing the reservation system and overbookings such as in hotels and airlines, segmenting demand, offering price incentives, or promoting off-peak demand. Managing Supply. Similarly, the study of the supply can help in sharing capacity, take decisions on cross-training of staff, using part-time employees, increasing customer participation, scheduling work shifts, or creating adjustable capacity. References https://en.wikipedia.org/wiki/Poisson_distribution
 1 point
 -
1 pointPoisson distribution , named after French mathematician Siméon Denis Poisson is a probability distribution used to show number of times an event occurred in a given time period. The poissons function is a discrete variable in that it can take only whole number values and cannot take fractions or decimals. This distribution can be used to estimate how likely it is that something will happen "X" number of times. e is Euler's number (e = 2.7182..) x is the number of occurrences λ is equal to the expected value of x when that is equal to its variance Some examples at my workplace · Number of Luminaires arriving at the packing line between 5 and 6 PM · Unplanned absentees from production on any given working day at the factory · Orders waiting for dispatch after cut-off time of 7PM · Complaint calls received by complaint team on a given day
 1 point
 -
1 pointIn Statistics, Poisson distribution was named after French mathematician Siméon Denis Poisson. Poisson distribution is a tool which helps for predicting the probability of certain events happening when we know how often particular event had occurred in the past already. It has condition as Events occur independently. One Example of the Poisson distribution usage is calls coming in call center & capacity planning is being done based on the Poisson distribution of the incoming calls. The mean & variations of the Poisson distribution is same.1 point
-
1 pointBefore explaining about the Poisson's distribution, let me brief about data types. For any process before making any analysis, first we need to identify the type of data. Data can be divided as Continuous and Discrete. The Discrete data is further categorized into Binomial and Poisson distribution. Unlike the Binomial distribution, which has only 2 outcomes (Success or fail, Good or Bad, Ok or Not Ok etc.),Poisson distribution focusses on number of discrete occurrences over a pre defined time interval. Some Facts/Assumptions/Properties of Poisson's distribution: The average number of instances those are occurring in a specific area are known Outcomes are random. The outcomes of interest are rarely related to the possible outcome. Poisson's Formula for finding out the Probability: Lambda=Population Mean=n*p (Sample Size * Probability) Examples: The number of component failures for every "x" hours The number of defective items for every 1000 samples The number of shipments booked in a website in a day The number of transaction per day in a bank etc.
 1 point
 -
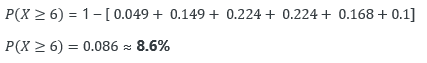
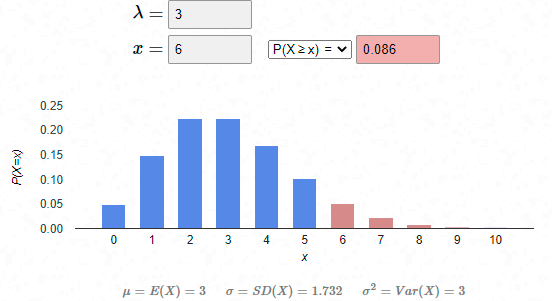
1 pointWhat is Poisson Distribution? Poisson distributions is amongst one of the most practical distributions in answering many of the questions of the modern world. Being used more than a century now, this probability distribution has been useful in solving various problems from medical, banking, agriculture, defence, mining, space research, service and manufacturing industries. Poisson distribution is named in honour of French mathematician and physicist Simeon Denis Poisson. It is a discrete distribution because it shows probabilities of countable distinct values. In simpler terms, this distribution does not take all values in a continuous range. The distribution takes the values 0, 1, 2, 3, 4, etc. with no decimals and fractions. The formula of Poisson distribution is as below: Where, x = 0, 1, 2, 3…. λ is a real number and the expected value of x e ≈ 2.718 Understanding Poisson distribution A Poisson distribution is useful in estimating the probability that something will happen "X" number of times within a given time period. For example, if the average number of students who bunk the tuition class on a public holiday is 5, a Poisson distribution can answer questions such as, "What is the probability that more than 10 students will bunk the classes on a given public holiday?" The application of the Poisson distribution thereby enables tuition teachers to introduce optimal lecture schedules that would not work with, say, a normal distribution. Before applying the Poisson distribution, there are few conditions to be satisfied as below: 1. x is the number of event that occurs in an interval and x can take values 0, 1, 2, .... 2. The occurrence of one event does not affect the probability that a second event will occur. That is, events occur independently. 3. The probability an event occurs is the same throughout the entire time interval. Understanding Poisson distribution and its application from work area (Insurance) (Numbers used are dummy for educational purpose) The number of death claims received per day at an insurance company follows a Poisson distribution. The company receives an average of 3 death claims per day. The claims department needs an expert claims assessor to assess each case and settle the claims within promised timelines. The current staff size is capable to manage daily 5 cases. The department manager is allowed to recruit more staff if the probability of receiving more than maximum manageable cases exceeds by 20%. As a department manager, you would want to evaluate if you are eligible for fresh recruitment in department or not. You may use Poisson probability distribution to answer this question. In this case, λ =3, hence the Poisson distribution for our case becomes as below: ----- (equation 1) The question states you to calculate the probability of receiving more than maximum manageable cases i.e. more than or equal to 6 cases (X≥6). In this case, the probability using Poisson distribution will be calculated as below: Inserting x = 0,1,2,3,4,5 in equation 1 above, we get answer as below. Since the probability of receiving more than manageable cases is less than 20%, the department manager is not eligible for a new recruitment in the department. Visually, one can represent the above Poisson distribution problem as below: Bibliography: https://www.investopedia.com/terms/p/poisson-distribution.asp https://en.wikipedia.org/wiki/Poisson_distribution https://towardsdatascience.com/poisson-distribution-from-horse-kick-history-data-to-modern-analytic-5eb49e60fb5f https://homepage.divms.uiowa.edu/~mbognar/applets/pois.html

 1 point
 -
1 pointPoisson Distribution: The French Mathematician Siméon Denis Poisson who provided a systematic mathematical way to solve such a problem in the 18th century about a large number of possible events where the occurrence is very rare or small. It shall be used for discrete distributions which measure the probability of possible events in a particular time period. In other words, it describes the random occurrence of events in a particular time period. The Poisson distribution is also called the law of small numbers. The reason behind that is the occurrence of the event is very rare in the large number of events. The number of occurrences fluctuate about its mean λ and with the standard deviation of the square root of λ . The correlation between mean and standard deviation counting independently is also useful. The confidence interval of Poisson mean calculated by using relationship between Poisson and Chi-square distribution, In the Poisson process, The data are discrete, independent to each other and mutually exclusive. The Poisson and binomial distribution are applicable for attribute and discrete data. The Poisson is an approximation of binomial distribution. The binomial is used to calculate the probability of the number of successes obtained from n trial with p probability, whereas in Poisson distribution is a special case of binomial distribution as n will be infinity and while keeping the expected number of successes remain the same. Characteristics: This distribution is generally used for describing the probability distribution of an event with respect to time or space Suitable for analyzing situations where the no. of trials (remember sample size in Binomial distribution) is very large (tending towards infinity) and probability of success in each trial is very small (tending towards zero). Hence applicable for predicting occurrence of relatively rare events like plane crashes, car accidents etc. and therefore used in Insurance industry Can be used for prediction of no of defects Poisson distribution formula is as below: Where: λ(lambda)= Mean number of occurrences during interval x= number of occurrences desire e= The base of the natural log (equals to 2.71828) Mean of a Poisson distribution μ= λ Std. dev of a Poisson distribution σ= √λ The width of the distribution increases with μ, as it indicates that the uncertainty will increase with an increase of x. Conditions for Poisson distribution: Events are independent of each other. Rate of event is constant (events per period, area, volume, length etc) Two events cannot occur parallel or simultaneous As an example 1: An automobile company has average defects per unit (DPU) 0f 0.3, what is the probability they would find 3 defects in a vehicle? Here we can use Poisson distribution to calculate the probability. We can do this Manually, or some online calculator or standard table as well. Please refer to the below methods for more understanding. Manually calculated: The same example did in the Poisson calculator as below: The same can be obtained from Poisson distribution table: As an example 2: There are an average of 0.3 accidents per day on the highway between 2 cities, what is the probability that there will be 3 or more accidents in a day? Here we can use Poisson distribution to calculate the probability. This problem also can be calculated based on the above methods. Thanks for reading1 point
-
1 pointEscape Point The escape point is the place in the process of D8 methodology where the root cause of a problem that should have detected the problem but failed to detect so. This considers not only the root cause but also went wrong with the control system in allowing this problem to escape. The 8D problem solving process requires the team to identify and verify escape point at D4 and through D5 and D7. The escape point objective is to improve the ability of the control system so that it can detect the failure or cause if it should occur again. At the end, prevention loop explores the system that permitted the condition that allowed the failure and cause mechanism to exist in the first place. The PDCA, DMAIC, 8D all approaches have in common following scientific and methodic way to solve the problem. In addition, different phases in each approach can be mapped to the phases of the other ones. PDCA DMAIC 8D Plan Define 1. Create team & collect information 2. Describe the problem Measure 3. Interim Containment Actions Analyze 4. Identify/Analyze the root cause & Escape Point. 5. Developing Permanent Corrective Actions (PCA) Do Improve 6. Implementing Permanent Corrective Actions Check Control 7. Define Actions to Avoid Recurrence 8. Congratulate team Act PDCA: The PDCA cycle is the classic problem solving approach in LEAN also called Deming Cycle. PDA is used to solve medium size problems. The Plan phase should have done very carefully that consume high weightage approx. 50% of the total time. Act phase implies that it will start again as part of continuous improvement. DMAIC: The origin of DMAIC problem solving approach is the SIX SIGMA world. This is a 5 Step PDCA used for large problems where huge amount of data is available. Depending on the complexity and process that need to improve the DMAIC project may exceed more than three months. 8D: 8D is a problem solving methodology design to find the root cause of a problem. The structured approach formulated a short term fix and implement a long term solution to prevent difficult, recurring or critical problems and also provides transparency, drives a teams approach and increases the chance of solving problem. 8D Methodology helping to explore the control system and allowing the problem to escape. 8D is very popular in manufacturing domain because it is effective and reasonably easy to teach. This is an 8 step PDCA cycle focused on fast reaction to customer complaints such as product failed at the customer end or a delivered component. Usually first three steps should be completed and reported to the customer in three days. PSP is the same thing like 8D but used in the aerospace industries. Escape point in 8D (D4 through D6): The escape point in 8D methodology is at D4 and goes through D5 and D7. This 8D methodology requires the team for choose, verify, implement and validate permanent correction actions to address the escape point. Figure: 8D Problem Solving Methodology stages . D4- Review control system and Identify the root cause and escape point. Also, select counter measure of root cause and escape point. D5- Developing permanent corrective actions. Selecting control point improvement for the Escape point. Verification of the effectiveness for the PCA and the escape point are required. D6- Implementing permanent corrective actions. Escape point approaching in PDCA/DMAIC: In this step, the verification and implementation of the Permanent Correction Actions (PCA’s) by approaching PDCA/DMAIC to ensure the successful implementation and verified the best permanent correction actions (PCA’s) for the root cause and escape point. The 8D problem solving process is an approach to find the root cause and escape point and taking necessary actions to ensure that these are eradicated through the effective controls and actions that are embedded in the business operations. PLAN (Define, Measure, Analyze in DMAIC): The implementation of the permanent Corrective actions (PCA) in attentions to. - Validation plan of the Permanent Corrective Actions (PCA) - Removing plan of the Interim Containment Actions (ICA) as per part of the implementation of the PCA - Integrate and check for side effects - Continued monitoring plan for effectiveness of the PCAs - Plan for all necessary resources - All documentation planning process, training and communication for the implementation for the PCA. - Define clearly the team roles and responsibilities DO (Improve in DMAIC): Initiating the implementation plan for both the root cause and escape point, ensuring that all the necessary steps have been managed and followed. CHECK (Control in DMAIC): Verify the PCAs have fully implemented and integrated into the operation and business processes. Validate for both the root cause and escape points and will be carried out at this stage and on an ongoing basis. The measures for the effectiveness of the PCAs should use the same measure. ACT (Control in DMAIC): Check actions on any variation from the plan or expected outcomes. Validation: Validation is performed usually under defined operating condition on the final product or process. Validation is the proof that is developed after implementation has taken place, over a period of time and must: - Follow successful verification & Provide a data driven before and after implementation. - Ensure & Check the implementation does not introduce a new problem or side effects At the end, Escape point can effectively use in DMAIC project also to ensure the product quality released by internal and external customer and subsequently to have one or more non conformities to the product, specification and contract requirements. Also, reduced customer complaints due to fast response. Through elimination of root causes improved quality control system and is highly achievable for business operations.
 1 point
 -
1 pointAn escape point is the next point of control after the root cause which should have detected the issue. It is control point which has failed to do its job. Idea behind identifying the escape point is to understand which control point has failed so that necessary action can be taken. This way root cause and control point both can be improved. Escape Point is generally used in 8D Problem solving technique, However it can be used just as effectively in DMAIC project. In DMAIC Project during analysis phase we can identify the escape point and update control plan accordingly in later phases. Taking action on escape point in Improve phase should be done.1 point
-
1 pointTo understand the escape point, First we will begin with 8D methodology: What is 8 D: The 8 D (8 Disciplines) is a problem solving tool / methodology widely used in industries. It is mainly used for corrective action processes in both manufacturing and service industries. This tool focuses on correct root cause and permanent corrective and preventive action, It follows the systematic 8 steps methodology for problem solving. Most of the automotive industries are using 8 D form for identifying the correct root cause and eliminating the recurring problem by implementing appropriate corrective and preventive action. Most of the customer complaints are handled through the 8 D processes to identify the correct root cause to reduce or eliminate the CoPQ (Cost of poor quality). 8 D approach as follows: (All Ds are not explained, D4 is explained to answer the question of escape point) What is Escape point in 8 D process: Here D4 is considered as an “escape point”. Here We isolate and verify each root cause against problem description and test the data. Isolate and verify the location in the process where the real root cause could have been detected but not detected hence the problem transferred to next stages. This point is called an escape point. Any processes there shall be a barrier to stop / identify the defect, If the defect is not detected in the first stage or real root cause at first level then the cause shall transfer and become a defect hence the escape point shall be identified during the 8 D process to make permanent solution. D4 is one of the most vital and important D in the 8 D process. The reason is to identify and verify the real root cause of the failure in the process or product. There are many causes related to one problem like Y = f(X1,X2,X3…...Xn). Here we need to find the right X to identify and validate the causes. This shall not be done through brainstorming or nominal group techniques, We may use 5 Whys or cause and effect diagrams, to map causes against the problem identified. Main activities involved in D4: This step consists of performing the failure analysis and investigation needed to determine the root cause of the problem: A structured method such as cause and effect matrix, is / is not table, or 5 – why technique is required for root cause identification. The detailed description of the actual defect / failure mechanism shall be given, to show that the failure has been fully understood. ASK as many WHYs to ensure the real root cause is addressed. The Is/Is Not tool and the cause and effect matrix should be revised to assist in root cause analysis and more details become known. Other root cause analysis tools such as hypothesis testing or quick DOE’s can also be employed to help determine the exact root cause of the problem. All details should be included in the 8D as attachments. Note: WHYs should be described clearly. Subsequent WHY must answer the question “Why” for the previous why statement, leading to the actual ROOT CAUSE. Do not just put in disconnected statements to point to the root cause you think it is. The maximum amount of evidence must be provided to show that 1)That the root cause is the real culprit behind the problem 2) That all the other potential causes can be excluded. Escape Root Cause Description: Similarly as above, identify (with 5 Whys) the reason why we didn’t detect it. Was the process control plan not comprehensive? Think carefully about why the problem escaped. Careful not to blame the operator as most often it is a weak system that allows the operator to make a mistake without providing help to detect the actual error and prevent it from occurring. Description of Root Cause to WHY not predicted: Why was it not predicted in the FMEA, consider the following questions to arrive at your root cause. Was no FMEA created for this process/system Current FMEA not good enough, review needed? Modifications to the system over the years were not updated? Is the control chat evaluation done or not? Out of control limits points to be checked thoroughly and appropriate action shall be initiated as and when needed. Main benefits of 8 D: Team orientation and engagement Lesson learned can be shared with other business line or product line Can create a database for problems and causes To bring the process under control Reduce CoPQ Better understanding on system change Example of 8 D form: Thanks for reading1 point


This leaderboard is set to Kolkata/GMT+05:30