
Topics
-
Fifty-five women engineering students completed an AI bootcamp focused on rural Karnataka. Participants developed AI-based solutions after visiting villages and conducting field interviews. The She Innovates bootcamp partnered with several organizations to achieve its goals. This initiative aims to boost women's participation in AI and entrepreneurship. It encourages AI applications for rural development and community-focused sectors. View the full article
-
Besi's quarterly orders more than doubled, fueled by AI and hybrid bonding technology. The company saw increased customer adoption of its advanced chip packaging solutions. Demand for AI applications continues to drive growth in data centers. Besi anticipates revenue growth between ten and fifteen percent. This strong performance aligns with other semiconductor sector reports. View the full article


Leaderboard
-
Vishwadeep Khatri
Administrators2Points6,722Posts -
Mayank Gupta
Members1Points679Posts -
Mokshesh
Members1Points10Posts -
Shrikant Angre
Members1Points20Posts


Popular Content
Showing content with the highest reputation on 09/07/2021 in Posts
-
1 pointQ 399. Jishu Hozen is one of the pillars of Total Productive Maintenance. Explain Jishu Hozen and List down pointers for its successful implementation. Note for website visitors - Two questions are asked every week on this platform. One on Tuesday and the other on Friday. All questions so far can be seen here - https://www.benchmarksixsigma.com/forum/lean-six-sigma-business-excellence-questions/ Please visit the forum home page at https://www.benchmarksixsigma.com/forum/ to respond to the latest question open till the next Tuesday/ Friday evening 5 PM as per Indian Standard Time. Questions launched on Tuesdays are open till Friday and questions launched on Friday are open till Tuesday. When you respond to this question, your answer will not be visible till it is reviewed. Only non-plagiarised (plagiarism below 5-10%) responses will be approved. If you have doubts about plagiarism, please check your answer with a plagiarism checker tool like https://smallseotools.com/plagiarism-checker/ before submitting. The best answer is always shown at the top among responses and the author finds honorable mention in our Business Excellence dictionary at https://www.benchmarksixsigma.com/forum/business-excellence-dictionary-glossary/ along with the related term1 point
-
1 pointQ 397. Why Because Analysis (WBA) is a variation of 5 Why analysis which is particularly useful in accident causal analysis. Explain WBA along with its output Why Because Graph (WBG) with an example. Note for website visitors - Two questions are asked every week on this platform. One on Tuesday and the other on Friday. All questions so far can be seen here - https://www.benchmarksixsigma.com/forum/lean-six-sigma-business-excellence-questions/ Please visit the forum home page at https://www.benchmarksixsigma.com/forum/ to respond to the latest question open till the next Tuesday/ Friday evening 5 PM as per Indian Standard Time. Questions launched on Tuesdays are open till Friday and questions launched on Friday are open till Tuesday. When you respond to this question, your answer will not be visible till it is reviewed. Only non-plagiarised (plagiarism below 5-10%) responses will be approved. If you have doubts about plagiarism, please check your answer with a plagiarism checker tool like https://smallseotools.com/plagiarism-checker/ before submitting. The best answer is always shown at the top among responses and the author finds honorable mention in our Business Excellence dictionary at https://www.benchmarksixsigma.com/forum/business-excellence-dictionary-glossary/ along with the related term1 point
-
1 pointMokshesh has provided the best answer to this question by clearly explaining all the facets of WBA. Another good practice that can be incorporated by all respondents is adding references, like it has been added by Johanan.1 point
-
1 pointWhy Because Analysis is a technique used to identify / analyze the root cause of the unexpected failures / behavior of systems. It’s also know as WBA a method of causal analysis. This analysis is conducted by to determine the root cause of the problem or accident by repeating the questions “Why” using 5 Why Because analysis. WBA analysis can be used for technical and socio –technical systems. Basically can be used in variety of system domains. Technical analysis covers the analysis performed on the accidents occurred in various industries like Aviation, Marine, Railway, Industries. Socio Technical system like Courts, Academia, Agriculture, Public Finance etc. This analysis can be visually represented by drawing a tree diagram which includes cause – effect relationship between factors. These casual factor are represented as node. This graphical representation is also known as WBG – Why Because Graph. This provides a clear understanding of what led to an accident or incident. Graph looks like below. Technical Example: Big and longest Analysis – Titanic failure
 1 point
 -
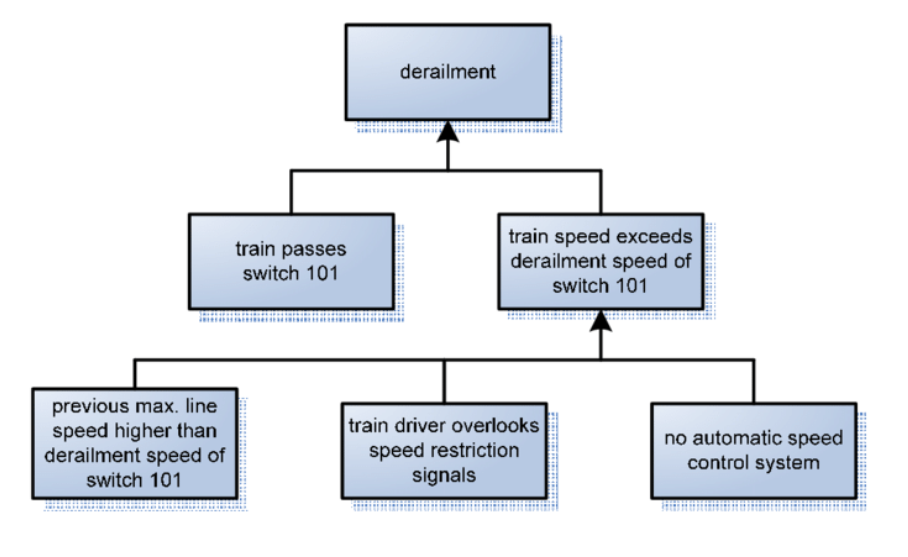
1 pointWhy Because Analysis (WBA) is used to understand the reasons post accidents in various industries like Railways, Airline, Marine, Transport etc.. What is WBA? It is an iterative process to understand what happened and why it happened. This is done for all possible causes and the reasons therefore. It is done till a satisfactory answer is found as a reason of the accident. This more like a tree of cause and effect where at each node there can be various causes why it might have happened. The outcome of WBA is WBA graph which is like a node and attributes leading to the node. As shown in the diagram below As shown in the graph train derailment has happened and the various reasons for that derailment are identified... 2 main reasons why the rain derailed are 1. train passes through 101 switch 2. Train speed exceeds the derailment speed of 101 switch 2.1 The train driver overlooks the speed restriction limit of the track 2.2 There is no automatic speed control system in place to apply automatic brakes 2.3 The line speed to leading to switch 101 is much higher than speed of switch 101.. Hence the train is already speed up before reaching the switch.
 1 point
 -
1 pointWhy Because Analysis Why Because Analysis is used for analysis of Accidents in various scenarios such as marine, rail, road, air etc. The advantage of WBA is that it can be used independent of the domain. It is a posteriori analysis method. WBA analysis increases the objectivity, reproducibility and reduces the falsification of the results. WB Graph. The results are depicted in a Why Because Graph which shows the causal relationship between the factors of the accident, with the nodes being the factors. The cause-and-effect relations are depicted by the directed edge. Process. It starts with the question – what is/are the accident/accidents? The causes of the accidents are then determined in an iterative process. Formal tests are then examined with respect to all potential cause and effect relationships. This iterative process continues till the time a result has been determined. The contributing cause i.e the related factor at each node i.e. the factor must be necessary to cause the accident and putting all the causes together should have caused the accident. Formal Test. There are two Formal Test viz the Counter Factual Test (Counter to the Fact) and the Causal Sufficiency Test. Counterfactual Test. The Counter Factual test asks the question; would the effect have happened without this cause or in other words does the cause actually contribute to the effect. Hence A is a cause for B if, and only if, had A not happened B could not have happened. A is the Necessary Causal Factor for B. The Counterfactual test does not answer is A is the only cause of B. A alone may not be sufficient and other causes may be required for B to occur. Causal Sufficiency Test. The Causal Sufficiency Test asks the question; are the listed causes sufficient for the effect to take place. This helps in identifying other causes. A correct WBG would require a positive CT and positive CST. This means the listed causes are sufficient, i.e. nothing is omitted (CST) and every cause is necessary (CT). Causal Chains and Sufficiency of Cause A Simple Causal Chain A More Complex Causal Chain Examples Fukushima Dia-Ichi runaway nucelar Reaction. Factors – Tsunami, Tohoku Earthquake. Collision of the Titanic. Factors – Excessive speed, Night, Life Boat Capacity, thought that the ship was unsinkable, unable to evade the iceberg. Car Safety System. Factors - Anti-Skid, Anti-Lock Brakes, Air Bags etc. In order for a fatal crash, a number of these systems have to fail. References https://en.wikipedia.org/wiki/Why%E2%80%93because_analysis Introduction to Why-Because Analysis Dipl.-Inform. Jan Sanders Computer Networks and Distributed Systems Group Technical Faculty, Bielefeld University mail: [email protected] web: www.rvs.uni-bielefeld.de in Association with Causalis Limited mail: [email protected] web: www.causalis.com February 1, 20121 point
-
1 pointWhy Because Analysis is a post mortem sort of analysis and it will be carried post the event/accident/damage has been occurred. It is one of the variant of the Why- Why analysis which enables to make deep dive into the root cause analysis of the problem/effect/incident that has been already occurred. By establishing a proper CAPA (Corrective Action and Preventive Action) for the established root cause, we can eliminate/reduce the similar accidents happening in the future.
 1 point
 -
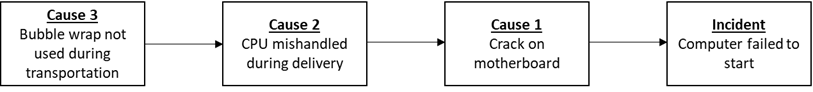
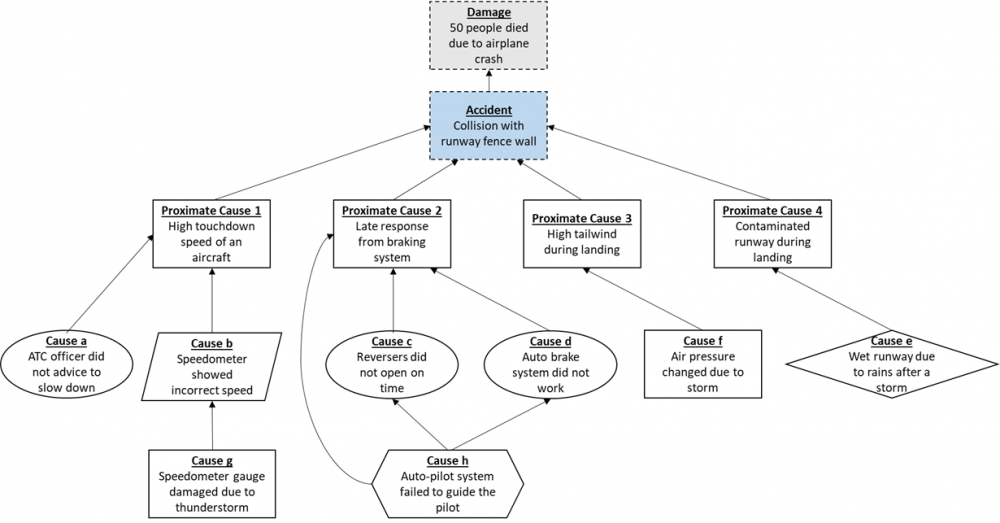
1 pointQ) Why Because Analysis (WBA) is a variation of 5 Why analysis which is particularly useful in accident causal analysis. Explain WBA along with its output Why Because Graph (WBG) with an example. Answer: What is a ‘Why Because Analysis’ (WBA): Accident causal analysis (or incident investigation analysis) is a type of posterior analysis which uses inductive reasoning to develop a theory which can give a satisfactory causal explanation of the accident (incident) being analysed. Causal analysis is one of the many methods available for performing accident (incident) analysis. With modern engineering, humans are able to build advanced systems that can fulfil a complex task. However with the advent of sophisticated systems, it has become intellectually difficult to do the failure analysis of complex systems using traditional causal analysis method. Let’s understand this with an example. Suppose that there is a standalone computer (a simple system) which has failed to start. A causal analysis using conventional ‘5 Why’ analysis method could be something like as shown below. The above causal chain shows a simple cause-effect relationship which may be sufficient for simple incidents. But suppose that the computer is part of a complex network, with connection to other computers, servers, internet, external devices, human operators and changing environment. In such a situation if a computer shuts down suddenly while operating then it becomes difficult to do an incident analysis with a simple cause-effect relationship. Complex systems show a complex cause and effect relationship and requires a more rigorous approach to causality. One has to not only assess the individual components, but also the interactions between them. What adds to the difficulty is that, at times, many complex system failures have been observed even without the breakdown of individual components of a system. Why-Because Analysis (WBA) as an alternative causal analysis method was therefore developed by Everett Palmer, a research engineer at NASA Ames Research Centre (California) to perform the failure analysis of such complex, open and heterogeneous system. The term ‘open’ means that the system’s behaviour is highly affected by the environment in which it is operating and ‘heterogeneous’ means that system has many components that must work together for entire system to function smoothly. In fact, Everett Palmer made the Why-Because Graph (WBG) first which led to development of WBA then. Understanding a ‘Why-Because Graph’ (WBG): Accident analysts use a Why-Because Graph (WBG) to map the complex cause and effect relationships. WBG is essentially a directed acyclic (non-circular) graph to respect the laws of causality. Let us understand some concepts & terms to be able to make a WBG for an accident analysis. 1. Counterfactual Test (CT): WBA uses a rigorous notion of causality known as counterfactuals. British empiricist David Hume in his theory of causation propounded the counterfactual test. He argued that two occurrences are causally related as cause and effect if they pass this test. Test: X is a cause for Y, if and only if, had X not occurred, Y could not have occurred. To apply this test, ask this question: If X had not happened, could Y had happened? If the answer is ‘No’, then X becomes the necessary causal factor (NCF) for Y to happen. If the answer is ‘Yes’ the X is not necessary for Y to happen. Y would have happened anyway. Here importantly, we must understand that while X is a necessary factor for Y to happen, it alone may not be sufficient for Y to occur. This brings us to our next concept as follows. 2. Causal Sufficiency Test (CST): In CST, the objective is to decide whether a group of causes are sufficient for an effect to happen. Test: X1, X2, X3…..Xn are causally sufficient for effect Y to happen, if and only if, Y inevitably happens when X1, X2, X3…..Xn happens. Summing up both the above tests, one can say that the group of causes under consideration creates an effect only when both CT and CST are positive. A positive CT indicates that each cause is necessary and a positive CST indicates that all listed causes are sufficient for an incident to occur. 3. Accident: An accident is an occurrence that results in a significant loss and is within our area of interest. Let’s represent this with a blue dotted line rectangular box. 4. Damage: The loss occurred as an outcome of an accident is termed as damage. Let’s represent this with a grey dotted line rectangular box. 5. Factors: Factors are the set of causes that are considered to be responsible for an accident and the resultant damage. Factors can be broadly classified as Events, Process, Un-Event, State and Assumption. Let’s understand these briefly: a. Events: Events are simply the changes that have happened in the system. Ex: In a car as a system, if the speed changes from 50 km/hr to 60 km/hr, then this acceleration is called as an event. Let’s denoted it by a rectangular box. b. Process: They are sequence of similar events. Ex: If a car increases its speed incrementally from 50km/hr to 51 to 52….60km/hr, then this sequence of similar events is called as a process. Let’s denote it by a parallelogram. c. Un-Event: An un-event is an event that should have happened, but did not. Ex: A car crossing a red signal is an event. But if you carefully think over it, then it is an un-event. Let’s denote this with an oval. d. State: State is a condition that is true across the events and process. Ex: A car must stop before the red signal is a condition that is true over the various events and processes. Let’s denote this as by a diamond shape. e. Assumption: These are factors that do not have enough evidence to support a cause but are important as a part of causal sufficiency test. In an on-going investigation, these assumptions are loose ends which can be resolved as a real factor as investigation progresses. Let’s denote this by a hexagon shape. f. Proximate Causes: All those factors that immediately precede the accident are termed as proximate causes. These factors are primarily some events or processes as explained above. Now let’s understand an example of WBG using above terms and concepts that we learnt. (Below WBG is a simple diagram for learning perspective and does not indicate complete analysis of any real investigation) Let’s assume that each cause (factor) in the above WBG has passed the counterfactual test (CT) as we move from bottom most factor to the accident node. Also, let’s assume that all these factors have passed the causal sufficiency test (CST). One can now say that above WBG is a complete representation of cause and effect analysis behind failure of a complex system. What follows after any cause and effect analysis is the finding of countermeasures to avoid occurrence of these set of causes to avoid the future accident and damages. In an advanced WBG practice, the analysts also place the countermeasures as one of the factors to check if they are efficient enough to avoid various factors, especially the un-events.
 1 point
 -
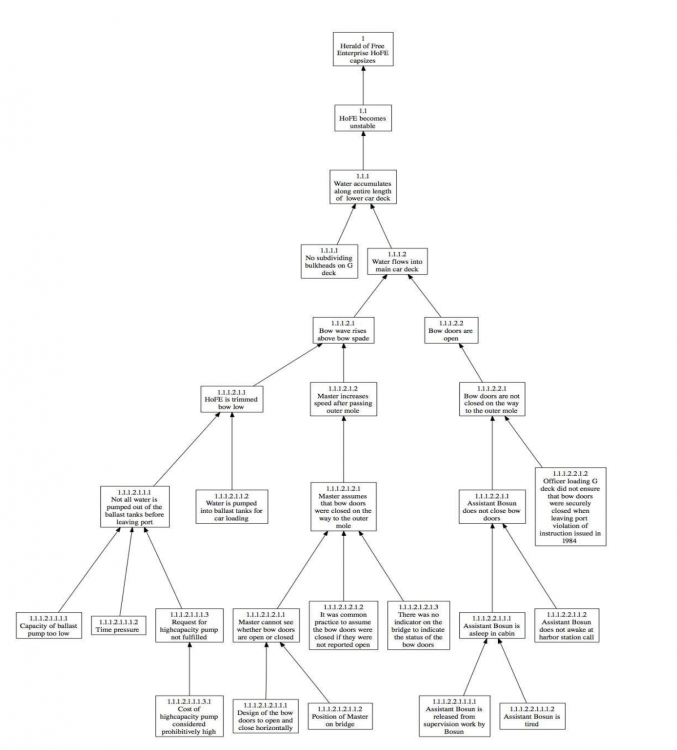
1 pointWhy because analysis is a method to ascertain the causes for unwanted system behaviour or incidents and is usually represented by a Why Because Graph (WBG). This method is typically used for unexpected system behaviour, mishaps and incidents. The analysis can be made full proof by using Counterfactual Tests which ensures that all the nodes of WBG are rightfully connected. The completeness of the WBG is established through another test, Casual Sufficiency Test (CST) which confirms that "Does the effect necessarily occur, if all listed causes are present?". These tests are not conducted on the entire WBG but is conducted on small sections. It is then extended to the complete WBG. The steps involved in preparing a sound WBG is as under: Information is gathered about the incident and its quality is ascertained The information gathered is further analysed to separate out facts and judgements A list of all the facts is prepared A Why-because list is then prepared which incorporates information about the facts and their relationships A WBG is prepared by listing the unwanted incident/mishap which is normally referred as "top node”. The unwanted incident may not be as easy to define as it seems. It depends upon the purpose for which it is being used. Necessary Casual factors (NCF) acting as child nodes are attached to the facts which are presented in the WBG as nodes. The level of detailing would depend upon the requirement of the exercise being carried out. Further, it is an iterative process and may take time. A Causal Completeness Test is then carried out to ensure that the incident is described sufficiently, and that there are no errors. Note: NCFs are determined either from the facts found in the List of Facts or from the pairs of facts found in the Why-Because List Example- Capsizing of roll-on/roll-off (RoRo) road-vehicle ferry (Herald of Free Enterprise) while crossing English Channel where 189 people died out of 459 people which were on board (Ref:https://rvs-bi.de/research/WBA/TheWBACaseBook.pdf) RoRo road vehicle ferries have bow/stern doors for drive on, drive off loading and carrying vehicles/people over to the other side These doors are closed before the departure to prevent ingress of water. However, the ferry had its door open at the time of departure The bow waver rose over the level of bow spade Water inundated the main deck and went into the lower deck as well The ship became unstable and capsized in shallow water During the investigation following facts emerged The Assistant who was to close the door was asleep in his cabin and did not wake up at harbour call as he was tired The Chief officer who was to examine that the doors are closed before departure thought that he has seen the Assistant going to close the doors The officer who was loading the deck did not check the doors before departure although he was meant to check the doors before departure as per instruction The Captain of the ship always assumed that the doors are locked unless informed otherwise. It was a common practice. The Master assumed that the doors were closed as he went to outer mole (A large solid structure on a shore serving as a pier, breakwater). He could not see the doors closing as they closed vertically and there was no indication on the bridge about their status. The depress the bow to facilitate the loading was not matched with the true level because of time pressure and because of lower capacity pumps. A request for a high-capacity pump had been rejected by management as the cost was considered prohibitive. The WBG of the above incident is as under:
 1 point


This leaderboard is set to Kolkata/GMT+05:30