
Topics
-
Fifty-five women engineering students completed an AI bootcamp focused on rural Karnataka. Participants developed AI-based solutions after visiting villages and conducting field interviews. The She Innovates bootcamp partnered with several organizations to achieve its goals. This initiative aims to boost women's participation in AI and entrepreneurship. It encourages AI applications for rural development and community-focused sectors. View the full article
-
Besi's quarterly orders more than doubled, fueled by AI and hybrid bonding technology. The company saw increased customer adoption of its advanced chip packaging solutions. Demand for AI applications continues to drive growth in data centers. Besi anticipates revenue growth between ten and fifteen percent. This strong performance aligns with other semiconductor sector reports. View the full article


Leaderboard
-
Mohamed Asif Abdul Hameed
Fraternity Members1Points78Posts -
Manjula Pujar
Lean Six Sigma Green Belt1Points13Posts -
Khalandar S
Members1Points23Posts -
Natwar Lal
Members1Points50Posts


Popular Content
Showing content with the highest reputation on 07/20/2019 in Posts
-
1 pointSpaghetti Diagram Sphagetti diagram is visual representation of basic flow of people/product OR A visual creation of actual flow. It is also known as workflow analysis diagram Steps to draw spahgetti * It begins with layout of space where the flow takes place * Then Record process on side and start begining of scope. * Need to check how frequently each place is visited at workplace/production area * Record amount of time within each activity * Need to understand distance ,time,Start stop ,execution area, * Then record actual flow lines using pencil and paper to draw on space layout. * When all flow lines are recorded they tend todraw spaghetti. USES OF SPAGHETTI * It shows layout of work place * It helps to minimize the time of travel * It identifies inefficiency or unwanted waste in process * Avoid time consuming and nonproductiveactivities. * Use to track product/people flow. * Helps to make proper use of workplace by organising flow as per process1 point
-
1 pointSpaghetti Diagram: Process Analysis tool It provides lucidity and understanding of the workflow. It gives better clarity of the current process and allows to see the visual flow of process and helps us in identifying Areas of Improvement. Without breaking the flow, continuous tracking in done to trace the flow of the activity in the process. It is used to track the ACTUAL flow of the process. It is also referred as Point-Point Flow chart / Work Flow diagram or simple Spaghetti chart. Below diagram on right, looks messy alike Spaghetti and that's the name Spaghetti Diagram. This powerful tool gives a sense of "Impact of Movement" in LEAN perspective and identify Wasteful Movements (Motion), waiting time and various transportation wastes in the process and keeps it nominal. Usually used in complex process to understand the current flow "Current State - As-Is" and to propose opportunities for optimization "Future State - To-Be" It can be used to track Product/Part, Multiple People/Person, Paper, Tools and Activity. I would like to explain this with an example: In the example, After lean - Spaghetti diagram (Improved Layout), considering below points: Activity distance travelled is reduced Distance is optimized People/processes relocated (Layout reorganized) to be in order in which the process flows or activities made close to each other (Better Sequencing) Unnecessary flow eliminated Waiting time reduced Interruptions/facility constraints identified and eliminated KANBAN opportunities identified >> This can lead to faster deliverables / delivery or >> With no change in delivery time but with lesser effort put in to complete the activity >> This could result in Space and Motion saving Benefits of using Spaghetti Diagram: Helps to detect wasteful movements and identify ways to increase the speed of process Identify possible inefficiencies/bottlenecks/Critical paths which causes delay in work place layout Helps in creating ideal Layout design for the process Recourse allocation improvement are also identified Unnecessary confused flow can be identified and eliminated It reduces Employee Fatigue and Improves Employee Morale It is used to identify redundancies in the process flow and eliminate them for optimal performance

 1 point
 -
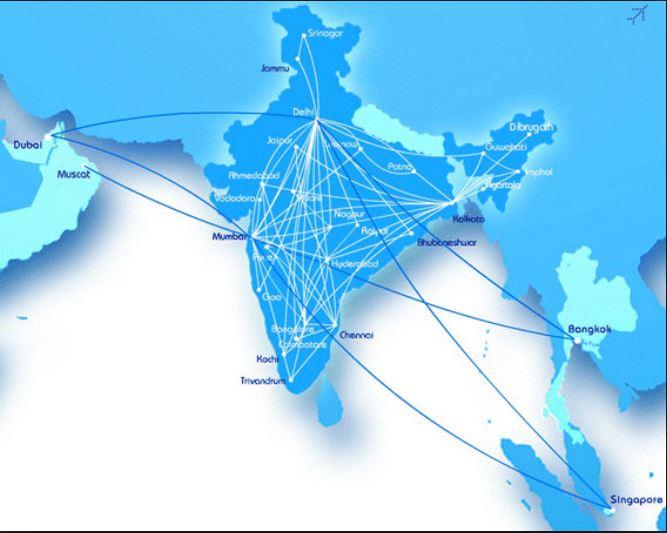
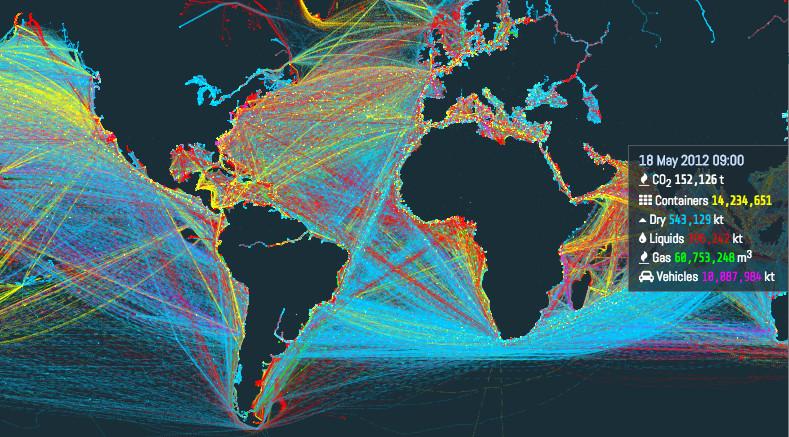
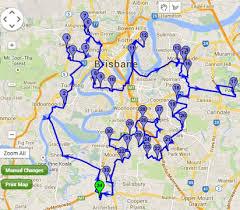
1 pointSpaghetti Diagram: is a visual tool to help understand and trace the movement of people and/or material and helps in identification and improvement of the shop floor layout. It helps in visualizing two out of the eight wastes - Transportation and Motion. After studying the spaghetti diagram the unnecessary movements could be curtailed leading to an efficient process. I have never used a Spaghetti Diagram, however, I feel it has usage in the following aspects 1. Designing the most efficient layout of the shop floor 2. Designing the layout of any service organization where customers are required to move. E.g. Bank, Hospital, Super Market, Passport Seva Kendra etc. 3. Designing the optimal route for a delivery boy. E.g. postman, Swiggy or Amazon or any other delivery boys or girls 4. Designing the optimal route for transportation. E.g. bus or cab routes for offices and schools 5. Providing a snapshot view of the route taken or the pre-defined routes. E.g. Map of the route taken post an Uber ride or the route map of an airlines or the map of metro coverage or routes of ships etc. Providing some snapshots below to see how a spaghetti diagram looks like (images from Google search) Fig. 1 - Optimizing the shop floor or customer service center layout Fig. 2 - Route taken post an Uber ride Fig. 3 - Domestic and International routes for an airline Fig. 4 - Metro rail route map of Delhi Fig.5 - World shipping routes (depending on the type of cargo) Fig. 6 - Delivery route (may be planned or completed)


 1 point
 -
1 pointSpaghetti diagram is one of the visual representation tool that is used for measuring the distance traveled by material & man movements as per process flow in plant layouts. The name is coined because of the appearance of man and material flows like Noodles in practical. It is a very useful to calculate the impact of two Lean wastage - Transportation( Material from one work station to other by means of manual, semi automatic or automatic) and also human Motion - in-effective Therbligs (as per Gilberth's Motion & time study) which refers operator VA/NVA - Pick & Place/Load & unload/ Grasp& release in performing a job in prescribed method. The actual benefit of Spaghetti diagram is resulting the optimization of layout in minimal space & creating shorter distance traveled by material & man and this directly leads to enhancing the throughput with minimal inventory. In similar to Spaghetti Diagram, other Industrial Engineering tools like Travel chart, SIMO chart, String Diagram are widely used for process flow analysis based on the product/ process matrix & type of layout adopted.1 point

This leaderboard is set to Kolkata/GMT+05:30