

aritradasgupta187
Lean Six Sigma Black Belt
-
Joined
-
Last visited
Everything posted by aritradasgupta187
-
aritradasgupta187 replied to Vishwadeep Khatri's topic in We ask and you answer! The best answer wins!Inverted U theory is also known as Yerkes Dosdon Law. What Is U theory - In our day to day project management often we work on deliverables which has to be met in a very tight timeline however is achievable. The project goal was met because of your unique skills. The project goal might have been difficult to achieve and there was pressure however the same was overcome and the result was amazing. In contrast there might be a project which might have deadlines which were flexible however there was undue pressure which resulted in the work not as per expectation which led to multiple feedback from management or clients. U theory states that there is a correlation between pressure and performance. Who created it and When ? This was created by Robert Yerkes and John Dodson in 1908. The name is given to this theory due to the curve created which helps to understand the correlation between pressure & performance. Optimum performance is achieved when the pressure is appropriate based on the work which is there at hand. Too much or too little pressure can be detrimental to the project goals. The Left side of the above graph shows where there is less pressure where employees are not challenged to complete the task and thus the employees tries to do a work in a slopy manner. The right hand side of the graph shows where there is excessive pressure on the employees due to which the performance is affected. This can result in the employee feeling stressed, panicked or hurried and leads to employee dissatisfaction. The Inverted U theory shows that positive pressure is required however stress is never good and is always negative. When there is positive pressure then persons feel motivated, challenged and engaged which helps person outperform .Where as excessive pressure leads to people feeling stressed and leads to anxiety. The idea is to use pressure in a rational way so that employees outperform. The factors which influence of the Inverted U theory :- 1.Skill Level – Skill level of a person directly affect there performance and effect the result and there attitude. 2. Personality – A persons personality also affects the performance. An extrovert person performs exceptionally when there is high pressure situation. For an introvert he might underperform in a high pressure circumstances. 3.Trait Anxiety -Team member who have high degree of self-confidence they are able perform exceptionally well as compared to those who have low self-confidence. 4. Task Complexity – Complexity of the work is equally important. A highly complex work should be performed in less pressure whereas for a low complexity work certain amount of pressure is required to complete the task.

-
aritradasgupta187 replied to Vishwadeep Khatri's topic in We ask and you answer! The best answer wins!Cost avoidance includes steps which are taken which will help reducing the cost that will be incurred by an organization in future. Cost avoidance aims at having a minimal increase in cost but reducing future cost. Examples of Cost Avoidance :- 1. Making changes in the machinery which might increase the cost initially but will bring down cost of production in future 2. Setting up a new Quality department in a leather industry which can help in reducing the losses incurred due to the cargo being rejected due to Quality reasons. 3.Investment by a company in lean training which will help in cost reduction in the long run as there will be individual who will look for waste reduction in each of there departments post completion of the training 4. Installing a Smoke detector in a factory set up which can help in averting a major catastrophe 5. Bio Metric system for 10,000 strong Steel company so that tracking of attendance and man hours becomes easy. This will help in better planning and will save a lot of time and cost if this was done manually 6.Using Cisco systems for meeting across globe which helps to reduce cost if the same meeting was held with each member being physically present. 7. A software company doing testing for an application before it is released .This avoids any cost in future if there is some bug not identified at the onset. The same can lead to customer dissatisfaction & losses for the organization 8. A mobile manufacturer does a product testing of its new smartphone before it is launched. This allows them to fix any issues before the customer buys the product. If this is not done and there is a customer complaint then the result can lead a company losing its market share Cost avoidance is never reflected in the budget or in the Financial statements. Cost Savings :- Cost Saving is also known as either a Hard or a Soft Saving. This deals with any actions that lower debt levels,current spedings or investments. The Financial statement and budget reflects the cost savings and are extremely beneficial with regards to the financial health of a process. Examples of Cost Savings - 1.Price Negotiation - A company might be using a vendor and there can be bulk purchase. This results in a price negotiation and the vendor lowers the prices which leads to cost savings 2.New Contract & Contract Renewal - This can be great scope for cost savings 3.Partnerships - A company chooses to partner with Cloud Computing company which will help in cost reduction by reducing the infrastructure cost in future 4.Outsourcing Call center division of a insurance company which will help in reducing operation cost and hence this will help in reducing overall cost for the organization 5.Lowering marketing cost by using digital advertisement instead of going to a marketing firm. This will help in reducing cost and is an example of cost saving Cost Saving is calculated in %. The same is calculated by Original Cost - New Cost = Price difference , Price difference /Original Cost *100 = Cost Saving
-
aritradasgupta187 replied to Vishwadeep Khatri's topic in We ask and you answer! The best answer wins!Cross validation is a method by which a model is tested. This ensures that the sample is robust . In this method a portion of the sample is not included to check the effectiveness of the model. After a model is built a data set is picked to check the effectiveness of the model. As a rule of thumb generally the entire data set is included to check the effectiveness of the sample. In Cross Validation however a part of the data is retained. For example in a cross validation may be 80% of the data is used where as 20% of the data is retained. K Fold Cross Validation - In this the data set is divided into equal parts . For example there is a 5 step algorithm which needs to be created the data set will be 1/K =1/5=20%. The total of 80% of the data is sent to train the model where as the remaining 20% is retained. The process is to score the model based on 80% of the sample and once the same is finished the remaining 20% which was retained is run in the model and the scoring for the same is done. Monte Carlo Cross Validation - In Monte Carlo the data set is divided into equal parts like K Fold cross validation however in K fold its only done once where as Monte Carlo its repeated multiple times.In Monte Carlo method the sample is picked independently. For example there are 25 data points and a group of 5 . The data set is randomly selected and the results are noted. The data set is again created using random sample and the model is checked. The advantage is that this method is very effective if there is iterative method and also the model is tested for the accuracy. The disadvantage is this can be very expensive.
-
aritradasgupta187 replied to Vishwadeep Khatri's topic in We ask and you answer! The best answer wins!Though Paired t test and 2 sample t test are used to compare 2 samples there is a fundamental difference as to when it should be used in a practical situation. Similarly between Paired t test & 2 sample t test:- 1. Both are used when x is discreet and Y is continuous 2. Should be used when data is normal 3. Should be used only to compare 2 average of a sample When should be Paired t test be used Vs 2 sample t test :- 2 sample t test should be used wen the two samples which has been selected for the statistical test are marginally independent and when that is not the case paired t test should be used Example where paired t test should be used : - 1. Medical - A new BP medicine is given to a set of 20 patient and the company wants to understand what is the impact of the medicine. Before & After results for the same set of patients should be taken and paired t test should be used whether the medicine has an impact on the BP. 2. Product - A company wants to check a new oil product and they use a test to conduct with bikes with and without the new product and compare there milage 3. Service -A change in IVR has been introduced as a digital strategy and the before and after calls handled for a set of 100 agents is compared to check if there is a statistical significance of IVR on number of calls handled by agents 4. Medical -A new radiation technique is used for a set of 500 patients and test are compared for the same set of patients for the same set of patients Example when t sample t test should be used : - 1. Service - To compare the AHT/ NPS score between 2 different teams to check whether team leaders have an impact on overall AHT . This can be due to the way one team leader manages a team as compared to the other 2. Manufacturing - IF there is a difference between the Mean time to repair for a CNC machine between one plant to another plant. This might be certain operator issue or other factors . 3. A pharmaceutical company - A drug is produced to control type 1 diabetes and the test of the patients are compared with a set of patients who were not given the drugs. To check if there is a difference in Hyperglycaemia levels between two set of independent groups 4.Product - A heavy engineering company compares what is the voltage fluctuation between one transformer and other transformer which is a new one . This can help in understanding whether there is a reduction in fluctuation or there is no impact 5. HR - HR team has been receiving complaints that the average pay of a managers salary in 2 different metro cities with the same cost of living and employees with the same work experience. The team can take sample salary from a group of 20 managers from both the sites to compare the salary Above are some examples when a paired t test is used Vs a 2 sample t test. While paired t test can be used when we have 2 sample and it is normally distributed . A 2 sample t test has to meet these as well as the criteria that there should be equal variance between 2 samples.
-
aritradasgupta187 replied to Vishwadeep Khatri's topic in We ask and you answer! The best answer wins!In any hypothesis testing we have to decide on the level of significance which is denoted by alpha. This is important as failure to choose correctly null hypothesis can cause Type 1 error. IF α is small - There is lass chance of incorrectly rejecting a Null hypothesis (H0) Since the power is low this decreases the chance of detecting an effect if one exists IF α is Large - There is a higher chance of incorrectly rejecting the Null hypothesis (H0) Since the power is high there is high chance of detecting the effect To Select α for a Hypothesis test we need to understand which mistake will be worse ,finding an effect which does not really exist or not finding an effect that does exists . Examples where α is Small- 1. Buying an expensive machine as the cost might be very high and we might set a very low α so that we are able to determine if there is any effect on productivity post buying the new machine 2. Fitting a new car model with a new engine Vs a old one 3. Changing the breaking system in an elevator with a new mechanism which is more economical. This can have serious impact on safety if the machine fails to work 4. Changing a bearing in a jet plane with new ones which are less expensive 5. Using cheaper building material for construction to bring down overall cost of the project. In order to save money if the company replaces the material there can be serious implication to the lives of people 6. New Iron & steel used in a dam construction project from a different vendor who is offering a discount 7. New material used for GAS pipeline Vs the old one which can reduce the cost. If the company does not test this adequately then there can be major catastrophe and company can be answerable to government & public Examples where α is Large- 1. Checking the effectiveness of a new delivery model for a chain of restaurant which is already getting customer complaints due to delivery delays 2.A new Sales strategy for a firm which is making losses due to low sales 3. A decision for Digital strategy implementation for a company which is on verge of bankruptcy 4.A new repair allocation process for a Insurance company which is loosing customer base due to the high claims life cycle time The above are some examples which will help to decide whether to take a higher or lower α value.
-
aritradasgupta187 replied to Vishwadeep Khatri's topic in We ask and you answer! The best answer wins!Golden Ratio is also known as the golden mean,golden section, divine proportion. The golden number is 1.61803399 is denoted by the greek letter phi. When a line has 2 parts one is short and the other is long . If the long part is divided by the short part and is equal to the whole length of the line divided by the long part it is the golden ratio. The Actual Value is : 1.61803398874989484820..... Golden Ratio is largely used in design :- 1.Website Font Size - Golden ratio is used to define the size of the headline or the text . This provides a symmetry to the text and gives aesthetic value to the writing as well as ensures that its easily readable. 2.Cropping of Image 3. Logo development 4. Product design uses this concept 5.Artistic composition and historic monuments also follow this .Example Taj Mahal,Pyramid also follows this.
-
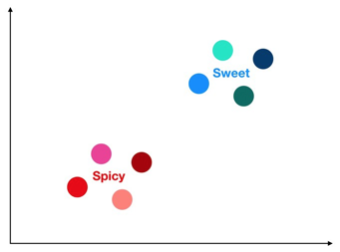
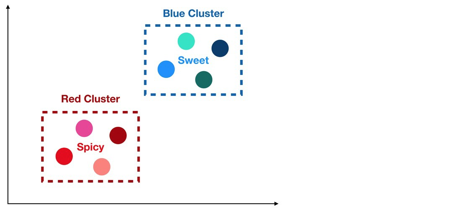
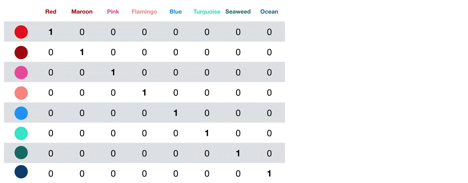
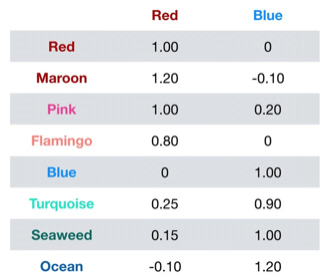
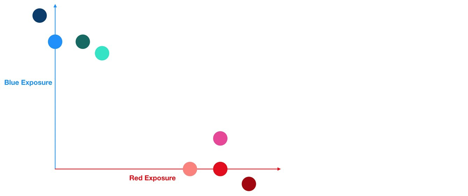
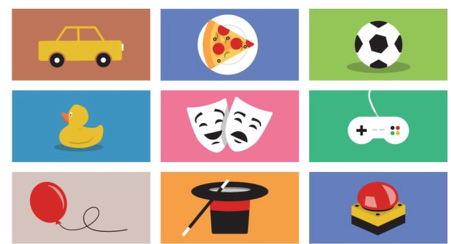
aritradasgupta187 replied to Vishwadeep Khatri's topic in We ask and you answer! The best answer wins!As a Black belt we have often come across situations where there are some intricate analysis which involves statistically concept been shown to the management and post all the explanation its asked “What is the point”? But if we try to understand from the standpoint of the audience we will soon understand that they have limited amount of time and concentration so they want specific answers to the questions in a simplified manner. In today’s world there is so much of data that there are potentially 2 risks that can happen :- 1. If there is surplus data than we have excess data where as the features are limited .This result in out of sample performance 2. The other scenario is if we have too many features in the data then it becomes extremely difficult to cluster. This result in a scenario where there are too many dimensions and every observation in the dataset appears to be equidistant from each other. This term was coined by Richard Bellman to showcase the difficulty to optimize a function which has a lot of variables. Below is a detailed example for this concept :- In the above example there are 8 candies. There are 2 distinct categories the first is the set of candies which is sweet whereas the other is spicy. The problem is to find a solution that if a customer asks for a sweet candy he never gets a spicy one . The same should be when a customer asks for a spicy one he should not get a sweet candy. In the above clustering the candies can be clustered in the 2 distinct categories which will fulfil the customers demand. The 2 distinct demand of customer is either a sweet or a spicy candy. This can be easy differentiated by a human as he is visually able to differentiate the colour and hence fulfil the customers requirement. However if the same needs to be identified as a part of a AI project where this logic needs to be converted to an algorithm. The machine will not be able to understand the difference and there is a high probability that the customer will be given an incorrect candy. In the above example there are not 2 categories but 8 categories and clustering is extremely difficult in this. Every candy is an individual colour. There is no relationship which has been drawn so it difficult to create a algorithm to predict the taste of the candy. Though there are 8 different colours and clusters which are equidistant from each other however there are 4 candy which are sweet and 4 which are spicy. Dimensionality Reduction is the only solution to this problem. In the above example each colour features is exposure to the latent features. Post this if the same can be plotted in a graph this will help in clustering easily. In the above graph there are 2 distinct colours which is Red & Blue .Red represents Spicy candy whereas Blue is sweet. So whenever there is a new candy the colour is recorded and then it is transformed to its exposure to Red & Blue. Using the latent feature it can easily be found out whether it is close to Red or Blue. So Once this is done it is easily ascertained if it is Spicy or Sweet. This is a very important concept when there Is too many features which can create a confusion for machine learning algorithm. This concept helps us to reduce to dimensions which create difficulty and helps in getting the solution.
-
aritradasgupta187 replied to Vishwadeep Khatri's topic in We ask and you answer! The best answer wins!Block Diagram consists of blocks that are different part of the system/Process where as the lines are drawn to show the relationship between the different blocks.Block diagram can be used in various fields .It can be used in the below mentioned cases :- 1.Electrical circuit 2.Engineering diagrams 3.Signal Processing 4.Software Programming 5.Project Managers can use to show how various task input & Output interact with each other 6.Sales & Marketing Above are some of the usage of Block Diagram. The above block diagram represents a flight control system of an aircraft.This shows what happens when a pilot moves the "Stick". This indicates how all the various components are dependent on each other to facilitate the final task. This will help in understanding if there is a new product needs to be designed or there is any problem in an existing design. This is very effective method and though it does not show each wire/circuit wise details this can help in design ,planning ,problem identification in a lot of scenarios. This has a wide applicability in Manufacturing & service industry as well. Project managers have taken the concept and are utilizing this tool in identifying what are the various aspects in a project which are interrelated and what can be a roadblock to delivery or achieving the project objectives.
-
aritradasgupta187 replied to Vishwadeep Khatri's topic in We ask and you answer! The best answer wins!The Holy Trinity for any successful project hey are depicted in the above picture. The Success of a project is dependent on 3 important aspect which is schedule ,scope and budget . hey in order to make a project successful it is imperative that one site of the triangle should be in one’s control the other 2 can be in control of the customer. If scope ,budget and schedule are in control off the customer there can be a challenge in the quality of the project deliverable . there are many organisation who face this challenge sense they have a very demanding customer who tries to have us very tight deadline ,tight budget and an extremely complex scope .this put a lot of pressure on the project team and at times the quality of the deliverable is compromised .this often leads to customer complaint and a vicious cycle where due to the unreasonable requirement of the customer the quality of the project is impacted . please find below an example which covers examples where hey one side of the triangle is in control of the producer while the other 2 are in control of the customer . 1. Client : Scope ,Schedule Producer : Budget First example is when the customer has very tight schedule and define scope hey which cannot be altered .a phone manufacturer is planning to launch a new smartphone which has 5G capability .this phone is to be launched in the next 6 month .The mobile company gets in touch with a chip manufacturer and provides him a deadline off 3 months the buffer is kept as this software needs to be integrated with chip. the chip manufacturer in this case is the producer While mobile company is the client . the chip manufacturer is working on a very tight deadline and he has a specific call which needs to be achieved however if he has the budget in his control then he can deploy a subcontractor who can manufacture the chip on the contractors behalf .If the producer has a budget constrain then he would not be able to deploy additional resources in order to fulfil the mobile companies demand . 2. Client : Budget ,Schedule Producer : Scope In the second scenario the budget and schedule is restricted and is in control of the client whereas the scope is in control of the producer. A builder is approached by a customer that he needs to build a house in a plot which he recently bought . The client informs the builder that his budget is fixed and since he is retiring he needs to move in the new house by the next 6 month's . In this scenario the client has given a fixed budget as well as schedule .the builder who is the producer in this example can clearly articulate at the beginning of the project that within this short frame of time he can only complete a duplex however certain amenities like indoor swimming pool Or terrace garden cannot be completed within this time frame and budget . 3. Client : Budget ,Scope Producer : Schedule In the 3rd scenario the budget and the scope is controlled by the client however the producer has control over the schedule . a watch manufacturer approaches a web designer to design their company web page .hey in this example the watch manufacturer is the client and the web designer is the producer .the watch manufacturer has a clear scope which he wants to include in the company website .The watch manufacturer might have already spent a lot of money in designing a new product line post marketing survey and analytics .they might be on a tight budget and hence the producer has to adhere hey to the scope and budget of the client . In this case the web designer might have other customers who have their priorities and deadline which are very stringent .if the web designer has the schedule under his control then he can ensure that within the desired budget off the watch manufacturer the website is designed which meats the scope of the watch manufacturer. The idea is to give the best quality by having one of the triangle in control of the producer so that they can do justice to the project deliverable .

- 7 replies
-
1
-
- time
- scope
- holytrinity
- projectmanagement
-
Tagged with:
-
aritradasgupta187 replied to Vishwadeep Khatri's topic in We ask and you answer! The best answer wins!Interrelationship diagram is a visual technique which helps to understand the cause & effect relationship between various factors. This tool also helps to identify what are the various factors which helps to resolve the problem. It can be wisely used for any problem which might be related to :- 1. Client SLA not being met 2. Resolving any chronic business problem 3. Increasing throughput 4. Increasing productivity 5. Decreasing Cost 6. Reducing Attrition/Absenteeism 7. Increase profitability 8. Reduction of Losses due to waste 9. Improving Retention % 10. Improving Sales % 11. Improving TAT The above are some of the examples where the tool can be used. If there are any business problem this tool can help in identifying the root causes and the various outcomes . The simplicity of the tool allows to be used in any business problem and understand the relationship between various factors. The way to use the tool is as follows :- 1. Create a Problem Statement 2. Identify factors which might affect the problem from occurring. This can be done through brainstorming or focus groups 3. Dray the issues in a circle which was collected in the previous step 4. Identify cause & effect relationship 5. Draw a arrow to reflect direction of influence 6. Take a count of arrows going in & out 7. Identify drivers and outcomes – If a factor has many arrows going out then the same is a driver and if there are many arrows going in a factor then the same is an outcome. Below is an example of Interrelationship Diagram :- Attrition amongst employee is very high In the above example some of the important factors are unhappy with managers, employee don't feel valued ,employee don't see any growth opportunity ,company policy are not employee friendly, shift timings. The effect is to search for a better job. In the above example clearly shows how an interrelationship diagram can we use effectively for any business problem. This helps to identify the various tractors as well as the affect .as the next step a team can then analyse what are the various reason which causes each of these factors .hey once the same has been identified the team can create solutions which will help in resolving each of the critical factors .

-
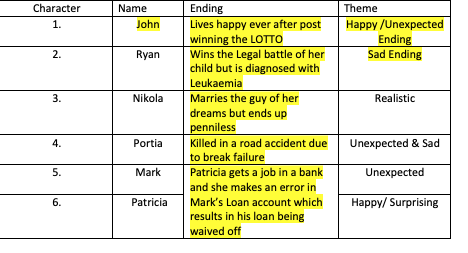
aritradasgupta187 replied to Vishwadeep Khatri's topic in We ask and you answer! The best answer wins!Morphological matrix is a technique which were different alternatives are provided to a business problem Step 1 – Select the required Attribute :- list down all the critical attributes which are there are list the same down in a column Step 2 – The next step is to make list of all the possible component for each attribute . Step 3 – Combine components with Attributes and make as any combination as possible .the same can be done using brainstorming with the team and coming out with the best possible solution .Each of the component which has been identified by the team can be looking to further details to check what suits best. This can be used in various scenarios :- 1. Film script to have different ending for the same story 2. Theme of different TV series for an online streaming website 3. Different features for a new product 4. Creating different lesson plan for children 5. Creating list of different games that will be part of the party Below is an example of a book ending & how a writer can choose what are the various endings . This will help him to be more creative and come out with a unique & unexpected ending which can make his book a best seller. This can help an author to mix and match the ending and he has so many alternatives to end his story. He can change the ending as per his suitability . This can be one of the books ending :- This helps to make alternative choices and will help to make the solution more effective.


-
aritradasgupta187 replied to Vishwadeep Khatri's topic in We ask and you answer! The best answer wins!Dunning Kruger effect is a cognitive bias where a person feels he is more intelligent than others and understand the particular Task much better than the others. This kind of understanding might be there in any person because he hasn't got in depth knowledge about a particular field which makes him believe that is an expert in something which he might not be in reality . This phenomenon is named after two social scientists who carried this experiment . They were David Dunning & Justin Kruger. The study was conducted on a group of 65 people who were tested on various fields which ranged from grammar , logic, humor. People who scored lowest in all 3 felt that they have great knowledge about each of the particular field. Like for humor the jokes that they cracked were really poor and much of there set back was they did not understand that this was not funny. Whereas they felt that they had cracked a hilarious joke . These set of people who scored the lowest not only did they feel they were exceptional, but they didn’t even know that they had actually performed poorly. This is like an agent who has failed in an examination but feels he deserves a better score because he evaluates himself as a person who is intelligent and can easily clear the exam. The reason can be explained because of 2 factors . Due to the lack of skills, acumen in the particular field a person is unable to perform at the desired level. Secondly due to his Limited knowledge he does not realise what is the skills , and abilities which are required to meet and exceed the performance. There can be other factors like little knowledge in the particular field which might make the person believe that is exceedingly well in a particular task . The problem might arise due to meta cognition which is every person’s judges himself from his limited knowledge and perception which might be flawed and biased. This might result in him evaluating himself as much superior when in actual he might be underperforming . A superior can deal the in removing this problem in 3, different ways :- 1. Learning and practice — By constantly teaching and guiding the person as to what are the required expectation and skills for a particular task .this will help a person to realise where he stands as compared to the required expectation and once he realizes this gap he will try to breach the same by gaining knowledge and practice . 2. Providing constant feedback — supervisor should provide constant and ongoing feedback which will help the person to understand how well is adapting and learning the new skills , and weather he's meeting the desired expectation .often this might not be liked by the person but if there is constructive feedback provided this can be very helpful for the person to meet and exceed the desired skill. 3. Questioning what the person Knows- even when a person starts to learn something new he might only absorb things which he is already familiar with. The supervisor should constantly ask a question and also an encourage the person to challenge and ask himself the question as to what is known and unknown to him . This will help the person to constantly strive for excellence, and he will exceed the desired job which he was unable to perform.

-
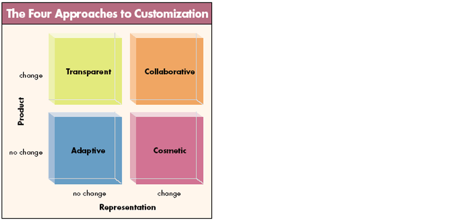
aritradasgupta187 replied to Vishwadeep Khatri's topic in We ask and you answer! The best answer wins!A decade ago most of the companies believed in mass production which simply meant that the customers did not have a lot of customised choices and had to select out of the various product produced and had very less choices. As times have changed the marked is no more a homogenised set of people but there are various segments and each have their individual need and requirement. The manufacturers also had to adapt to this and had to customise their product so that it meets customer requirements. This however can pose a greater threat as customers requirement keeps on changing and in case if they keep on adhering to customers need they can face huge losses. As it will be extremely difficult for any manufacturer to adapt to these changing requirement so quickly. Companies have adopted mass customisation which results in providing unique product to the customers in a seamless manner. The 4 different methods of mass customisation are as follows :- 1. Transparent – This is best suited for those products or commodities which predictable and can easily be understood .Often there is no need to speak to the customer and understand their needs. The manufacturer does not make a lot of changes in his products . Eg – Chemical company who supplies to industry after supplying for 2 years or multiple time the manufacturer takes a stock of the same and tries to replenish the order every week without the manufacturer ordering every time. This results in a seamless delivery model where customers requirement is understood by the suppler and his requirements are fulfilled. 2. Collaborative – This is best suited for customers who are unable to articulate their needs which results in the manufacturer unable to produce products which caters to the Customers requirement and hence they get frustrated and stop buying the product. In collaborative customisation there is individual dialogue with the customer who state their need which is then customised so that it fits the customers requirements . Example – An eyewear retailer develops a software where customer walks in the store and he can click his image and can virtually choose the different frames that are available and see the image without manually trying the same. This saves his time and he can make the right decision and his stated and unstated needs are fulfilled. 3. Adaptive – in this the manufacturer provides one product where the customer can make minor customisation to suit his requirement’s. Example a manufacturer creates a chair which can be stretched or can be converted to a stool when required 4. Cosmetic – The changes are at a very little and it’s the same product offered to different people in different ways. Example – A manufacturer changing the size of a edible product & selling the same so that different customer buy the product based on their requirements Most of the companies combine there approaches so that they can offer as many customisation to the customers. For example a paint company may offer that customers can virtually choose as to which paint he should buy by some application which allows customer to upload the house which they want to paint and choose amongst the 10000 shades that are available .This is an example of collaborative customisation. At the same time they might have Cosmetic customisation where customers can choose amongst the various paint sizes that are available. In today’s market the manufacturer gives the freedom to the customer to customise his product so that he is able to derive value for the money spent by the customer. This results in fulfilling the customers stated and unstated needs post buying the product and thus result in increase in the company’s profitability.
-
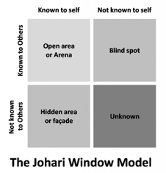
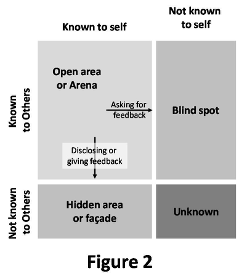
aritradasgupta187 replied to Vishwadeep Khatri's topic in We ask and you answer! The best answer wins!For a team to achieve its goal its Imperative that the team members know what each other’s strengths and weaknesses are. It becomes Extremely important that each team member is self-aware about himself. Johari Model is one such tool which helps us to do the same. This tool was developed by American social scientist Joseph Luft & Harry Ingham in the year 1955. This can be very effective when there is a team formation which follows the 4 stages Form, Storm,Norm & Perform. Johari Window :- 1.OPEN Area or Arena — Every individual has some characteristic behavior, attitude, emotions, feelings, skills which is known by him and everyone. This can be very effective In all the 4 stages of the team formation. Form — In the form stage knowing each of the team member's behavior, attitude, emotions etc. will help the team lead to select the right team which can be crucial in achieving the project target. Storm — In the storm stage this becomes important Because the team members know each other’s qualities & can provide constructive feedback to improve each other’s fallacies. Norm — In the norm stage it can be very helpful as certain practices or qualities which can negatively impact a project can be addressed. The project lead can set the expectation which the team agrees to follow. Perform — In this stage each team member is aware of each other’s qualities, behavior attitude, strength,weaknesses which will help in the team working in synergy in achieving the desired project target. 2. Blind SPOT — Blind spot is information about yourself which you are not aware but others are aware of the same. This is very crucial as this will help the team to let the individual know what are his good or bad qualities. Form — In the form stage these findings can help in creating a connect between the team Storm — In the storm phase this can help in constructive argument and allow the team member to introspect once they are made aware of their respective blind spot. Norm — Once each other’s blind spots are known the team can understand what can be the collective strength of the team or what are the opportunities they need to work as a team. This can help in creating action plan to address the same and hence will achieving the project target Perform — During the team formation since the team is aware of each other blind spot it becomes easier to achieve the desired target in the most harmonious way. 3. Hidden Area or Façade — This is information that is known to the individual but not known to the team. As the team goes through various phases individual builds connect with the team member and reveals this information. If it’s a good quality than the team can capitalize on the same and if it’s a weakness then the team can suggest ways by which the individual can improve on the same. 4. Unknown Area — This is information which is not known to the individual neither to the others in the team. This is a self-actualization which a person needs to find about himself during the course of time. As the team goes through phases like Storm, Norm or perform individual realizes about the same as they communicate in greater details with the team. Open communication will help in individual realising the same. This might be due to some past experience and might be an unconscious reaction. Once the person realizes and discusses with the team gets closer which will help them to work in synergy. This makes it easier for the team to achieve the project goals. As the team develops the team members move from a state where they seek more feedback about themselves & improves themselves. The Individual also tries to understand their blind spot which helps to improve the team overall synergy. This collectively helps the team to achieve the desired project target. Below is the table which shows the same.
-
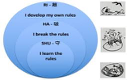
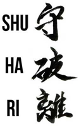
aritradasgupta187 replied to Vishwadeep Khatri's topic in We ask and you answer! The best answer wins!Shu Ha RI – Shuhari is a Japanese concept coined and used in martial arts. It can be described the entire cycle of a students training and how his relation evolve with his teacher .Though the concept is used in martial arts the principal can be used in any improvement project. SHU – SHU in Japanese means to “Obey” or to “Protect”. This is the phases when the teacher teaches his students the rules And regulations .the student tries to add year to all the rules and regulations it's the teachers duty to ensure that he assists the student in his learning process. This is just like a parent teaching their child. This will also from the foundation of the students’ knowledge and will help in is future . How SHU can be used in Implementing Six Sigma in an organisation - In an organisation SHU can form the first stage where 6 Sigma leaders take initiative across the organisation to train employees and create a solid foundation so that use this knowledge in the projects which will help in achieving organisational goals. they will assist the employees in clarifying all doubts and support them so that they have a strong capability in practically applying the knowledge . Ha - At this stage a student has achieved certain proficiency an expertise in his art. He starts applying the same and uses a certain amount of freedom while he's doing the same. he also starts question and tries to break free of the rigid instruction of his teacher. This is a time where he will ask a lot of questions from the teacher . In this stage the student has achieved proficiency and he himself teaches while his teacher Is already known as a master of his art. How HA can be used in Implementing Six Sigma in an organisation - This is a stage sufficient employees who are trained and they successfully started implementing there knowledge in the various projects and have seen positive results . They might question their leaders regarding the rigidity of the instructions which they were earlier taught and might question then on an ongoing basis. This can be considered as a positive phase as the student is now trying to Excel in what he's been taught and has started is journey of inner quest. RI - This is a stage where is student now has become a high ranking Black belt and he has acquired expertise .This is a stage where he sets free ,the relation between the student and the teacher is more like a grandparent where The grandchild has a child of his own. This is a phase where the student listens to his creative inner self and embarks on his own journey of creating something new. This is his contribution to his field of knowledge. He is no more guided by anyone rather he starts creating something unique based on his character and personality. How RI can be used in Implementing Six Sigma in an organisation -This is phase where the employees who are now experts come out with innovative solutions which can be in form of methodology ,process this leads to series of new techniques ,innovation and this leads to a complete transformation of the organisation. Cause the students are using there knowledge and expertise of the process to come out with some unique solutions which can radically change the business . The student should surpass the skills of the teacher cause only then there will be overall improvement .In case if the skills of the students are not at par with the master then the overall improvement will deteriorate. If the student is able to equal his master but not surpass him then there will be stagnation.
-
aritradasgupta187 replied to Vishwadeep Khatri's topic in We ask and you answer! The best answer wins!There are a lot of statistically analysis which can only be conducted if the data is normal. When we are dealing with data there are times that the data turns out to be non normal data .hence it becomes extremely important that the data is converted into a normal data so that certain statistically analysis like process capability ,Annona and other such analysis can be conducted. Box COX transformation is remedial method which can be used for transforming non normal data to a normal data . This was developed by 2 status stations George box and David Cox. They Developed a procedure Which uses Lambda to transform data into a normal shaped curve. the value of Lambda is the power to which all data should be raised. This is done hey by searching hey between Lambda =-5 to Lambda =+5 The best value can be found. there are certain challenges which are faced when we use box Cox transformation. there are times when the transformation does not result in a normal distribution so it becomes extremely important that after the transformation is done it is chat weather the curve is a normal distribution. box Cox transformation will only work if all the data points are positive and greater than zero.
-
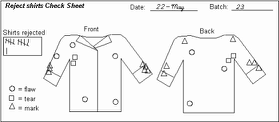
aritradasgupta187 replied to Vishwadeep Khatri's topic in We ask and you answer! The best answer wins!Defect concentration diagram can be defined as a visual representation as to where the maximum defect is found for a product. For service the same can be done by a process mapping. For a product the same can be done by defect concentration diagram. This helps to identify which part of the product has the maximum defect. This will help the team to focus or channelize the effort to remove these defects. Defect Concentration diagram is done in any of the 3 scenarios: - 1.When data collection is being done to identify and quantify the problem. This helps to understand the magnitude of the problem and the effort that will be required to rectify the same. This will also help to understand what the benefits will be. 2.Helps to identify which part of the assembly is leading to the increase in defects being produced. Which will help in fixing the same. 3.Helps in understanding what are the defects in a product and work on removing the same. This will help the company to increase customer satisfaction and reduce Cost of Poor Quality. Example 1- The above diagram shows that which area in the car door has the maximum defects. This can be very vital for a car door supplier to quantify the total defect which will help in understanding the magnitude of the problem. This can also be used to identify which production stage the defects are produced as each section of the car door is produced at a stage. This also helps to understand which part of the product has defects and what can be a potential impact. For Example, if the lock of the has a defect there can be serious safety and life hazard and can lead to litigation. Despite the defect being less the manufacturer will have to work on the same first so that there is no defect. The next focus can be on the glass fitting which if faulty can lead to customer dissatisfaction as it might result in leakage during rainy season. Example 2- A shirt manufacturer can use this technique to identify the number of defectives and defects. He can use the defect concentration diagram to understand where the maximum defects are and what are the defects. In the above example of shirt, the maximum defects are concentrated towards the sleeves. The defect which is there is mark. There is a total of 12 defects for mark ,8 defects for flaw and 4 defects for tear. This will also help him to understand what happens incorrectly when a sleeve is being made which results in an increase in error for mark. These techniques can be very useful in identifying defects and helping resolve the problem. Post implementation of solution the same methodology can be applied to check whether there has been an overall reduction in defect count as well as the defect concentration.

-
aritradasgupta187 replied to Vishwadeep Khatri's topic in We ask and you answer! The best answer wins!HIPPO is one of the common problems that is there in an organisation. HIPPO( Highest Paid person's opinion).This happens when an organisation Instead of relying on data are relying more on an individual who might be at a very high position and has a very high pay. Often when such a Person Gives an opinion The others stop giving any other opinion Which is different from what the hippo says .there is a tendency where people tend to either follow the hippo or state facts which validates what the hippo is telling. Hippo effect is one of the biggest challenges in some of the companies where the decision is made not based on data but based on the hippo which can be top executive. It is often seen Tata project which is undertaken Buy a hippo is bound to fail as compared to a project which is led by middle manager .this can be attributed by the fact that a hippo generally tends to think that the decision that he is taking is always correct and in spite of someone highlighting that he might not be correct he might still choose to continue or stick to the decision which might need to failure of any project .this is not in the case of a middle manager because he tend to listen to all the critical analysis or feedback which has been provided to him and tries to do course correction accordingly . this insures that whenever any kind of business decision is taken It is more of a teamwork which is based on data which is available and not by a single person Making a decision Without referring to any data which can be termed as hippo affect. Often in business in spite of data been available there is always a need to take a decision Which will be based on some kind of intuition Which cannot be turned as hippo effect. This is an essential part of any business decision . In case if there is no data available any organisation Can always look at competitors performance or take industry benchmark to make any kind of business decision. Companies often have cross functional team mistakes decision Or are involved in any diversified project this neck aids the role of a hippo.
-
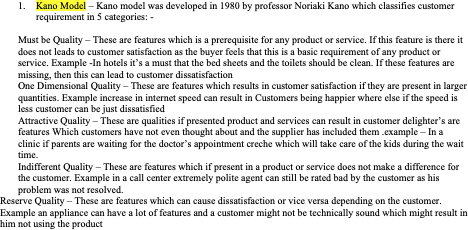
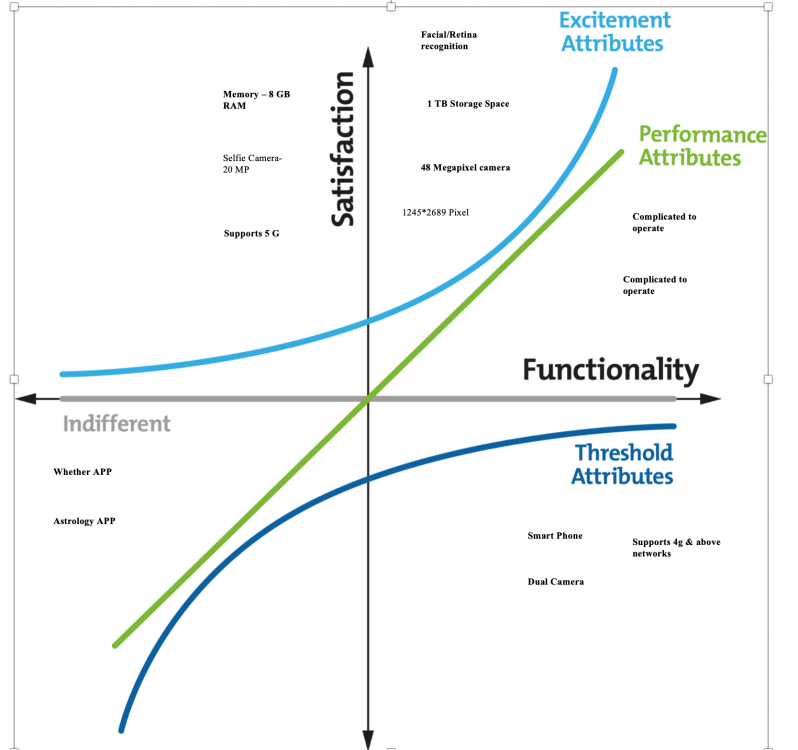
aritradasgupta187 replied to Vishwadeep Khatri's topic in We ask and you answer! The best answer wins!As a customer we always tend to buy a product and post using the same have a perception about the product. Irrespective of the fact whether we buy a new pen or a television we try to weigh the value of money that has been spent with the perceived benefits that we get post using the product or service. This is customer’s VOC and as a manufacturer or service provider this VOC needs to be collected and then linked with certain measurable criteria’s which can link customer satisfaction with these vital measurable factors (X’S). These factors for the manufacturer or the service provider is known as a CTQ (Critical to Quality). The CTQ will always be some measurable product/service characteristic which is derived from the customers need (Stated & Unstated).The company set standards which are either based on industry standards or VOC of customer and achieve the same so that the final output is as per customer’s expectation or rather exceeds customer’s expectation. The CTQ can also be based on 1.Voice of Business 2.Voice of Process 3.Voice of Employee 4.Voice of customer which has been covered above Please find one example which will help to illustrate the same :- Customers VOC CTQ 1.My Calls gets dropped Network Up Time 2.The bread is not soft Baking time/Temperature etc. There are various Approaches that can be used for CTQ drill down: - 1. CTQ Tree – CTQ tree helps to translate customers stated and unstated needs into critical to Quality parameters. These parameters should be measurable, achievable, realistic. The specifications are either given by the customer or are based on industry benchmark. 2. Kano Model – Kano model was developed in 1980 by professor Noriaki Kano which classifies customer requirement in 5 categories: - I. Must be Quality – These are features which is a prerequisite for any product or service. If this feature is there it does not leads to customer satisfaction as the buyer feels that this is a basic requirement of any product or service. Example -In hotels it’s a must that the bed sheets and the toilets should be clean. If these features are missing, then this can lead to customer dissatisfaction II. One Dimensional Quality – These are features which results in customer satisfaction if they are present in larger quantities. Example increase in internet speed can result in Customers being happier where else if the speed is less customer can be just dissatisfied III. Attractive Quality – These are qualities if presented product and services can result in customer delighter’s are features Which customers have not even thought about and the supplier has included them .example – In a clinic if parents are waiting for the doctor’s appointment creche which will take care of the kids during the wait time. IV. Indifferent Quality – These are features which if present in a product or service does not make a difference for the customer. Example in a call center extremely polite agent can still be rated bad by the customer as his problem was not resolved. V. Reserve Quality – These are features which can cause dissatisfaction or vice versa depending on the customer. Example an appliance can have a lot of features and a customer might not be technically sound which might result in him not using the product 3. QFD – Quality function deployment is an approach where the customer needs are understood and their stated and unstated needs are converted into measurable critical to quality parameter. It goes further in prioritising the CTQ based on the customers priorities. It assesses how we are faring with respect to the customers expectation & then also tries to evaluate how is the competitors performing as compared to the supplier. 1.The first step is to list down all the customers’ requirements and then rate it on a scale of 1 to 5. 5 means the customer rates the feature as something which has a great bearing on customer satisfaction. 2.The technical requirements are then listed and a correlation with the customer needs is done. Customer wants no bugs in his/her burger and bacterial count which is a technical requirement has a strong correlation with the same. Thawing time on the other hand does not impact the cooked my way which has an importance rating of 3 given by the customer. 3.Roof the of QFD where correlation between the various technical parameters are done. In the above example there is a strong correlation between # of organic supplies and # of additives in meat. 4. Competitor score is also put so that the comparison can be made 5. Then the customers rating & technical requirement is multiplied and added. A a rule of thumb strong is 9, Moderate is 3,Weak is 1 & none is 0. All the three tools have its own unique usage and a person can choose what is the requirement to make the assessment.


-
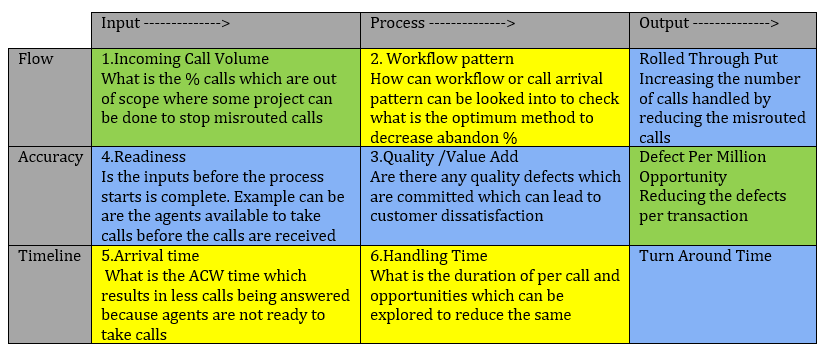
aritradasgupta187 replied to Vishwadeep Khatri's topic in We ask and you answer! The best answer wins!Þ Meaning of IPO Fat tool – This is a very Powerful tool which helps to assess business functions and to identify opportunities. This tool helps us in prioritizing the opportunities. Unlike a quality function deployment tool this tool helps us in identifying a lot of opportunities which any organization Might not have thought about. This is best suited for a process where there are multiple issues and it's difficult to prioritise which metric or opportunity should be worked upon first. This This tool can be used in any domain And it can Be used before one starts any project which can be a 6 Sigma lean project or any business process re-engineering project .This helps as a guideline as to what is the sequential pattern For any improvement journey . Þ When Can the IPO Fat tool be used – This tool can be used in any business where there are multiple problems and the root causes are not known. This not helps to prioritize which problem should be attacked first and this can also help in resolving some interrelated issues. This tool helps to understand what sequence should be used for the improvement projects. Þ Scope of IPO Fat Tool and the essential Components: - Any process will have an input process and output. IPO tool uses the same to understand what are the opportunities based on 3 critical factors 1. Flow – How the input moves across the various process stages 2. Accuracy – number of quality defect which are generated at each stage 3. Timelines – Time taken for each policy stage Below is the demonstration of an IPO Fat Tool:- In the above table the green is for all Six sigma project Yellow is for Lean project & blue is for Lean & Six sigma project As per this methodology the priority is set and it should mean that the flow should happen from 1 to 6. For example in the above example it will make sense if there is first a project to reduce misdirected calls and then work on a project for reducing abandon %( 2nd Priority) .As for those calls which are out of scope there will be not much of a business impact if we are able to pick the calls as these calls will anyway be transferred to the other department. Post which the 3rd Priority can follow where we focus on improving the quality of the in scope calls. There can be some Lean or six sigma project around reduction of not ready time. 4th Priority can be identifying opportunity around Readiness .One project can be how to reduce the system downtime so that more agents are ready to take calls which will increase the agents available and improve the overall customer satisfaction. The 5th priority should be working on after call work so that more agents are ready to take calls. Once the same is done the next priority (6th Priority) can be reducing the talk time which will help in providing faster resolution to the customer. This will result in customer satisfaction. The team can use brainstorming or other discussion to find project around the above opportunities .A lot of problem can be related and once the root cause is found for one problem and solutions implemented it can also help in resolving other problems.
-
aritradasgupta187 replied to Vishwadeep Khatri's topic in We ask and you answer! The best answer wins!Multicollinearity is a problem which can be faced by anyone who is running a regression analysis. Regression analysis helps us to get a mathematical equation between the dependent & Independent variable .This helps us to predict the dependent variable. In Regression analysis we try to assess the relative coefficient to understand the relative influence of independent variable on dependent variable. One of the important steps in regression is identifying the various factors which has in impact on our Y (Dependent factors). It is very critical therefore that we pick independent factors which are not related to each other. An example might be an organisation wants to improve their NPS score. Some of the Independent factors identified might be :- 1.First Call Resolution 2.Average Speed of Answer 3.Communication skills of the agents 4.Knowledge of the agents 5.Price of product 6.Repeat Calls In the above example while other factors are fine FCR & Repeat calls are on and the same .FCR means first call resolution & Repeat calls is the number of customers who have not got FCR.In other words they are 2 parts of the same coin. Important thing to remember that while multicollinearity will not affect the regression equation however it will make it difficult to assess whether a independent factor has an impact on the dependent factor. Multicollinearity can be identified by 2 ways :- 1.Coefficient of Multiple Determination – This is often represented by (R2) and this within the variable that's explained by all variable. If the variable is ignored we are able to calculate the Coefficient of multiple correlation (R2k) for every of the K variable. If (R2k) is 0 variable K isn't correlated with the other variable .If (R2k) is bigger than 0.75 there's a high multicollinearity. 2.Variance Inflation Factor – Variance Inflation factor is computed for every of the experimental variable . Variance Inflation Factor for k = 1 / ( 1 - R2k ) In VIFk ,VIF is that the variance inflation factor for variable K .In this equation R2k is that the coefficient of multiple determination for variable K . If the VIFk >4 then there's a multicollinearity and if its >10 then there's a really high degree of multicollinearity. How To Remove Multicollinearity :- 1.Redisign the study to style multicollinearity 2.Increase Sample Size 3.Remove one or more highly correlated experimental variable 4. Define a replacement variable adequate a linear combination of the highly-correlated variables.
-
aritradasgupta187 replied to Vishwadeep Khatri's topic in We ask and you answer! The best answer wins!Andon boards have been used majorly in manufacturing.The terminology Andon notifies the management,quality staff that there is a quality related problem. This is more of a visual display and can make use of a cord or a button which can be pulled or pressed by a worker if he feels there is some problem in the production line.This is one of the key principles used in the Toyota production system. The rational is a worker will be specialised in whatever he is working at and so he is best suited to identify any production related issue which can cause problem relate to Quality. There can be alarm raised by a worker regarding safety.This enables the worker to stop production if he knows there are issues and this drives the Quality culture cause he is taking ownership for his work. Some potential reasons why a worker can activate this might be he detects an error or some safety related issues or may be there are some tool or machines which are not working properly.This can be stated as some of the potential reasons.Once the worker has raised an alarm through the Andon board the work is stopped till a solution is found out for the problem.As a practise these problems are documented in a database so that this can be referred in future. Andon board was first used in manufacturing sector but since then it has been widely used in service areas as well :- 1.Andon board can be used in contact centre to show the number of call waiting 2.There is usage in IT department where it can show the internet speed and highlight any problems and act as a visual display 3.This can be used in banks and even have been used in parking lots to show the availability of parking space Manufacturing sector have evolved from using manual Andon boards to Andon lights which can be automated and can help to indicate any abnormalities automatically without human intervention. As we enter in 2021 there is more research happening in this field and the usage and the application is getting defined to new standards by using AI,RPA .
