P Balakumaaran
Members
-
Joined
-
Last visited
-
Developed by Charles Kepner and Benjamin Tregoe, Kepner Tregoe analysis (commonly called KT analysis) is a problem analysis model in which the “problem” is disconnected from the “decision”. It is a rational working method in the 1960s in which they formulated and defined the troubleshooting skills of people. The traditional thinking pattern involves the basic human investigative pattern, which involves: · What happened? · Why did it happen? · How should we act? · What will be the (future) result? KT methodology has 4 analysis steps, as below: 1. Situational Analysis 2. Problem Analysis 3. Decision Analysis 4. Potential Problem Analysis 1. Situational Analysis: · Identify the problems, list them in order, and stratify them based on importance, magnitude & level of influence. · Decide the priority level to measure severity of impacts (influence), urgency and growth potential · Plan the step by step approach 2. Decision Making: · Establish and classify requirements based on priority / ranking / weightage. · Categorize the requirements into “Must have” and “Nice to have”. · Assign importance factors from 1-10, where 10 is the most important and assign weightage · Generate the options / alternatives · Evaluate the alternatives by scoring · Do the risk assessment on adverse (harmful) consequences of your corrective actions · Choose the best possible option. Example 1: Example 2: 3. Foreseeing Potential Problems: · Define the action · List the potential alternatives / opportunities O{op1, op2 ,..,opN} · Consider the possible solutions (e.g. the second one) · Implement the action to address the likely cause/solution · Prepare actions to address the most likely (possible) effects 4. Problem Analysis: The 5 steps to KT Problem Analysis are as below: 1. Define the Problem 2. Describe the Problem 3. Establish possible causes 4. Test the most probable cause 5. Verify the true root cause Advantages and Key features of KT analysis: · It is a structured methodology for data collection, prioritization & Evaluation. · It is very detailed and complex method applicable in all areas · It is a root cause analysis and decision-making method. · It is a systematic approach for problem solving, decision making, and potential risk assessment. · This method involves a rational and systematic approach to analyzing a problem without jumping to conclusions or subjectivity in decision making. · This method requires team work, however it does not have the explicit steps of Six Sigma or the G8D methodologies, this can be an advantage or disadvantage depending on the problem you are addressing. · It is a faster approach compared to other methods, without statistics and Six Sigma it is quicker to progress through this method but as a result it could become difficult to detect minor variation in a process.


-
First we need to understand the difference between Value added and Non-Value added activities. These Non-Value added activities (NVA) are called as “Wastes” in the Lean world. There are 7 classical wastes, which in short was termed as “TIMWOOD”. Of late, an eight waste was added to this list (Non utilization of skill (N)), with which the acronym was termed as “DOWNTIME”. D – Defect / Scrap O – Over processing W – Waiting Time N – Non utilization of skill T – unwanted Transportation I – Inventory M – unwanted Motion / Movement E – Excess Production These wastes increase the Process Time, thus Increasing Cycle Time, in turn increasing the Lead Time. Process Time – Time taken to complete an individual activity or process Cycle Time – Net production time / Number of products produced Lead Time – Time between the Order received from Customer to Order delivered back to the customer. From Lean perspective, the ultimate goal is to eliminate all these wastes from the process. This will help to reduce the Process Time, and the saved time can be used to produce more products thus reducing the Cycle time. This will in turn help to reduce the Lead time, thus improving the On Time Delivery to the customers. This will provide the competitive edge in the market. In the practical scenario, we can not always categorize the activities as only Value added (VA) & Non Value Added (NVA). For example: a) Quality Inspection is considered as the Non Value added activity from the Lean Perspective. But, we cannot eliminate Quality Inspection and deliver good quality products to the customers. Hence Quality Inspection is a Business Value Added, which in turn is defined in Lean as Necessary Non Value Added (NNVA). b) Warehousing is considered as the NVA (from Inventory logic), however, we cannot eliminate the storage of Finished Goods in WH, which will have a direct impact on the Business. Hence this can be categorized as Necessary Non Value Added (NNVA) c) Equipment set-up or changeovers are supposed to be a Non Value Added activity (NVA). However, from the business perspective, it is not always possible to eliminate the Changeovers, as this limits the flexibility of the production line. Hence Changeovers are termed as Necessary Non Value Added (NNVA). Unlike the NVA, we cannot eliminate the NNVA, but we have to reduce them, thus reducing the impact of these NNVA’s in the process time, cycle time & Lead time and at the same time not impacting the Customer Satisfaction. Business Value-Added Activities: These are the activities for which the customer is not willing to pay for but they are needed for running the processes and the business. These business value-added activities could include work done on audits, control, reduce risk, for regulation or to support value added work. Taiichi Ohno called all these NVA as Muda ("waste" in Japanese). Business value-added activities are called Type-1 Muda while non-value-added activities are called Type-2 Muda. Some of the critical questions that can help us to demarcate the VA & NVA are: · Does the activity transform the form, feature, feeling and function that the customer is willing to pay for? · Is it being done right the first time? · Is this something the customer expects to pay for? A positive answer to all of these questions indicates that it is a VA. Even a single negative response indicates that it is either a NVA or a business value-added activity (NNVA) Note : When we stop doing the value-added activity, the customers will complain, while eliminating a business value-added activity would lead to internal customers or regulators complaining. Some of the approaches to manage the NNVA or Business Value Added activities are: Approach 1: Approach 2: ElCoMoRe : Eliminate – Combine – Modify – Reduce This approach talks about Eliminating all the Non Value Added activities, as much as possible. For NNVA – we can Combine them with other VA so that they can be done in parallel, or modify the way in which it was done (like, automation / outsourcing), or Reduce the time taken to complete this activity. This approach is also termed as ECRS : Eliminate – Combine – Reduce – Simplify. Approach 3: Theory of Constraints – this talks about identifying the limiting factor in the process, so that we can focus all the resources to eliminate the NVA and boost the VA and reduce the NNVA. This approach helps to identify the bottleneck, optimized usage of resources and enable quick & effective way to improve the customer satisfaction. Approach 4: Waste Hunting – this is an approach to hunt down the wastes in the processes, down the value-stream. This a ruthless approach to cut down all the NVA’s from the process. Though this approach is effective, many times we end with conflicts among the different process owners ,as the demarcation between the NVA & NNVA is very thin. Blind implementation of this approach may cut down and create a lasting impact on the business. Approach 5: Value Stream Mapping & Line Balancing – This helps to visualize the current state Value flow and enables to identify the bottleneck process – from capacity perspective, manpower perspective and Lead time perspective. This method throws light onto the Takt Time, to assess the Customer Satisfaction. This approach is vastly helpful in those process which involves a lot of Changeovers and SMED application is determined from the VSM. One of the effective metric for measuring the non-value-added content in a process is Process Efficiency. Process Efficiency (PE) = (Value Added Time X 100) / (Value Added Time + Non Value Added Time + Business Value Added Time)


-
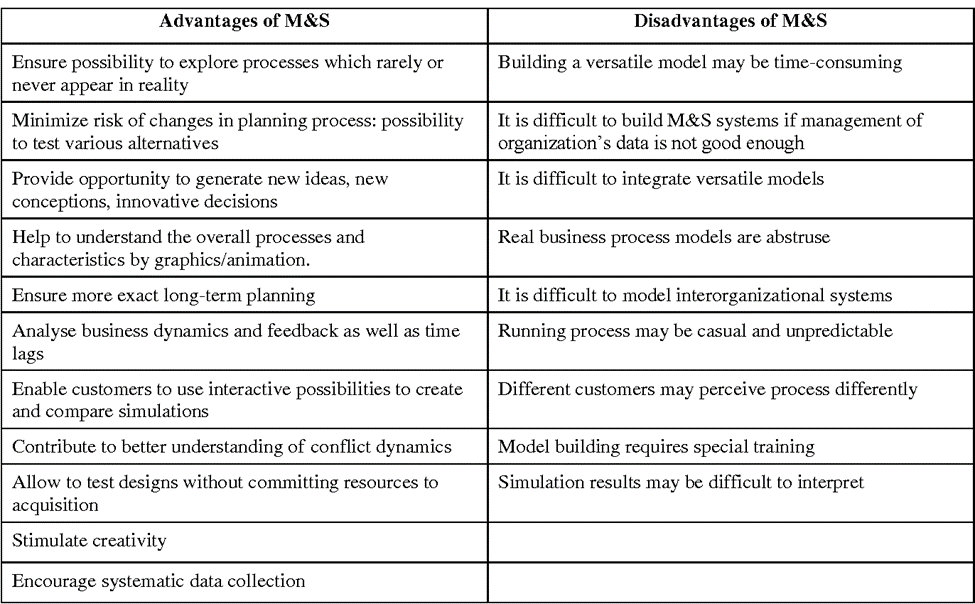
Modeling and simulation (M&S) is the use of a physical or logical representation of a given system to generate data and help determine decisions or make predictions about the system. A Business Simulation is a computer-based model of business processes and dynamics. The simulation model establishes a set of complex relationships between the business variables corresponding to significant entities in the business domain. The Business modelling and simulation in turn supports the Improvement projects driven by DMAIC methodology in the Measure, Analyze & Improve Phase. Measure Phase: The business model helps to validate the data collected during the Measure Phase. The mathematical model will help to narrow down only the significant variables, for which the data collection can be done. The simulation may help to optimize the quantum of data collected. Directly reduce the time and cost spent on the data collection. Analyze Phase: Apart from the Conventional analysis tools that we use for Problem solving, the optimization models give us an advantage to arrive at the root cause / significant variable quickly and objectively. This eliminates the subjectivity of the analyze phase. The simulation helps to validate, if the root cause / significant variable arrived from the model is valid. This also helps to prioritize the variable to work on. Improve Phase: The model and the simulation becomes the Step Zero before the Pilot run. This helps to avoid the adverse effects of implementing the wrong solution directly not the Pilot process. The model and simulation helps to see the possible impact of implementing the solution on other variables. This will definitely help to save a lot of time and money, especially helps to avoid the risk. Thus the business modelling and simulation can help to accelerate the DMAIC process for any improvement.

-
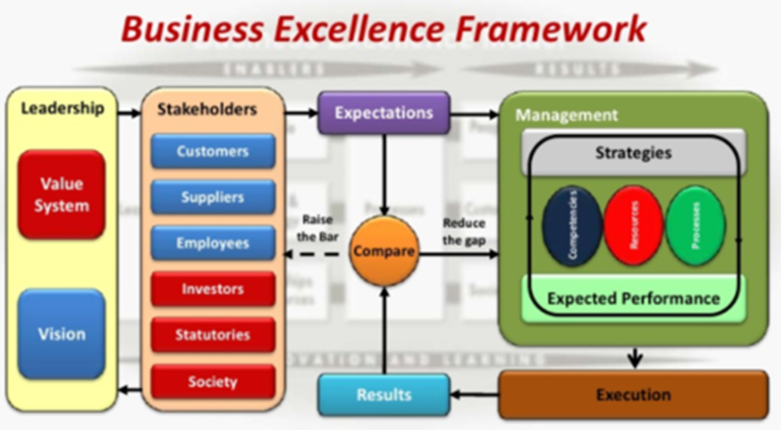
Business Excellence is defined as an outstanding practice in managing the organization and achieving the results, all based on a set of basic concepts or values. These practices have evolved over time and help describe on how a world class organization should operate. These models have been developed and continue to evolve through extensive practice and values. There has been an increasing trend for organizations to apply these models and integrate the principles and practice with their day-to-day Business operations thereby achieving the benefits business excellence brings. Master Black Belts are experts responsible for the strategic deployment of Business improvements within an organization. They develop, promote and support improvement activities in all business areas of their organization covering the entire value chain. Their main responsibilities include: 1. To provide mentoring and support the Black Belts, Green Belts and Six Sigma teams to use the improvement tools towards solving a specific problem 2. To help to develop and deploy organizational metrics and dashboards. 3. To develop, maintain and revise the Six Sigma curriculum, deliver classroom training, and serve as liaison with external agencies in the delivery of Six Sigma training. 4. To network with other Master Black Belts. A certain set of competencies are required for a MBB. He needs to be trained to be able to fill the job as a Master Black Belt. Skills and Competencies of Business Excellence MBB are: 1. Risk management 2. Change management 3. Benefit realization 4. Staff appraisal construction 5. Contingency planning 6. Business performance improvement 7. Value management 8. Business Plan improvements 9. Business directive analysis 10. Contingency Planning 11. Project planning 12. Critical analysis Some of the skills expected from a MBB apart from the technical & problem solving skillsets are: 1. Coaching skills: for other belts and six sigma teams 2. Training skills: to deliver highly effective training to all levels of audience, to build high-impact training sessions, to make vital presentations. 3. Consulting skills: to consult at different levels of an organization in an advanced strategic improvement requirement In general, MBB engage in project management, leading Lean Six Sigma projects, developing and facilitating Lean Six Sigma training, and participating in analytical project work. As a project manager, routine engagement in helping business partners think through the work that needs to be accomplished for various types of department project efforts. This involves employing project management principles such as developing scoping documents, project charters, project schedules, risk management plans, etc. Designations may vary for different organizations, however, the roles and responsibilities remain the same. Rewarding roles, a Business Excellence MBB can take are: 1. Driving Improvement projects on processes to improve a. Cost b. Quality c. Client Value 2. Overseeing the design, development of quality related initiatives and ensure quality measures are aligned with overall Business objectives. 3. Supporting business and functional team to achieve quality objectives. 4. Interacting with client/ internal stakeholders to drive and influence improvement objectives 5. Providing support towards continuous Improvement programs like Six Sigma across various functions and create and enhance value to clients 6.Leading global projects in BE 7 People management 8. Motivating and mentoring team members in managing their personal and professional goals 9 Driving the BE program for a client/ clients in a site/ across sites 10 Acting as a mentor to Six Sigma and Lean projects for his influence 11. Working with Service Delivery Leads/Functional Leads to optimize the quality of the assigned projects by recognizing, enhancing and sharing quality best practices Challenges in executing these roles and responsibilities are: 1. Liaising between the different functions, especially in the absence of or limited top management commitment 2. Most of the Business Excellence improvement projects done by MBB involve high risk, high budget & time consuming. Convincing the top management and getting the sustained support will be a challenge. 3. Getting the budget approved for the high profile Business Excellence projects. 4. Success of the MBB in the organization, will create the confidence among the top management and the teams below, which will pave way for the expansion of the improvement teams and adapting the improvement practices. 5. Creating an organization wide improvement culture.

-
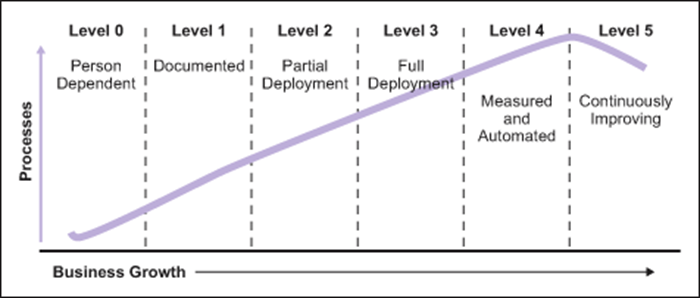
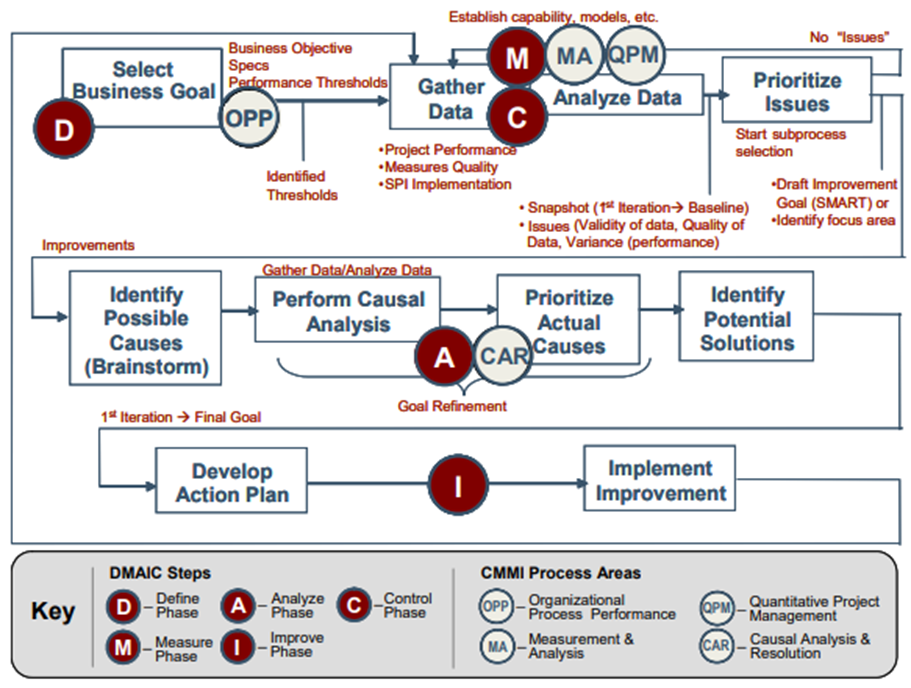
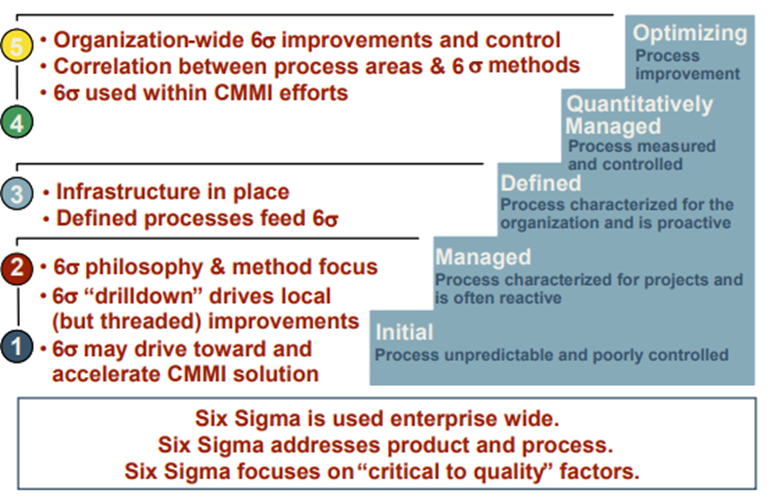
Process Maturity Model involves 6 stages : Level 0 – Person-Dependent Practices Level 1 – Documented Process Level 2 – Partial Deployment Level 3 – Full Deployment Level 4 – Measured and Automated Level 5 – Continuously Improving We cannot compare between CMMI and Six Sigma. Simultaneous implementation of these concepts in an organization produces a synergy that helps in the successful accomplishment of company goals in a faster, better, and cheaper way[4]. Some companies use integrated process architecture to integrate CMMI and Six Sigma. Such integration could take four approaches: · Implementation of CMMI to the highest level to establish systems and processes based on established best practices. Then, these practices are followed by implementation of Six Sigma to fine-tune such processes based on customer expectations and to continue with needed improvements. · Implementation of Six Sigma as the governance model first, followed by using CMMI to close problematic gaps in process infrastructure. · Simultaneous implementation of CMMI and Six Sigma by using CMMI to identify critical process factors and deploying Six Sigma frameworks in such critical factors, or using Six Sigma to identify areas where CMMI is required. · Implementation of CMMI Level 3 to establish defined processes and then establishing Six Sigma to seek higher CMMI maturity levels. Six Sigma enables the successful implementation of CMMI, or accelerate the transition from one CMMI level to another. The best approach is chosen based on the organization’s circumstances. The overall relationship between Six Sigma and CMMI The relationship between CMMI process areas and the DMAIC framework can be summarized as follows; Relation 1: CMMI Process Areas, DMAIC Steps, and Generic Practices Several CMMI process areas and generic practices align with DMAIC roadmap steps. The diagram in Fig 4 shows a flowchart of an organization’s overall measurement process, overlaid with DMAIC steps and selected process areas. While this organization’s process was designed with model compliance in mind, it represents an integrated approach to the overall use of measurement instead of a replication of the specific practices of each process area. Similarly, this organizational process leverages ideas of DMAIC, but is not a replication of the DMAIC steps The relationship between CMMI process areas and the DMAIC framework can be summarized as follows; Relation 1: CMMI Process Areas, DMAIC Steps, and Generic Practices. Many CMMI process areas and generic practices align with DMAIC roadmap steps. The diagram shows a flowchart of an organization’s overall measurement process, overlaid with DMAIC steps and selected process areas. While this organization’s process was designed with model compliance in mind, it represents an integrated approach to the overall use of measurement instead of a replication. Similarly, this organizational process takes the ideas of DMAIC, but is not a replication of the DMAIC steps Relation 2: CMMI Project Management Process Areas and Six Sigma Project Management The CMMI process areas involving project management can be leveraged in the management of Six Sigma projects. This enables Six Sigma project teams to rely on the organizational norms for things like project launches, resource commitments, and schedule tracking. The process areas that can be useful in this context are • Project Planning (PP) • Project Monitoring and Control (PMC) • Integrated Project Management (IPM) • Organizational Process Performance (OPP) (for organization-level execution, management, and oversight of the aggregate set of Six Sigma projects) Relation 3: Incorporating DMAIC Steps within CMMI-Based Processes As alluded to , aspects of DMAIC can be incorporated into the fabric of an organization’s process. As such, it would become part of the organizational approach and should be documented within Organizational Process Focus (OPF) and Organizational Process Deployment (OPD). Relation 4: DMAIC-Based Improvement of Process Areas All CMMI process areas are eligible for DMAIC-based improvement. For instance, the measurement process was created based on CMMI but also contained aspects of DMAIC. The defined process for measurement in that example, and for other processes defined based on each of the other process areas, could also be improved by applying multiple iterations of DMAIC. DMAIC & CMMI Maturity Level: When considering the implementation of DMAIC alongside a staged implementation of CMMI, You may wonder what a DMAIC methodology might look like for an organization at a lower maturity level. When at a lower maturity level, this selective improvement likely means conducting improvement projects in subsets of the organization, for instance in a specific development project, group, or product line. These projects can be managed as pilots for potential institutionalization across the organization. Case 1: A process with higher maturity provides lesser opportunities for DMAIC Case 2: A mature process open doors for many rapid DMAIC sequences I agree with Case 2. A process with higher maturity level / mature process, exhibits a well-defined system being followed and this gives a lot of opportunities to work on DMAIC in a stable environment. Both Process Maturity and DMAIC are a Continuous Improvement & never ending methodologies. Process maturity improvement happens continuously and this can be done as a DMAIC project. Not only DMAIC, it also open up the doors for DFSS / DMADV, TRIZ, and other detailed and focused improvement techniques.
-
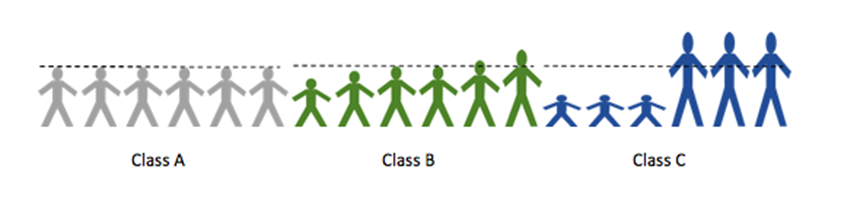
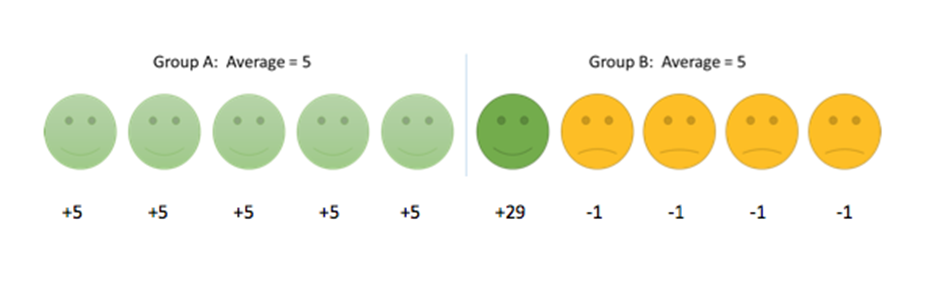
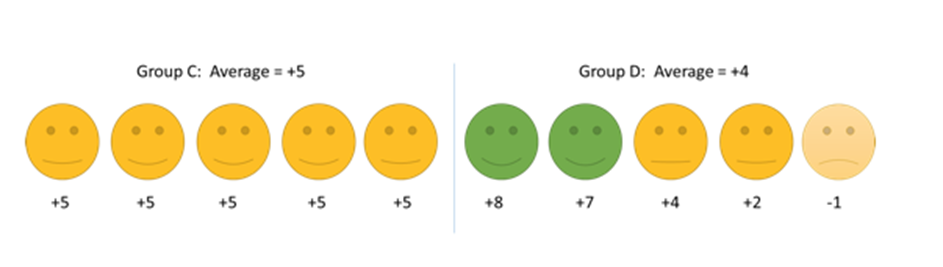
The reporting metrics from many of the organizations are not descriptive in nature. We may have noticed that the most of those metrics are based on averages or sometimes median value. The average may be misleading because of uneven spread in the results or uncertainty about whether patients had an important improvement. Some of the problems with averages are as below: 1. The mean does not show the spread of data For example, if we want to look at the height of the students in a class, the average height is the same in classes A, B and C below but the individual students height are different. 2. The spread of data may not be even In the above example, the data are spread evenly above and below the average. However, this is not always the case. One person’s data can have a large effect on the average of the whole group. For example, we ask patients to rate their pain on a 0-100 scale and the results are: Group A: For 99 people, pain reduced by 10 points; for 1 person, pain reduced by 50 points. Group B: For 99 people, pain reduced by 10 points; for 1 person, pain increased by 50 points. The average is a 10.4 point improvement in group A and a 9.4 improvement in group B. Based on the average, the treatment in group A looks better but, in reality, for 99% of people, both treatments are equally effective. In this case, the mean is misleading since two people with extreme results are pulling the average up or down, so it does not represent the population as a whole. This is what will happen when there is a ‘skewed’ distribution because of extreme outliers. In a similar way, two groups can have the same mean result, even though most participants do better on treatment A but there is just one patient who does really well on treatment B, as in the example below. 3. The mean does not show how many people had a significant improvement Another way in which the mean can be misleading is that it does not give us information about how a patient’s improvement relates to whether they had an significant change. Sometimes this change is referred to as the minimum significant difference. From the example below, the average of group C seems better than group D since they improved by 5 points on average compared to 4 points in group D. However, if a minimum 7 point change is needed to be significant in the patient, no patient in group C experienced a significant change but 2 people in group D did. In terms of the proportion of patients who have a significant improvement, group D is better than group C. The average in this example is misleading as it does not show which patients have an significant change. When the average is higher in one group, it does not mean that the treatment was better for the other group, since most patients do not experience the ‘average effect’. Averages are meant to be a measurement across a diverse group of samples. The main purpose of averages is to measure changes over time in the same sample group. Three common errors that can happen by following only the averages : 1) Any data set will have outliers. These outliers tend to skew the average of the dataset to “pull” it in their direction. 2) Many people tend to think of “average” as “typical”, the problem with that assumption is that, there are many, exceptions to “typical.” For example, the average obesity rate in the United States, which is often cited as “about 50%.” If one researches the question, they will discover average obesity rates vary widely based on factors such as age, level of educational, profession, genetics, etc. As such, everyone is categorized differently by these factors resulting in many different average obesity rates depending on which factors describe those being measured. 3) Averages of often wrongly used is in characterizing individual scenarios. It is statistical err to apply the average of a group of data points to a single point and expect it to be true. Even assuming data as normally distributed, the probability that any one data point will be the same as the average is 50% — the same as a random guess. Solution: The problem is “Customers do not feel the average — they feel the variation”. The in-depth view of the business is based on average based measures of our performance. Customers don’t weigh us on averages, they feel the variance in each performance, service, each product, each interaction we have on the phone, each correspondence we have through email or a letter, and every other process that touches the customer in one way or other — online or offline. Customers expect a consistent, predictable business processes that deliver world-class levels of quality. They feel the difference, not the average. A few examples For qualitative measures, the feel, Visual, taste, smell et., of a product, we do not think in terms of an “average”. Instead, the customers weigh them by relative measures and the difference between them. For Example , 1) “the coffee from Cloudbucks tasted better than that from Coffeenight, (or) the perfume Wildrock smells good compared to the Axel perfume.” The customers feel the difference, not the average. That’s the reason we define Quality based on Customer’s perception. For quantitative measures, variation and not the average, that works well. The customers tend to perceive the variation from the previous event. For Example, 1) ”The last time I ordered from EKart, I received that package in 3 business days; but, on other times I receive my order usually after 6 days on standard shipping” Ekart may calculate and report their average lead time as 3 days which may not account the instances when the lead time were more than 3 days (dissatisfied customer) and those events when it was less than 3 days (happy customer). 2) ”Yesterday when I went to PizzaHouse during lunch hour, I was in and out of there within 30 minutes, but on other days I’m there for my whole lunch hour” PizzaHouse may advertise as their average service time as 30min, which may not account those events when it went >30 min (dissatisfied customer) & those events when it was <30 min (happy customer). In general, the organizations that report averages, are not concerned about both happy customer and the Dissatisfied customer. They only race towards the average customer satisfaction. “On average, our customers are 90% satisfied”- a popular tagline by some businesses and organizations. If I have a bad experience with a vendor, I don’t cognitively step back and think that I have been a customer for this vendor during last 10 instances, and I had only one bad experience, so far, so on average I’m 90% satisfied. Customers experience good or bad, as it is and their future behavior, purchases and recommendations are shaped by these experiences. To further add to it, cognitive biases such as negative and recency bias often interject and give disproportionate weight to these positive or negative experiences, reinforcing them and the resulting behavior that follows it. In probability theory and statistics, the coefficient of variation (CV), also known as relative standard deviation (RSD),[citation needed] is a standardized measure of dispersion of a probability distribution or frequency distribution. It is often expressed as a percentage, and is defined as the ratio of the standard deviation to the mean (or its absolute value. The CV or RSD is widely used in analytical chemistry to express the precision and repeatability of an assay. It is also commonly used in fields such as engineering or physics when doing quality assurance studies and ANOVA gauge R&R. In addition, CV is utilized by economists and investors in economic models. It shows the extent of variability in relation to the mean of the population. The coefficient of variation should be computed only for data measured on scales that have a meaningful zero (ratio scale) and hence allow relative comparison of two measurements (i.e., division of one measurement by the other). The coefficient of variation may not have any meaning for data on an interval scale. Hence Standard Deviation, Variance and Co-efficient of Variation are some of the alternatives to the averages, while presenting the performance to the Customers.
-
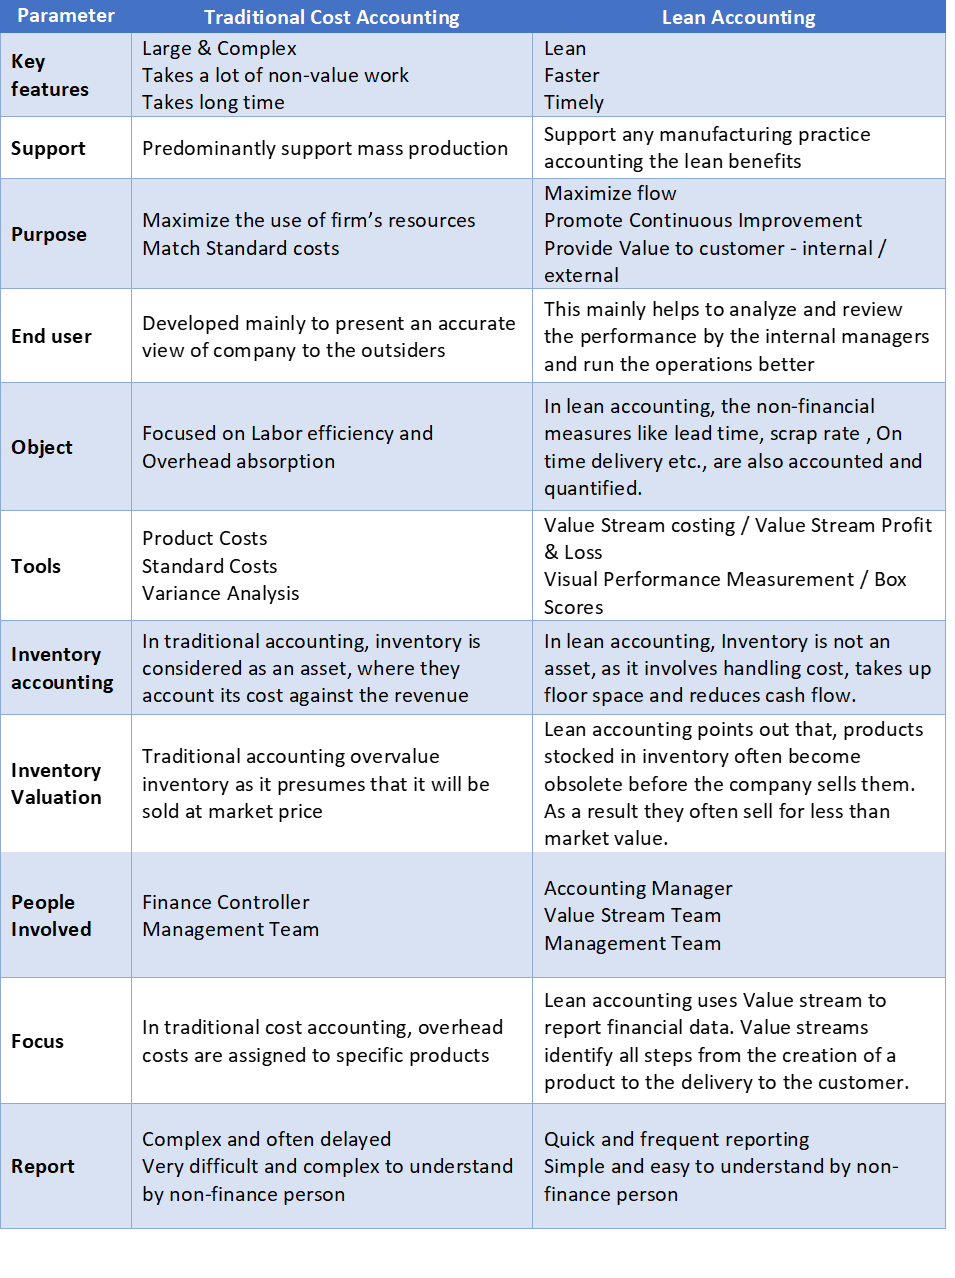
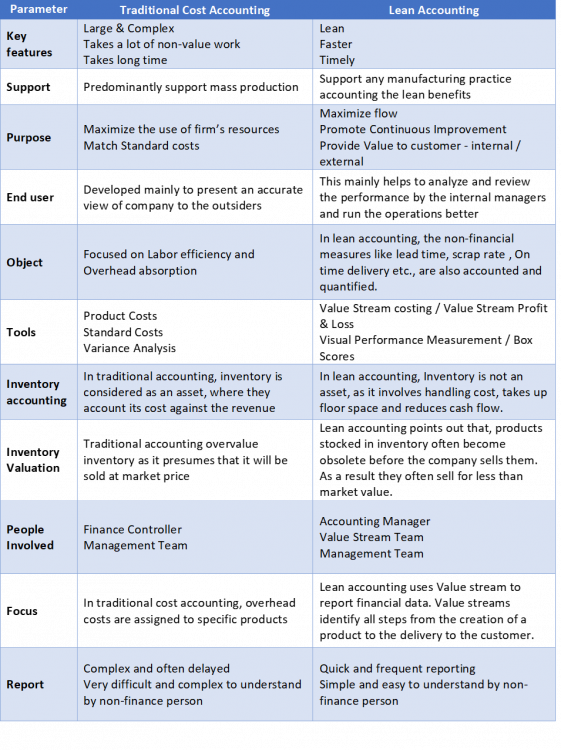
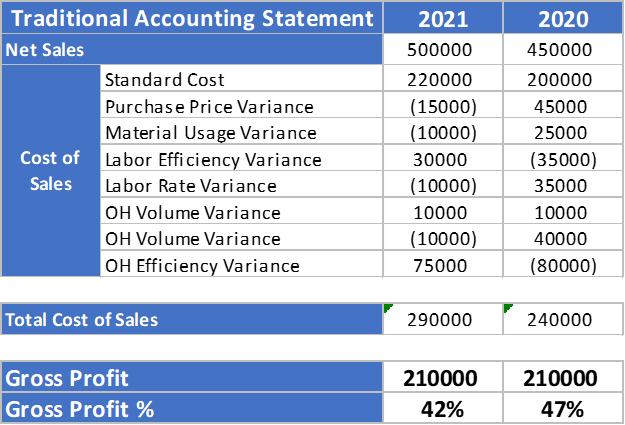
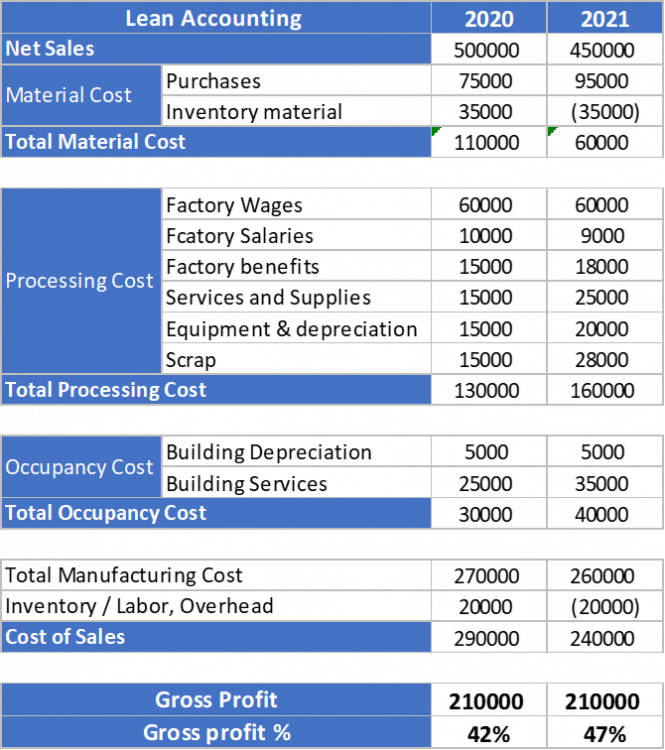
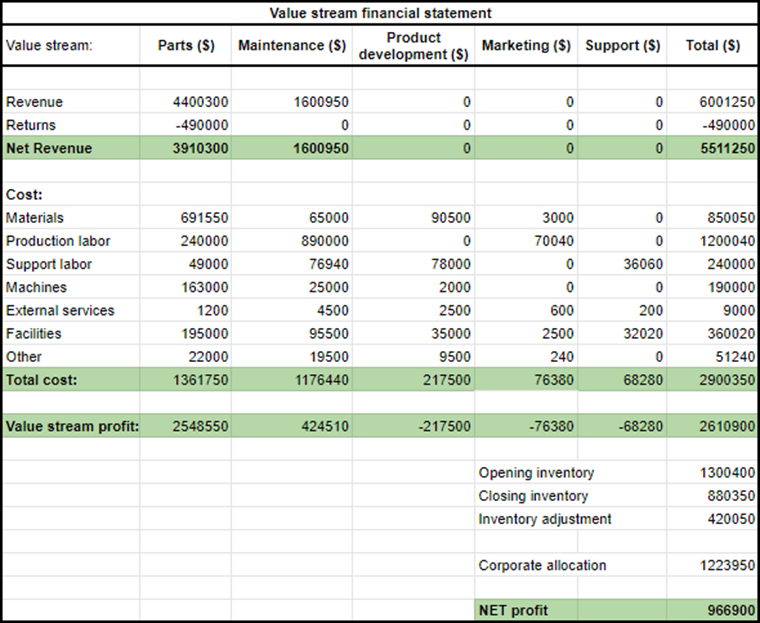
Lean accounting is the financial reporting practice in organizations that involves Lean thinking: focusing on value creation and on waste elimination through better workflow and material management. Lean accounting aims at aligning financial management with your company’s Lean strategies. Why use Lean accounting? The traditional accounting practices makes accurate cost measurement challenging. Of-late, the focus of cost accounting shifted from information for planning to information for control. Hence the businesses turned away from cost tracking to cost allocation. Lean Accounting is applicable to any company, in any industry, that deploys Lean strategy. Lean accounting helps in streamlining accounting processes within a company to maximize productivity, service, quality, and profit. Lean Accounting can be defined this way: Lean Financial Accounting – means applying lean practices to accounting processes A Lean Management Accounting System - supports any business that is Lean Lean Financial Accounting –> Lean for Accounting Lean Management Accounting -> Accounting for Lean Characteristics of Lean Accounting: 1. Value Stream oriented thinking 2. On demand accounting 3. Delivering what the customer’s value 4. Process execution before accounting Differences between Traditional Accounting and Lean Accounting: Lean accounting uses a number of concepts and tools to maximize efficiency and profit. Lean accounting focuses on looking at data differently than traditional accounting. One main approach to lean accounting is how the inventory is stored and accounted for. A lean company will generally have less inventory at any given time to maximize short-term profits. Inventory will be captured on the balance sheet as the total value of all inventory, rather than allocating the value based on individual products. Examples : Advantages of lean accounting: 1. Cost control: lean aims at increasing profits and decreasing wasted costs. 2. Improved company culture: one of the main advantage of lean accounting is a lean culture, which will encourage teamwork, communication, and improved processes. 3. Less ‘waste’: lean helps to decrease ‘waste’ such as defects, outdated tools, unnecessary costs, and slow processes. 4. Financial management practices: lean accounting involves management decisions based on total value stream profits rather than cost allocation. Disadvantages of lean accounting: 1. Difficult to switch from traditional accounting: Switching to lean accounting will involve lots of new processes which makes it difficult and it slows down the process 2. High cost of implementation: Even though lean accounting is all about maximizing profits, the cost of implementing lean accounting is high and complex. It has to be done in small steps over a long period of time. 3. Inventory problems: One approach to lean accounting is keeping low amounts of stock to increase short-term profits. This is helpful in a stable market condition but may prove adverse at changing market conditions. 4. Having to do 2 sets of financial reports: lean accounting reports cannot replace standard reports, as per countries legal requirements. The accounting department may have to run 2 different sets of reports if lean accounting is implemented. The accounting software will only be able to create standard financial reports.
-
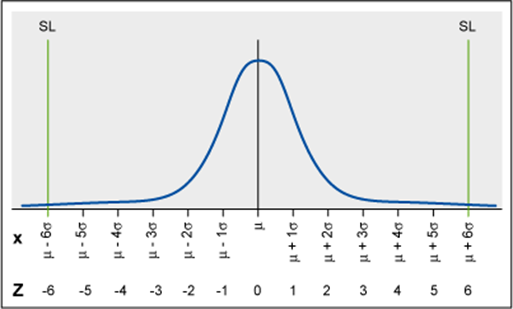
Six Sigma is a data driven approach which aims at reducing the variation in a process. As per the Measure of Central Tendency, mean and SD are the 2 important parameters that helps to characterize a process. Mean helps to define how far the process is performing from the specification (target), whereas Standard Deviation helps to define the Spread or Variation in the proces. In general, we assume that the process data is normally distributed. From the Normal distribution curve, the distance between the Process mean and the Specification mean can be measured by counting the number of Standard deviations between them, which is denoted by Z (Sigma level). A 6-Sigma process has the specification limits which are 6 standard deviations from the specification mean (as shown below). In a process, any value that lies between the Specification mean and the Specification Limits (USL & LSL), is called a defect. Sigma level can be calculated for both the continuous data and Discrete data available from the process. Continuous Data – anything that can be measured. Eg – Weight, Length, Diameter, Temperature etc. Discrete Data – anything that can be counted or classified. Eg – number of products, number of samples, number of pallets, Classification of Good products & defective products etc. Sigma Calculation for Continuous Data: To calculate the Sigma Level for Continuous data, we need to calculate the CpK. CpK = Min [(USL-Xbar)/3σ, (Xbar-LSL)/3σ] Process Sigma = 3 * CpK Example: Specification Mean = 50 mm Upper Specification Limit = 50.1 mm Lower Specification Limit – 49.8 mm Standard Deviation = 0.02 mm CpK = Min [(50.1-50)/(3*0.02), (50-49.8)/(3*0.02)] CpK = Min [1.67,3.33] CpK = 1.67 Process Sigma Level = 3*1.67 = 5 Conclusion: If the number of defects are Zero means, all the measured values are falling within the specification limits. But that doesn’t mean that the Process mean is equal to Specification mean. The normal curve which we draw for the continuous data is an asymptote – which never touches the X-axis and the area of the curve can never be 100%. Hence it is not possible to calculate the Sigma level for zero defects , in other words, it is practically not a feasible situation to get zero defects, even in a stable and consistent process. Sigma Level Calculation for Discrete Data: In order to calculate the Sigma Level, the following steps can be followed: 1) Define the number of Opportunities (O) – which is the number of lowest defects noticeable by the customer 2) Define the number of Defects (D) - which is the number of values that deviate the specification limits in actual 3) Calculate Yield = [(D)/((U)*(O))] 4) Look up for the Sigma Level from the Yield to Sigma Conversion Table. Example: # Opportunities = 10 # Defects = 5 # Units = 4 DPO = 5/(10*4) = 0.125 DPMO = DPO *1000000 = 0.125*1000000 = 125000 From the chart, we can find the Sigma level = 2.65 We can also calculate the sigma level in excel using the formula below: Sigma Level = -NORMSINV(DPO)+1.5 Sigma level = -NORMSINV(0.125)+1.5 = 2.65 Note : This formula accommodates the 1.5 Sigma shift that happens in any stable process over a longer term. In this case, lets assume that, number of defects as Zero. # Opportunities = 10 # Defects = 0 # Units = 4 DPO = 0/(4*10) = 0 DPMO = DPO * 1000000 = 0 Conclusion: This usually happens when we collect samples over a shorter period of time or sometime when the samples are biased. This will give a false indication that the process is very good. In fact, this is only possible because we did not have a sufficient sample size. Hence Sigma level cannot be calculated for a process with Zero defects or in other words, zero defect process doesn’t exist on a longer time period and we need to collect sufficient sample size.


-
DOE was first proposed by R.Fisher in 1920s. As all factors should be taken into account, Full Factorial Designs (FFD) will undoubtedly give the most accurate results. However, this method is not practically preferred, as it includes too much experiments, which is time consuming and costly. For example, when 4 factors with 2-levels, we have to manage 16 experiments (2^n = 24). But in practice, the number factors may not be as small as 4. For example; 15 factors with 2-levels need 2^15 = 32768 experiment to do. Therefore, to reduce the number of experiments, fractional factorial design has been developed. 1. Taguchi Method (TM) Genichi Taguchi simplified classical DOE by using orthogonal arrays (OA). Taguchi created new methods on the improvement of product and process, which includes, "Taguchi Loss Function" and product/process design with three approaches - "System, Parameter and Tolerance Design". He simplified the Fisher's DOE by using Orthogonal Arrays (OA). He used the signal/noise (SN) ratio to reduce variation in the experimental design. TM also used the SN ratio, which is used to predict the loss of quality, to maximize the robust design’s objective function. SN ratio takes the test results’ mean and variance. 2. Shainin Method (SM) The modern approach to the DOE is Shainin Methodology. This strategy is based on detection of the one, two or three dominant causes of the process variations by focusing on a problem response. Dorian Shainin developed this method to reduce the process output variability, It is simple, relatively easy to understand and implement, but uses the combination of powerful statistical techniques, to make it more reliable and faster to achieve results. In this method, the problem of the poor quality and causes of this problem are identified by the colors of Green, Red and Pink. These parameters, named Red X, Pink X and Pale Pink X, are ranked based on Pareto Principle. Green Y: Indicates special quality characteristics that are important to customers Red X: Indicates the dominant cause of the variation and it contains at least 50% of the causes of variation (Green Y) Pink X: Indicates the secondary cause to the overall variation. It includes 20-30% of the Green Y. Pale Pink X: Indicates the tertiary important reason. It causes to 10-15 % of the Green Y . With SM, the analysis variation can be reduced by 75% to 95% for the causes of the Green Y (Red X, Pink X and Pale Pink X). SM has mainly 12 techniques, of which, 9 are problem solving and 3 are controlling and preventing any repetition of the solved problems. Comparison between Taguchi DOE Vs Shainin DOE methods: Also, the Pro's and Con's of the 2 methods are listed below and it helps to choose the best appropriate method, based on the requirement Some of the risks associated with Shainin DOE method is listed below: 1. This method focuses only on the analysis of mean response and does not take into account the variability of 2 different responses. 2. It can help only upto 70%-80% reduction of the problem, as it focuses on Vital few. The impact of the remaining causes are to be accounted with further more iterations. 3. Grouping of the causes and progressive elimination method, may result in eliminating some significant causes.


-
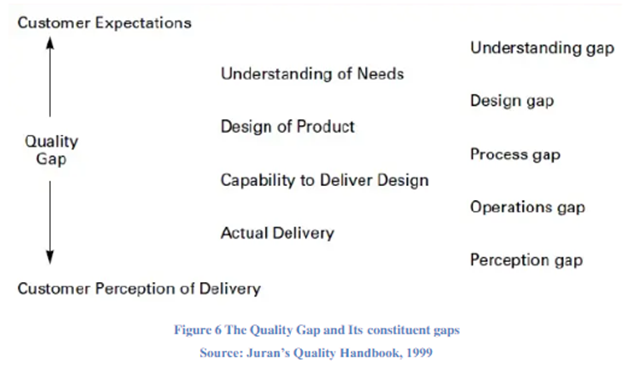
In 1986, Dr. Joseph Juran presented “The Juran’s Trilogy” also called as Quality Trilogy, as a means for Quality Management. Though the traditional method was Quality Control based on the specifications and the requirements, Juran introduced the best practice and the an improved approach. Some of the Juran's definitions / phrases about quality: “quality does not happen by accident” “Quality means fitness for use" The basic concept is that Quality Management consists of 3 processes: • Quality Planning (Quality by Design) • Quality Control (Process Control & Regulatory) • Quality Improvement (Lean Six Sigma) The Juran Trilogy diagram is presented as a graph (as below), with time on the X-axis and cost of poor quality (COPQ) on the Y-axis. Explanation on the Juran’ Trilogy Chart: The initial activity is quality planning, in other words, ‘Quality by Design’ .This could be applicable to a new product, service, process, etc. On a practical scale, getting a 100 percent defect free product/ service is not possible. This is mainly because, there are inherent errors or process variations that require rework. In the diagram, more than 20 percent of the work must be reworked due to errors. This is a chronic problem / waste (from Lean perspective) —it continues until we find its root causes and remove it - the Cost of Poor Quality (COPQ). In the diagram, we can see a sudden sporadic spike against the failure level to more than 40 percent. This spike is due to some unforeseen event such as a power failure, process breakdown, or human error. In order to control the process , the operating team group together and take the necessary action to restore the status quo. This is often called corrective action or troubleshooting. The objective is to restore the error level back to the planned chronic level of about 20 percent. The diagram also shows that in due course the chronic waste was reduced down to a level far below the original level. This benefit was obtained from the third process in Juran’s Trilogy—improvement. Quality Planning (Quality by Design): The design process is an innovative process in designing the products, process etc., based on customer defined specification limits and functional limits. This is the process where we strive to meet the functional requirement of the product / service, which is also called as DFSS – Design for Six Sigma (DFSS). Implementation Steps – Quality Planning: To determine the Consumer for whom the product / service is designed and categorize in different horizons. Determine what consumers need or want. We must be able to identify consumer needs that have been determined in the first stage. Example : Performance, Features, Reliability, and Conformity with specifications, durability, service, aesthetics, and perceived quality. To develop products with features that respond to customer needs To develop systems and processes that enable organizations to produce these features: SMEs must think and plan all components of the process that determine the quality features or dimensions needed by consumers. The final step is to spread the plan to the operational level Quality Improvement (Lean Six Sigma): Incremental improvements is the key approach for every organization to strive in the competitive environment. Among the day-to-day improvements done, Breakthrough Improvements require special methods, approach & leadership commitment to attain the results. The first step is to understand what is preventing the process form meeting the customer requirement and needs. This step follows the Pareto Principle to identify the vital Breakthrough improvements that can help the organization to outperform its competitors and meet stakeholder needs. Implementation Steps – Quality Improvement: The Quality Improvement should be continuous and continual. The different steps involved in the implementation of Quality Improvement: To Develop the infrastructure to make annual quality improvement: to invest in machines or tools needed for product quality development. To Identify the specific areas of improvement and implement projects: to determine what priority dimensions should be developed to assign key performance indicators. To establish a project team with responsibility for completing each improvement projects within the targeted timeline To Provide teams with what they need to diagnose problems to determine root causes, develop solutions and establish control that will maintain results achieved. Quality Control (Process Control & Regulatory): The concept was to widen the approach from detection control to prevention / proactive control. Earlier, the word “control” had a broad meaning, which included the concept of quality planning. The formulation of SQC gave the impression that quality control consisted of using statistical methods. Nowadays, “quality control” in general means quality control and compliance. The objective is to comply with international standards or regulatory authorities such as ISO 9000. The traditional terms / functions are QC, QI and QP while recent development has given rise to the new terms / functions QA/QC, CI and DFSS. Implementation Steps – Quality Control: The Quality control involves the following steps: To assess actual quality performance - to measure the product quality directly in the field, set the sample analysis, record and process it into information. To compare performance against the customer specification - to compare with the criteria set in the planning stage to analyze whether there are deviations. To work on differences between the actual performance and the customer specification. Understanding the application of Juran's Trilogy in Nokia - Microsoft Collaboration: 1. Financial Practices: The accounts transaction between Microsoft and Nokia aims to prevent wastes and at the same time not affect any opportunity to invest into future innovative projects, which is done through meticulous planning. Hence, Nokia referred to Juran’s method on “Quality Planning” because if they do not have proper planning, their products might be too costly and it is not economically affordable by many consumers. 2. Performance Practices: This practice is related to Juran’s “Quality Improvement” approach. However Nokia has slightly lose out because even though the product has been maintaining its durability feature, it is still not up to current consumer’s trend. Nokia faces strong competition for example, Samsung is famous for its mobile features, user friendly & reliability. This may be the reason for Nokia to depend on Microsoft. 3. Product Practices: The Product practices of Nokia are related to Juran’s “Quality Improvement”. Nokia has done an excellent job on this by having the manufacturing facility across different countries. Therefore, if one country gets affected with natural disaster, Nokia can still depend on other country to continue its production. This a continual improvement process that helps maintain the business continuity of Nokia. 4. Strategic Practices: Windows Phone 8 came as a product of Nokia and Microsoft. Nokia understood that the only way to compete with its competitors is to collaborate with a company that has wide spread presence geographically and demographically, Microsoft. Hence this implies to Juran’s “Quality Control”. 5. Functional Practices: Nokia has a very direct organization structure that plans its department to handle and organize Nokia’s business activities to assemble devices, produces software and sales etc. This practice is based on Juran’s “Quality Planning”.


-
In 1994, Robert Dilts proposed The Disney Creativity Strategy (also known as Disney Brainstorming Method or Disney Creativity Method) that created this 100 billion kingdom. This is an effective roadmap for the incubation of many products and projects for thirty years. The Disney strategy use three step approach to identify project goals, clear paths, and avoid risks as shown in the Venn diagram below. Disney’s Creativity Thinking Process Disney’s strategy works based on 3 roles — to generate ideas, evaluate ideas, construct and criticize a plan of action structured in three thinking styles: dreamers, realizers, and critics. This creative process unlocks the mind’s capabilities to dream and form unexpected ideas and solutions for existing problems, which may not be applicable in reality. This method emphasis on the balance between the dream and reality in order to enhance the viability of the solution proposed. The three creative thinking styles are – dreamers, realizers, and critics. In the first mode, the group uses divergent thinking to conceive creative and radical ideas, to brainstorm ideal solution. In the next mode, the group takes a realizer viewpoint. Here, the ideas left by the dreamers are reviewed through convergent thinking by the pragmatic realists and they select the best idea to create an action plan. The final viewpoint is that of critics, where they review the plan made by the realists in order to identify weaknesses, obstacles or risks. The dreamer Any creative idea starts with a dream, devoid of the realism and practicality. In conventional meetings, this dreaming style is halted by reality. The first stage allows the team to share their dream without no restrictions or criticism, thus creating a pool of creative ideas. Following questions are asked by the dreamer: 1. What do we want? 2. What is the solution? 3. How do we imagine the solution? 4. What are the benefits of applying this solution? The realist The team switches the place and mode to think in a more logical style. Now, the attendees pretend that the dream is possible and start putting plans to turn the imaginary ideas into an achievable action plan. This is a constructive approach and it includes questions such as the following: 1. How can we apply this idea in reality? 2. What is the action plan to apply the idea? 3. What is the timeline to apply this idea? 4. How to evaluate the idea? The Critic The critic thinking mode tends to discover the limitations of applying the idea and how to overcome it. Now, the team provides a constructive critique for the idea in order to find the weak points and solve it in the final solution. Following questions are asked by the critics: 1. What could be wrong with the idea? 2. What is missing? 3. Why cannot we apply it? 4. What are the weaknesses in the plan? 5. How to Create Disney’s Creativity Strategy in Team Afford? 6. Why does this strategy work? Disney used the same strategies to keep his staff coordinated towards a particular project. He literally moved each of his staff between 3 rooms. Each room had a different function. Room 1 Was The Dreamer Room – Room 2 Was The Realist Room – Room 3 Was The Critic Room – We can use readily available Disney Creative Strategy templates available in the visual collaboration platforms, such as Miro or Klaxoon. Advantages of Disney's Creative Method Vs De Bono's Six Thinking Hats: 1. It is a step by step approach where it starts with Dream, Reality check & Criticism, where as, Six thinking hats doesn't follow step by step approach. 2.No confrontation of ideas or difference of opinion, as every one will be going through each phase together. In Six thinking hats method, people can still disagree strongly and there can even be conflicts about different perspectives. 3. This uses both divergent and convergent way of thinking whereas Six thinking hats use only convergent way of thinking. 4. Six thinking hats is a time consuming activity compared to Disney's method. Disadvantages of Disney's Creative Method Vs De Bono's Six Thinking Hats: 1. There is a Blue Hat which will manage the ideas generation process in Six thinking hats, which is missing in the Disney's method. 2. Six thinking hats is more of a pragmatic approach where as in Disney's method a lot of time is spent on impractical ideas and how to make them realistic.


-
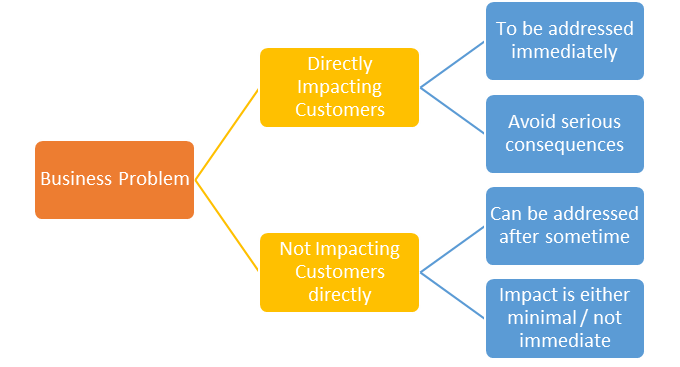
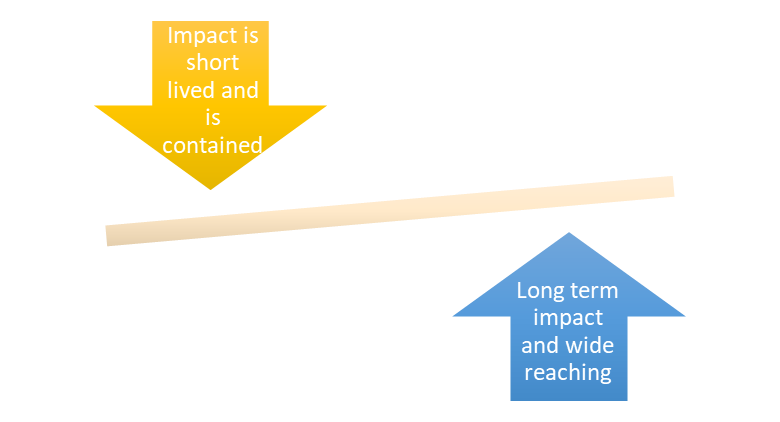
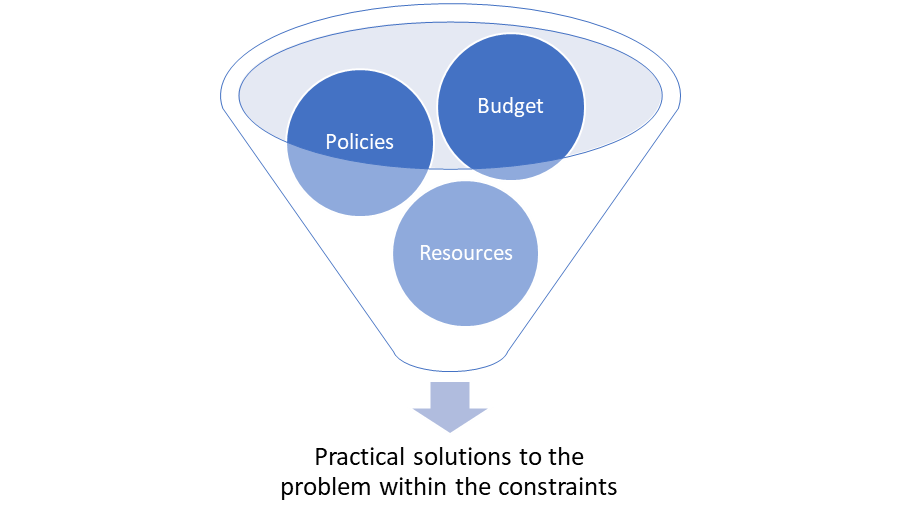
History : The British systems thinker Peter Checkland developed the Soft Systems Methodology (SSM) while working at Lancaster University in England, during late 1960’s. SSM is a tool widely used for analyzing unstructured data related to individual perceptions. This approach was developed for dealing with the problems faced in the business. It is an action-oriented process of inquiry into problematic situations in which users learn their way from finding out about the situation, to taking action to improve it. It was David Smyth, a member of Checkland’ s team developed the CATWOE method to make SSM more successful, in 1975 to which, Peter Checkland added the W (worldview). Understanding: CATWOE is an acronym that stands for C - Customers A - Actors T - Transformation process W - World view O - Owners E - Environmental constraints. It’s a simple checklist that provides surprising solutions and stimulates multiple approaches, to the problems faced. The CATWOE Analysis makes it possible to identify problem areas, look at what a business wants to achieve, and which solutions can influence the stakeholders. C – Customers: The most important pillar of any business are the Customers. It only makes sense to consider their needs as the top priority when solving a problem. If the problem has a direct impact on the customers then it needs to addressed immediately to avoid serious consequences. If this a ‘behind the scenes’ problem that won’t be impact the customer, at least immediately, we may have more time to solve the problem without an adverse effect on day to day operations. A – Actors: The ‘actors’ are those involved in any business problem and will likely be involved in its resolution. Usually the actors, include a number of employees, vendors, consultants, Government agencies etc. It is important to chart out the role and the contribution level of each actor in the problem scenario. T – Transformation Process: Businesses are made up of a number of processes that are executed on a periodic basis, executed in parallel & sequential manner. A process is defined as an activity to transform the input into an output. In this segment, we discuss and ask questions pertaining to how the problem impact the different steps of the process and how other process are impacting / impacted. This is an important step where wholistic view is carried out, and enables to identify to prevent similar problems in other process through horizontal deployment / Best Practice sharing. W – World view: This is the stage where we step back from the conventional approach and start seeing the bigger picture of the problem. Here we assess whether the problem is going to have a long-lasting effect or is short lived. Also, we can assess the impact level of the problem – contained within a zone or it has a wider reach. Looking at the problem from a ‘world view’ will help to get a judgement on just how important it is in the scope of your business. O – Owners: This is about the process owners / problem owners. The important questions to ask are Who should be taking the ownership of the situation? Are they part of the problem? Can they be part of the solution? Assigning ownership of the situation is important because this creates a special focus on to this problem and it is always a better idea to have a Cross Functional Team working with the process owner to solve the problem. This will help to see the problems from different perspectives. E – Environmental Constraints: This last step in the process is critical because it brings us back to the reality in terms of how we can solve the problem. Here we try to map the potential solutions against the realistic constraints with which we are working. Some problems may have obvious solutions – but those solutions may be impossible to implement due to environmental constraints such as your budget or the time availability, resources etc. Application: CATWOE is basically a tool used for analyzing the business problem from different directions to identify the possible root causes, prioritize the problem, derive the potential solutions and filter out the most feasible / practical solution within the limitations / constraints. From the Problem Solving perspective, CATWOE is the most suited for identifying the problems. CATWOE analysis may not be a right choice for small, routine problems, but it would be a great idea to use it for larger, significant business problems. This six-step approach to problem solving will ensure that we are thinking about the problem from all perspectives, and we should be able to come to a smart and viable resolution. It is a time taking process but it is worth spending time on this method, as it throws interesting solutions.
-
The Reliability Block Diagram is used for industrial and commercial power systems. It is a graphical presentation of a system diagram based on reliability or functional logic; i.e., connecting subsystems or components according to their function or reliability relationship. The significance of RBD is that it is easy to read. It is easily understood by customers who purchase the critical power systems, by the people who sell the systems, by engineers who design and test the systems, and by managers who make decisions on the systems. With knowledge of the system design, engineers can easily construct, verify, and modify the RBD, and also communicate with those of different functions. It is generally drawn from top-down, left-right approach, depicting the system element functions. The 3 types of RBD are Series, Parallel and Combination of Series & Parallel elements. An example of Reliability block diagram Reliability is typically calculated as below: Reliability = e-λt λ (lambda) = Failure rate = 1/MTBF t = time in cycles, hours, miles, etc. e = natural logarithm = 2.71828 RBD can be used in the following phases of DMADV: Analyze Phase - To identify the to identify potential areas of poor reliability and where improvements can be made to lower the failure rates for the equipment Design Phase - To construct / design the system & subsystems thus improving the reliability from the functional perspective Verify Phase - To check if the newly designed system / subsystem is able to eliminate the potential bottlenecks identified with respect to reliability are improved. This provides a useful benchmark to refer to when looking back at how the system used to perform, and whether the system’s current performance is as expected and is based on the model created.