

Shashikant Adlakha
Members
-
Joined
-
Last visited
Everything posted by Shashikant Adlakha
-
Shashikant Adlakha replied to Vishwadeep Khatri's topic in We ask and you answer! The best answer wins!Stratified sampling is a popular statistical method to allocate the population into strata/subgroups. The stratum should essentially be a representative of a subpopulation of the entire population. Each member of the stratum should be mutually exclusive, should not be included in more than one stratum. After allocating the population into different strata, simple random or systemic sampling is applied. The purpose of doing stratified sampling is to reduce the sampling error. The weighed mean obtained is much less variable than the arithmetic mean of simple random sample. Stratified sampling strategies : 1. Proportionate allocation: The sampling fraction in each of the stratum is proportional to that of proportion of stratum in total population. This kind of sampling is commonly used. Suppose there are three groups/strata- A,B,C with size of 50, 70, 80 respectively-Total 200 and we have only resources to study a total of 60 individuals, so we will have samples- with group A-(50/200)*60- 15 samples, group B- (70/200)*60-21 samples and group C- (80/200)*60-24 samples 2. Optimum allocation/disproportionate allocation: The sampling fraction is not proportional to the fraction/size of the stratum in the entire population. Rather it is proportional to the standard deviation of the distribution of the variable in the stratum. So, largest sample are taken from the stratum with greatest standard deviation or the variability to obtain the the least possible total sampling variance. The best example is - economical surveys, which fails to form homogenous strata. So optimum allocation is preferred. Advantages of stratified sampling: - Stratification leads to more precision and smaller error in estimation, if measurements in strata have lower standard deviation. - By stratified sampling, we get estimates of population parameter of different groups. Disadvantages of stratified sampling: - Analyzing entire population and allocating into subgroups may be quite exhaustive and may not be feasible. - Overlapping commonly occurs in few of the characteristics. It may be difficult to place a sample strictly into a subgroup. Common Uses of Stratified Sampling:- 1. Trial of the Pyx: It involves selecting, analyzing and certifying that minted coins conform to the required standards, in United Kingdom. This procedure has been conducted from twelfth century till date, usually once per calendar year. Coins to be tested are selected from the regular production of the Royal Mint. Selection of the coins are done randomly and in a fixed proportion in different groups - example- for every 5,000 bimetallic coins issued, one is selected , whereas for silver ones, one out of every 150 is chosen. The criteria for assessment includes:- diameter, chemical composition and weight for each class of coin. 2. Stratified random sampling can be used, to assess the student’s grade point averages(GPA) across the nation, taking into the account major and minor subjects opted by the students. 3. People that work overtime in profession, taking into account the different types of jobs, males and female subgroups etc. 4. Life expectancy across the world , taking into account regional characteristics, demographic population data including age, sex, ethnicity , lifestyle etc. 5. Political Surveys. In political surveys, diversity of population has to be taken into account. Various minority groups of different races, religion are chosen and number of samples from each group is taken, based on the proportionality to total population. 6. Stratified sampling is used as a method of variance reduction in computational statistics, when Monte Carlo methods are used in estimating population statistics from a known population. 7. Water use estimation across the population in a city or town. 8. Resident travel information in urban cities, for planning of urban transportation
-
Shashikant Adlakha replied to Vishwadeep Khatri's topic in We ask and you answer! The best answer wins!The Pascal's triangle is an imaginary triangle in mathematics, that was discovered way back and used by mathematicians of different countries like India , Iran, China, Germany, Italy and finally highlighted by French mathematician Blaise Pascal, who is encredited with this phenomenon. It is applicable for binomial distributions and contains binomial coefficients, arranged in triangular array. It finds probability of events and combination of events. The sum of numbers in rows in Pascal triangle is given by 2n. Any probability evaluation, with two equally, independent and no predetermined order can be resolved , using Pascal’s triangle. The initial row of Pascal's triangle is conventionally designated as the 0 th row, n=0 at the top. The value of 0 th row is assigned as a non zero value and usually assigned as 1. The entries in each row are numbered from left and both extreme ends of a row are assigned values of 1. Each value entered in next row is the sum of value in the above and to the left with above and to the right. Example : A group of 10 people needs to be picked to create a committee of 4 people. We need to figure out the number of possible different committees of size 4 , that can be created from 10 people. While solving this issue, combination of people is important, not the mentioned order of the people. There will 10C4 possible committees. By scrutinizing, 10th row of Pascal's Triangle and selecting over to the 5th term (As first term is 10C0), it will give us the number of possible different committees. So we can conclude that there will be 210 possible committees of 4 people each, from a group of of 10 people. Applications of Pascal’s Triangle: - Algebra and probability - Graphic designers - Finance - Architect - Mapping

-
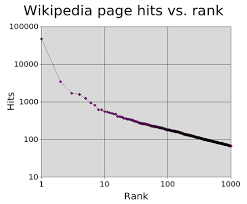
Shashikant Adlakha replied to Vishwadeep Khatri's topic in We ask and you answer! The best answer wins!Zipf’s law as proposed by American linguist George Kingsley Zipf, states that frequency of any word in a language relates inversely with the rank of that word in frequency table. Frequency is the number of time, the word is appearing in the sample or a text . -The most commonly evident word in a corpus suppose has a frequency f -The second most appearing word , will have a frequency around f/2 -The third most appearing word would have frequency nearly f/3 -The fourth most appearing word would have frequency around f/4 Zipf’s law can be applied in many other data and rankings such as: - Poulation ranks of cities in various countries -Corporation size -Income rankings of richest persons -Ranks or number of people watching the same TV channel -Temprature trends over recent years -Facebook likes of favourite teams - Number of citations to papers - Number of hits on web sites - Copies of books sold in the US - Telephone calls received - Magnitude of earthquakes - Diameter of moon craters - Intensity of solar flares - Intensity of wars - Net worth of Americans -Frequency of family names The level of fit between the data and Zipf’s distribution, can be tested by Kolmogorov-Smirnov test and then it be compared with the fits to alternative distributions, like lognormal, exponential distribution. Zipf’s Law is more or less in compliance with one of the most widely acclaimed economical and statistical principles ‘Pareto Principal’. The Zipf distribution is also labelled as the discrete Pareto distribution, as it includes primarily the discrete data and deals with frequency and rankings. The Pareto principle states that 20% of the invested input accounts for 80% of output. 20 % of work-related input yields 80% of the results. Similarly Zipf’s law accounts for the fact that few of the words, only first 20% of words, accounts for 80% frequency of entire corpus. The probability mass function(pmf) of the Zipf distribution is F(x)= C/xs , C- Calculated Constant, x=1, 2, 3-------------------n S- Value of exponent, characterizing the distribution
-
Shashikant Adlakha replied to Vishwadeep Khatri's topic in We ask and you answer! The best answer wins!Overall equipment effectiveness (OEE) is one of the most effective and commonly utilized tool in lean methodology and lean manufacturing. Importance of OEE lies in : 1.Identifying the source of inefficiency 2.Quantifying the degree of inefficiency 3. Labelling the quality of goods produced/service rendered OEE combines three factors namely -1) availability 2) performance 3) quality Ideal OEE score is 100%, meaning production of cent percent defect less products/process, at maximum speed possible, and with no interruptions/breakdown. The output emerging from Ideal OEE is called as planned output Availability: availability accounts for planned and unplanned breakdowns or interruptions. The unplanned fractions may be due to equipment failure, material shortage, manpower crunches, change over time etc. Availability can be calculated in different ways:- Availability= Runtime/Planned production time Where Runtime =Planned production time- breakdowns Gross output= Planned output- loss of output due to availability losses Availability Rate(a)= Gross output /planned output Performance: It takes into account the performance loss because of process operating at submaximal or slow speed and also accounts for small stops in between leading to loss of efficiency and sell optimal production. The probable causes of poor performance can be: - Low quality input material - Old equipments with wear and tear - Small duration stops, may be due to some minor jams or process congestion(Long duration stops are generally classified under availability domain) Net Output= Gross Output-loss of output due to speed loss Performance rate(p) = Net output/Gross output Quality: Quality accounts for any defects/scraps due to some flaw in any of the process. Valuable output= Net Output-loss of output due to scraps/quality issue Quality Rate(q)= Valuable Output/Net Output OEE=a*p*q Six Big Losses: The three types of major losses have been further subdivided to yield 6 types of big losses, that an organization is prone to suffer because of equipment/process related issues. -Availability loss: 1) Unplanned stops 2) Planned stops - Performance loss 1) Slow Cycles 2) Small stops - Quality loss 1) Production Rejects/scraps 2) Startup Rejects/scraps Ways of eliminating/mitigating the six big losses: - Availability losses: 1. Equipment failure: - Regular preventive maintenance of the instrument, with linkage to computerised maintenance system(CMMS) - Tracking the downtime - Investigating the reasons for each shutdown/downtime 2. Setup and adjustments: - Batch production instead of equipment delivering throughout the day, to minimize the retooling adjustments throughout day. - Single minute exchange of die(SMED): switchover/change from one process to another process in production in a single minute or single digit time frame, less than 10 minutes. - Performance losses: 1. Idling/Minor stops: - Prompt signaling and initiation of action - Patterns of performance loss, needs to be analyzed - Process standardisation 2. Speed reduction: - Adequate maintenance of equipment to prevent wear and tear and maintain the speed and efficiency - Continuous improvement by regularly looking for the ways to remove waste, inefficiency and improve operation - Quality losses: 1. Production rejects/process defects: - Direct inspection of the equipments and materials, providing regular maintenance. - If defects become overwhelming and routinely detected, then change of the equipment remains the best economically viable option in long run. 2. Reduced yields/start up rejects/scraps: - Usually predictable ones, sometimes an inherent part of the process and commonly attributed to setups, changeovers and initial warm up of equipments. Can be prevented by: - Reduced initial production- Production of small batches at startups, rather than large batches - Reduced Variation: maintaining uniform equipment settings, standard and uniform material quality in all batches and stringent quality control.
-
Shashikant Adlakha replied to Vishwadeep Khatri's topic in We ask and you answer! The best answer wins!Quantile regression methodology is a method of regression that incorporates relationships between variables, beyond the mean of data and is quite useful in evaluating non linear relationship between variables. Quantile regression is a valuable alternative to linear- ordinary least squares (OLS) regression and other related methods, which are based on the concept that there is some kind of association between independent and dependent variables. Quantile regression (QR) was developed as an alternative to mean based regression and largely used in various fields such as financial and risk management, healthcare, tourism etc.. Quantile regression can be widely used because of suitability in nonnominal , longitudinal and data with heterogenous conditional distributions. QR can tackle outliers much more efficiently compared to mean-based regression. Applications of Quantile regression: 1) Financial Risk Management: There are usually a number of variables , that determine a farm’s equity growth. Mean based regression is not the ideal way to study the interaction of multiple dependent and independent variables. The equity analysis of a farm employs quantile regression method to investigative the heterogenicity of different components of equity. Farms adopt multiple strategies for business growth. Many of the strategies are complementary to each other. The important strategies are: - Asset Management strategy - Financial management strategies - Minimising the borrowing cost or interest paid, through refinancing - Cost reduction strategies -By prudent use of quantile regression, important insight is obtained on ways to use different strategies to enhance farm net worth/equity and building of ideal portfolio of investments. 2) Measure racial and ethnic differences across the distribution of health care expenditures: Identification of racial or ethnic differences in health care expenditures is carried out using multivariate linear regression or quantile regression. Racial or ethnic differences in health care expenditures are computed, using a multivariate regression equation of health care spendings, which are conditional on a number of covariates. In order to analyse the difference at the upper and lower ends of the distribution, we use quantile regression models. Log of total health expenditure is used to use the nonlinear data and investigate the multiplicative effects of different predictor variables, in case of heavy spenders on healthcare. 3. QR finds lots of applications in health and behavior related sciences. Some of the examples are- evaluation of effect of physical activity, dietary intake, on different quantile level of variables such as- Body mass index(BMI), waste circumference, socioeconomic status, , various health related scores and biomarker data. QR can also be used to evaluate and improve various behavioral interventions and sustaining the behavioral change, by separately implementing measures in two extreme ends of population distribution. Many similar applications are there, including various determinants of weight in obese versus only slightly overweight, various dietary predictors of HbA1c levels among non-diabetics and Type I or II diabetics, and those with high levels of glucose levels
-
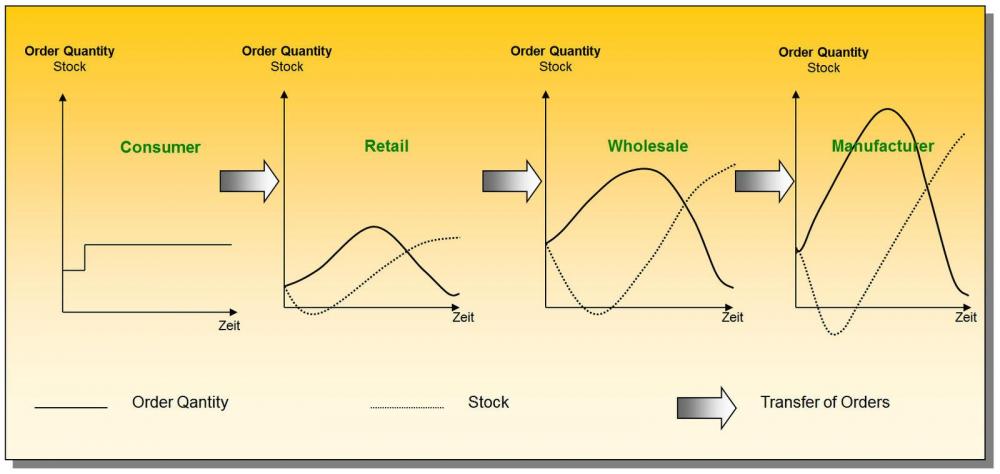
Shashikant Adlakha replied to Vishwadeep Khatri's topic in We ask and you answer! The best answer wins!Bullwhip effect . The bullwhip effect , aka Forester effect, is a phenomenon of supply chain inefficiency , and increasing accumulation of inventory, owing to uneven changes in customer demand. There is increasing swings in inventory in response to shifts in customer demand as one moves further up the supply chain. The bullwhip effect is so named, because of the increase in amplitude of whip down the length. As we move farer from the original signal, the greater is the wave distortion. Similarly, the prediction accuracy decreases, as we move along upstream of the supply chain. Bull whip effect can lead to not only increased safety stock but can also lead to inefficient production excess and inventory. Also there are chances of getting stock out, leading to poor customer compliance and drop in sales value. Though there are a large number of causes postulated for bullwhip effect, the two major types are human related causes and operational causes. They can be further delineated into five major types. A. Delivery Lead Time: As the delivery lead time increases, the tendency to order large quantity increases, leading to pile up of inventory. B. Order Batching: many of the firms have a tendency to place the orders in large batches that practically leads to large accumulation of inventory. C. Price and Sales Demand: frequent changes in the price of the product -frequent discounts lead to sudden surge in the demand due to extensive buying by the customer and vice versa when the price again increases, leading to sudden drop in the demand and this leads to uneven demand, chaotic supply chain and accentuation of bull whip effect. Relying on past demand information for future demand prediction can further aggravate the issue. D. Shortage Gaming: Many a times there is a presumption that there is shortage of material, that leads to large ordering to multiple manufacturers and suppliers and followed by canceling of the order, when one of the supplier delivers the material. This creates marked accumulation of material at the supplier or the manufacturer end. E. Information Myopia: Classically in the supply chain, the source of information to any firm is limited to a firm that is immediately downstream and there is no source of information or no access to actual customer demand. This particular lack of coordination across the supply chain leads to inventory buildup and marked exaggeration of bullwhip effect. Mitigating the Bull whip effect: The main principles of preventing or combating the bullwhip effects are: 1. Leadtime reduction: Reduction of order lead time and information lead time. Cross docking (little or no storage of material between unloading of material at one end and further loading of material at the other end) and electronic data interchange can significantly reduce both lead times. Safety stock level across supply chain and reorder points are both lead time dependent. 2. Reducing variability: Everyday low pricing(EDLP), low price over a long horizon, without much variation, without any quality compromise. 3. Reducing uncertainty: Centralising the demand information. Visiblity of customer demand and forecasted retailer’s demand being visible to all partners of supply chain, including the manufacturer. 4. Strategy partnering and buying : Information sharing in strategic partnering reduces variation in the system. This requires VMI-Vendor Managed inventory . The manufacturer maintains the inventory at the point of use there by reducing any variation in the system and preventing excessive production of the material. Strategic buying policies of the buyer and manufacturer reduce much of the variation caused due to frequent quantity discounts offered by the manufacturer. 5. Advanced information technology: Intranet, the internal internet in the companies replaces the sequential information flow with dynamic system and reduces manufacturing lead time and markedly reduces bull whip effect. Lean Production Principles and reduction in bull whip effect: Synchronisation Principle: Synchronous supply means to supply the product in accordance with the requirements of the buyers. This concept is also known as Justin time and the goal is to produce and deliver the goods just in time, thereby reducing the inventories across the supply chain. Pull Principle: Pull logistics is a demand based system, in which parts are only being manufactured, transported across the chain and delivered to the customer when any external or internal customer signals the need. The best example of pull system is Kannaban, which uses a statistical based approach to control material flow- both internal (upstream) and external(downstream). Heijunka: Levelled production:- Toyota’s mixed production system is a brilliant example of schedule or levelled production. It does not schedule the production according to the actual customer demand/orders which usually swings up and down, but takes the total volume of orders in a period and levels/averages them out, so the same amount and product mix are being made in each scheduling period. So it reduces unevenness/Mura, thereby ultimately reducing waste/Muda. Heijunka Box- Levelling the volume and products type TAKT Time: It is total available time, divided by number of customers demanding parts. Customer demand and the obtained TAKT time, are important drivers for both production and logistics across the supply chain.
-
Shashikant Adlakha replied to Vishwadeep Khatri's topic in We ask and you answer! The best answer wins!Fast-tracking and crashing are important techniques of project management to shorten/compress the project schedule. These techniques, though not commonly used ones, but have important applications in project management. -There may be various business reasons to do them, when the project is already running late due to various unexpected conditions like crunch of manpower and other resources . They may be also mooted in the event of internal and external pressure from various stakeholders of the organization to expedite the project and finish before deadline. FAST TRACKING -Fast tracking is a technique that is usually the first line of action, when project compression is warranted. It encompasses doing of multiple activities in parallel, even though there may be some degree of finish to start dependencies of both the activities. -One of the best examples is -starting to work on product development, when product design is not complete, but a part of product design is accomplished. Whereas earlier plan was to initiate product development at the end of complete product design. Other relevant examples are: -Start laying foundation of construction, even if architectural drawings/designs are not completely done. - Constructing a different portion of highway simultaneously with another initiated portion - We need to analyze the dependencies of activities, if they are really mandatory or just presumed. If it is only discretionary, then we can manipulate the schedule of activities, so that overall time gets shortened. For an example – Activity 1 and Activity 2 have essential finish-to-start dependencies, with length of each activity being 5 days and the total duration being ten days. Let us assume that project manager gets a deadline from project sponsor to finish the project in 8 days. If we start the second activity by the end of 3rd day or beginning of 4 th day, we will be able to cut short 2 days and finish both the activities in 8 days The biggest drawbacks of fast tracking are: - Cannot be done, when there is complete interdependency or finish to start relationships of processes . - Leads to rework, project extension and project failure many a times. -A general rule that applies in fast tracking is that ,the second activity can be started when the first activity is at least 2/3rd or around 66% complete. This usually fits well and is commonly practiced. CRASHING Crashing is a technique, which entails use of additional resources, e.g.- overtime, manpower, additional material and equipment. The motto is to finish the activities or reach the project deadline at earliest, well ahead of the anticipated or projected deadline. -Crashing works very well in certain scenarios like construction industry- more workers finish the task earlier compared to a smaller number of workers. The best example of crashing was seen in Year 2000-Y2K- projects, when many of the companies accelerated the project to meet the deadline of completion of projects by the end of 1999. -The biggest issue with crashing is that, it increases financial burden. So the cost vs time tradeoffs have to be carefully decided, when deciding for crashing. - Also crashing is usually never the first choice, it is usually carried out, when fast tracking does not yield the desired result. -Crashing also can lead to waste of resources, especially with more of manpower leading to more confusion and errors. For example in complex neurosurgeries, which goes on for many hours and If we try to add more surgeons in team to shorten surgery time, it may rather lead to more complications due to difference in opinion, difference in skills of surgeons and lack of coordination. -Both Fast track and crashing needs to be implemented only in critical path activities. If we employ them on non-critical path activities, there will be no shortening of duration.

-
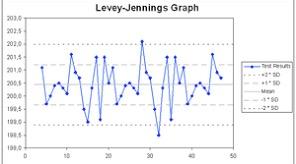
Shashikant Adlakha replied to Vishwadeep Khatri's topic in We ask and you answer! The best answer wins!Quality means ensuring that the product manufactured is defect free or the service rendered to the customer is supreme in nature with no flaws. Quality assurance (QA) is a way of averting defects and mistake in manufactured goods and products and service availability to the customer. QA has its applications in various sectors like- software, insurance, banking, medicine, transportation, manufacturing industries etc. QA is a part of quality management of manufacturing and service industry that boosts confidence on manufacturers, service providers and end customers, that all quality requirements are being met with and product/service rendered is defect free. The two most commonly used terms used in quality management systems are: "quality assurance" and "quality control" and are often mistaken for each other and used interchangeably many a times. The term quality assurance is used for example- as an implementation of accreditation guidelines of medical hospitals and laboratories by various external assessors such as JCI, NABH, CAP, NABL etc. Basically these guidelines need to be followed by the medical institutes, in order to ensure the provision of quality health services to the patients. Quality control(QC) on the other hand is a measure of fifth phase of Six sigma model- DMAIC-Define, measure, analyze, improve, control. Basically DMAIC is a data driven model to ensure quality and improvement. Control phase or QC is executed by various control charts and other statistical tools. Quality assurance encompasses all the standardized administrative and procedural activities that lead to fulfillment of different quality systems leading to error free product and service. Quality control, in contrast, deals with more of process output in terms of perfect product and / or service. Quality assurance banks on two main principles- "Fit for purpose" (Product/service is fit for intended purpose) and "right first time"( mistake free product/service). The two principles are used before developing (engineering) a novel technical product: Engineering is to make the product work at least once, while the quality assurance needs to make the product work all the time. The various approaches of QA are: Failure testing /Stress Testing of a consumer product: Statistical control of the data of the product: Total quality management: Maintaining the quality of product and service in compliance with processes of Quality assurance. Models and standards: Various international standards such as ISO 9000, ISO 17025 are in place for determining the international standards and requirements to carry out various tests and their calibrations. These requirements outline the guidelines for accreditation of laboratories. There are several tools devised by WHO for accreditation of public health laboratories. Examples of QA in various industries: Medical industry: QA is an integral part to identify the standards of various medical equipments and services. QA is of utmost importance in development of new devices, new pharmaceutical products and new diagnostic tests launching. For example- external agencies like Atomic energy regulatory board (AERB) govern the standards for diagnostic radiology Aerospace industry: Here Product assurance(PA) is used many a times, rather than quality assurance. The PA/QA wing works independently for development of defect free products, which are vital for safety to human life and free of any hazards to the environment. Software development: QA in software industry refers to various software engineering processes and their monitoring and used to ensure quality. Various models such as Capability maturity model integration (CMMI), ISO 9000 are used for these. Various quality management system used for QA are: Six Sigma, Measurement system analysis, Quality function deployment, Failure mode and effect analysis, Advanced product quality planning(APQP), CMMI etc. Quality control (QC) is a part of Quality management system (QMS), focused on achieving the quality specifications of the product/service. Various methods have been proposed to achieve the desirable QC in products or services. Statistical Quality Control: The application of statistical methods like control charts and acceptance sampling to achieve quality control. Total Quality Control: Connotes involvement of various departments in addition to the product designing or the the service department. This includes- marketing, accounting, design, finance, HR, Sales etc. Statistical Process Control: Includes use of control charts to monitor a process and feedback given to the unit, responsible for the process. Lean Six Sigma: Statistical six sigma along with lean tool applications to reduce variation, eliminate waste and provide value to the system and organization. Quality control is achieved by ensuring markedly reduced or zero defects. Quality control requires training for the staff and personals, involved in the process for creating a benchmark for product/ service quality and reduce statistically significant variation. Quality control of a product/service requires a standard control to be developed and then comparing the control with current product/process. Understanding Quality Control Quality control involves active testing of randomly picked units and evaluating if they pass the desired quality criteria which are specified. The purpose of the testing is to determine any needs for corrective actions in the manufacturing process. Stringent quality control ensures the development of products and services that add value and are customer compliant. The quality control used in a real business world depends on the type of product or industry. For example, in consumer goods like food and drug, quality control implication lies in ensuring that product ingestion does not lead to any adverse biological reaction in consumers. So QC implies doing chemical and microbiological testing of samples picked randomly from production line, to ensure that product is in compliance with its contents, as stated in the visible package label and product is sterile with no growth of disease-causing microorganisms. In medical laboratories, QC means inter laboratory testing of same sample, comparison of test reports of a laboratory with a standard accredited lab and to ensure that there is no significant statistical variation of test results. The Techniques of Quality Control: There are various methods of checking performance of quality control. One of the most common ways is a graphic chart to check if the product meets intended attributes/ specifications. When the chart specifically analyses a single attribute of the product it is called a univariate chart. When a chart measures multiple product attributes, it is called a multivariate chart. A very common form of a quality control chart is the X-Bar Chart, used for studying randomly picked up products, where the Y-axis on the chart tracks the degree of variance in the tested attribute and X axis tracks sample tested. The pattern of variance observed, helps in determining the nature of defects, systemic vs Random. In medical laboratories use of Levey-Jennings chart(LJ Chart) is commonly employed to check the accuracy of the QC value run on particular day and to identify the outliers if any and plotting a curve for the QC values obtained throughout the month. The mean and standard deviations are obtained after running the control daily. A particular day run of QC is rejected, based on 12s rule(rejection, if control value exceeds a 2SD control limit) or 1 3S rule(rejection, if control value exceeds a 3SD control limit), depending on the guidelines followed by laboratory according to accreditation norms. The Taguchi Method of quality control emphasizes on research and development, product design and development in reduction of defects in products. It says that engineering and designing of product is much more important than standard manufacturing process of the product. Inspection by Quality Control Inspectors Quality control inspectors try to ensure a defect free product/ service to the consumers. They try to evaluate the products/services by practical testing. They can fix the issue themselves or inform the process supervisors for remedial actions and if still not corrected, then reject the product/service.
-
Shashikant Adlakha replied to Vishwadeep Khatri's topic in We ask and you answer! The best answer wins!The majority of profit and non-profit business organizations and individual businesses suffer a huge loss of revenue owing to fraud inside the organizations. Though all scales of business are vulnerable, the startups and small scale businesses are much more susceptible. The risk of fraud is increasing significantly, due to significant technology-related changes and advancement. Recent reports suggest organizations lose around 5% or more in revenues annually due to fraudulent activities. Types of business frauds: Types of fraud can be of three general types: misappropriation of assets, corruption, and irregularities in financial statements. Asset misappropriation: This makes the majority of financial frauds, though they coast least among all types. In these types the employees steal organizational resources, for example-Stealing of cash, making false statements regarding financial reimbursements and taking non-cash or intangible assets of the organization. Financial statement fraud comprised the least common way but by the way, the costliest one, causing a major loss to the organization. The best examples are a statement of false revenues, inconspicuous liabilities, spuriously raised assets. Corruption ranks in between the other two types. In this type of fraud, employees generally use their clout to influence purchase transactions. Bribery, extortions, and conflict of interest are other ways to enact this kind of fraud. There are multiple ways postulated for the prevention of different kinds of fraud through a multidisciplinary approach. These are: 1. Knowing the employees well: It is very important to do the background check of the employees before hiring them. Even the employees, who are working for a long time in the organization, need to be monitored and any change in their behavioral traits to be noticed. Many of the times, employees who are rendered as very trustful are the ones, who commit this crime. So no one should be spared of strict monitoring. It is also very important to reward hard-working individuals periodically for the prevention of fraudulence. 2. Make Employees Aware/ Reporting System Awareness should be spread amongst all the employees, regarding the fraud risk policies. They should also be made aware that management is keeping a strict vigil on them. The anonymous reporting system should be set in so that employees, vendors and even customers can report fraud without any hesitation and fear. 3. Implement Internal Controls: Stringent Internal controls system should be in place to make the organization be free of fraud. Segregation of duties and cross-checking of duties by different employees should be facilitated. All manual works should be evaluated checked by an automated check system periodically. The stock of all inventories should be strictly maintained and also be stored in a digital platform. 4. Monitor Vacation Balances: Pre and post-vacation balances of all the employees, especially in critical domains should be compared. It is also advisable to keep a rotational policy as far as possible in different domains. If some employee is not taking a leave for a longer period of time, it may be also a warning sign and the employee needs to be evaluated. 5. Experts Hiring : Certified Fraud Examiners (CFE), certified accountants need to be engaged for periodic internal audits of organization and financial forensic analysis of fraud. 6. Corporate culture: Professionals and a healthy work environment are imperative to prevent employee fraud and theft. There should be a well-defined organization structure, documented policies and standard operating procedures of all the practices. There should be an open communication of employees with management. Every employee should be accountable for their actions, regardless of position. Fraud Detection: A well-documented fraud detection plan should be in place to detect the fraud immediately in addition to the implementation of prevention strategies. Association of Certified Fraud Examiners (ACFE) states that the control and detection should be clearly visible and well communicated to the employees so that they become aware that management is actively watching and they should be versed that there is zero-tolerance for frauds, so that they would refrain from committing frauds. These plans usually link external information with internal data.
-
Shashikant Adlakha replied to Vishwadeep Khatri's topic in We ask and you answer! The best answer wins!The Toyota production system(TPS) is one of the most followed and revered way of continuous improvement. There are 14 principals of TPS , which are clustered into four sections : Long-Term Philosophy Implement the right process to get the right results Value addition to the process/organization Root cause solving to promote organizational learning The two most important points to be stressed upon are: a process of continuous improvement and paying equal importance to the people/employees. The continuous improvement principle stresses on- long term vision, solving problems through root cause analysis and learning and innovation. Building a strong culture of mutual respect and teamwork is the step required for giving importance to the workers. Toyota production system strongly encourages that quality should be given topmost priority(Jidoka) and any issue necessitates to stop the production instantly, fix the issue and then go ahead, rather than continuing with the production and resolving the issue later on. All the employees of TPS are empowered to halt the production process, as the quality issue emanates. Autonomation is the method to effect the principle of Jidoka in TPS. Automation signifies intelligent automation, in which the machine automatically stops in case of any quality issue and worker stops the production line. It encompasses the following steps: 1. Diagnose the abnormality 2. Stop the production line completely 3. Resolve 4. Root cause analysis and corrective measures implemented The initial example of this at Toyota was the loom of Sakichi Toyoda that got activated automatically and immediately put the loom to rest if any vertical or lateral thread came out. Andon is a similar kind of manufacturing system to send signals to management and other co-workers of a quality issue. The signaling can be done either manually or automatically by the machine itself. This system may have a way of stopping, such as some kind of displays, text, audio alarms, etc. Stopping the line is the easiest thing to do for any kind of defect, but has definitely financial and other constraints like technical piling up of the work , which can block the organization to move forward. Failing to resolve issues as they occur, only results in an insurmountable pile of technical debt, which seriously retards organisational growth. Pros and cons. of Stop the line concept: Stop the line concept is very essential for the quality purpose, as the continued work done by some team members, can interfere in efforts in the resolution of the issue since work done by other team members and also create accumulated/ downstream work for the workers, engaged in fixation issue. But there is a significant risk of downstream issues if the stop the line concept is implemented, like lots of work is queued while waiting for the resolution by team members. There is a significant financial cost involved with that. We have to check and make sure that the cost of stopping the production/work and resultant under construction should be minimized and not overweight the benefits gained from this phenomenon. Ways To benefit from Stop the line Concept: Continuous Improvement: After the resolution of the issue, all the team members and management to be communicated immediately. Retrospective analysis of the issue, including the 5 why analysis to be carried out. Possible improvement measures in product and process development, timeliness of these actions to be carried out. Judicious use of data and metrics:- Stop the line incidents to be evaluated, recorded and in-depth analysis done. Most important parameters being the timelines of these events, the various measures are taken to resolve the issue, the outcome of each measure evaluated separately, a combination of measures and their yields, the time taken to resolve the issues, number of times getting stuck up during resolution and what are the important application domains of these issues. These data need to be evaluated periodically by the quality department, product development department to see, where are the scopes for improvement, so that the number of stops the line events can be minimized to the maximum. But this should not lead to discouraging the workers to stop the line when it is quite essential.
-
Shashikant Adlakha replied to Vishwadeep Khatri's topic in We ask and you answer! The best answer wins!Groupthink is defined as a phenomenon involving a bunch/group of people in pursuit of trying to resolve an issue and reaching to a harmonious, mutually agreeable situation, actually leads to a wrong decision, without much analysis of the deleterious consequences, it bears. Group thinkers feel immense pressure to reach a consensus and are often not able to speak up their minds and raise skepticism, inspite of sighted negative aspects of the decision. There is often a tendency to go along the flow or the conventional norms. Certain factors play a big role in the outcome of the group thinking. - High cohesiveness of the group with lack of diversity. - Irrational structure of the groups with lack of an impartial leader. - Highly stressful situations, recent setback, an extreme degree of fear and anxiety. There are various case studies and disasters reported due to groupthinking outcome. - Groupthink is accounted for the paradigm shift in US policy, that lead to the invasion of Iraq by USA. - The infamous attack of Japanese on Pearl Harbor in 1941. -The fall of Marks & Spencer and British Airways in London Stock Exchange in the 1990's. -The failure of media houses to read the exact mood of the nation in 2016 US Presidential election. There are various methods, suggested to mitigate the phenomenon of group thinking in decision making groups. These are as follows:-- -Creating diverse groups with even gender diversity. - Independent senior level thinkers, who just do not nod their head to appease the management. - Leaders need to be unbiased without any prejudice towards any group members. - Freedom of speech and raising doubts about the agreed idea, to be facilitated. - Leaders should abstain from opining, while asking rest of the group members to opine. -Leaders should deliberately be away from many of the meetings, to let the group members freely discuss and state their free views and concerns about the issue. - Several independent groups should be set up, especially on the critical issues, and each group should be blinded on other group's discussion and decision outcomes, to prevent bias. -All possible solutions and alternative of a particular problem should be taken into account, their merits and demerits discussed. -Technical subject experts are invited in group meetings to lay their expert opinions. -At least one of the group members should behave like a Devil's Advocate. This person should be a different person, designated for each meeting. The Important role to be played by Devil’s advocate is to provide in-depth analysis, show skepticism towards a mutually agreed decision with technical facts and also provide a logical and better alternative.
-
Shashikant Adlakha replied to Vishwadeep Khatri's topic in We ask and you answer! The best answer wins!Nash equilibrium is a classical example of game theory named after a famous mathematician John Nash and has wide application in the real world micro and macroeconomics and strategic decision making. It implies that favorable outcome of a game is where, each player does not deviate from the intended strategic decision, even after knowing other player's moves/strategic decisions. There is no change in the decision of the player, as there is no reward associated with it and the original strategic decision is the best one. There may be a single/multiple/no Nash equilibrium at all in a game/scenario. It is one of the best and widely applicable concept of gaming theory, which helps to substantiate the decision-making ability by mathematical calculations and logical application. The Nash equilibrium has applications in different streams like social, economical and strategical. Example of Nash equilibrium In the real world: Imagine there are two strategic decisions/ moves- A, B for two biggest players of soft drinks-Pepsi and Cola (We are all aware of the famous Pepsi and Cola War). In this example, both Pepsi and Cola can choose strategy A, to receive $5 bn, or strategy B, to lose $1 bn. It is explicit and logical that both of them will go for move A and get the reward. Now per se, Pepsi becomes aware of the intention of Cola and Cola becomes aware of Pepsi's move, It is highly unlikely that any of the two big giants will change their strategy and loose hefty money. This choice represents a Nash equilibrium.
-
Shashikant Adlakha replied to Vishwadeep Khatri's topic in We ask and you answer! The best answer wins!Mean (Average) Mean is the best measure of central tendency in normally distributed data without significant outliers. As large number of distributions are symmetrical, mean represents the true estimate of distribution. Example: Mean height, weight etc. Mode Mode is the most repeated value in a set of data. Like, people become more inclined to things, that are undertaken by majority of the people. Median The median is the mid value that divides a set of values into top and bottom 50%. The income distribution in a country is asymmetrical, with 20% of population, accounting for major proportion of wealth in the country and remaining 80% of the people have lower income, in the way that wealth of top 20% is equal to bottom 80%. In this case, mean income will give a false and biased picture, due to distribution peaks in two different regions. Median will be the best representer of the income of the people in the country. In India, many educational institutes place their advertisements to attract students by stating the ''placement packages'' of their passing students either due to on campus selection attract students using “placement packages”. In this example, average placement package, which is commonly quoted, is a wrong way of assessing the students. Rather, median serves as the best measure, as the salary range is quite wide, for example for those selected for India location -20 students(salary up to 3 million INR) and those for USA location-5 students (Salary in range of 8 to 10 million INR after conversion of USD to INR) Median also finds use in measurement of commonly measured health indices such as blood pressure. If we measure the blood pressure of 5000 persons in a community health survey and tabulate the systolic and diastolic pressures separately, mean will give an erroneous impression, as 10-15%. of the patients may have very high systolic and diastolic blood pressures, much above the normal reference range( say, Systolic> 200mm of Hg and Diastolic> 140mm of Hg , which is not represented by majority) . Here, median will be the best measure for blood pressure levels of the community people and can be used to initiate health intervention for the community.
-
Shashikant Adlakha replied to Vishwadeep Khatri's topic in We ask and you answer! The best answer wins!Gage R&R study is basically used for measuring accuracy in measurement and precision(repeatibilty and reproducibility). Resolution is predefined, preset at manufacturing level. It is the ability of instrument to detect any deviation in measurement from the reference value. Instrument/process with high resolution is desired. Accuracy is determined by bias and linearity. Bias is the difference in measurement from the true value. Linearity is the difference between extreme values of bias, that affect the measurement system. Precision is measured in terms of repeatability and reproducibility. Repeatibility is the variation in measurement under same condition by same operator in the same instrument. Reproducibility is the variation in measurement, due to analysis of same parameter performed by different operator in same instrument. Long term variation in measurement is due to repeatability, reproducibility and part to part/product variation. Stability is the indicator of long term performance of the system in terms of accuracy and precision. Thus the order of measurement in sequential order will be resolution-bias-linearity-repeatibilty-reproducibilty-Stability.
-
Shashikant Adlakha replied to Vishwadeep Khatri's topic in We ask and you answer! The best answer wins!Historically this phenomenon was proposed in In 1985 to describe the 'stage changes' of cancer patients by changing the criteria of stage-specific prognosis, even though there was no change in outcome of individual patients. Will Roger phenomenon finds much application in medical field. In oncology, sensitive tools allowed detection of cancer metastases much earlier, leading to categorization of more number of patients into more severe metastatic disease stage . Such a radical change in staging of the patient 's stage resulted in an improved prognosis of patients and higher 5 year survival in both the less and the more severe disease stages. In terms of business and commercial aspect also it may be used in various aspects to improve the process efficiency in terms of running average. The best examples are: - In industry to increase the productivity of two different shifts, morning and evening, the workers with moderate efficacy, lying in between the mean of the efficacy of two shifts may be shifted from one shift to another, thus both the batches have better yield. - Reallocation of budget and resources from one to another potential project in a company, may result in better Return of Investent(ROI) for both the projects, by reducing the investment of the project with stronger expected output/yield. Whereas the weaker project, gets more funding and resources and get benefited tremendously by yielding much higher gain, though at the cost of mild to moderate increased investment.
-
Shashikant Adlakha replied to Vishwadeep Khatri's topic in We ask and you answer! The best answer wins!Investment is aimed at earning decent returns. And there are many ways to measure the performance of your investment. There are different indices to evaluate the appropriateness of the investment, each having its own merit and demerit. Return on Investment (ROI) ROI is probably one of the most commonly used investment measure. ROI is an absolute return ratio compared to the investment cost. ROI is calculated by dividing the investment return or net gain by the investment cost. ROI though is relatively a straightforward simple calculation, but has limitations. The most important limiting factor is that it gives absolute return, rather than implying periodic return. Net Present Value (NPV) Net Present Value is usually a tool used for capital budgeting to determine the profitability of a project. It compares the present value of cash outflows with the present value of cash flows. A positive NPV indicates the project will be value adding and worth doing and a negative NPV indicates a net loss. To calculate NPV you need to know the total investment cost (C0), the total cash inflows during the project (Ct), a discount rate (r) (this is usually the cost of capital) and the duration of the project (t). The formula is as follows: NPV=Cash flow/(1+i)t−initial investment, where:i=Required return or discount rate; t=Number of time periods Even though NPV is quite a valuable tool to evaluate an investment decision, it entails lots of assumptions and estimations, which lead to potential errors. Internal Rate of Return (IRR) The Internal Rate of Return (IRR) is also one of the most important investment decision tool, in which the percentage rate of return is calculated for each period invested. It is one of the the most important tool for deciding the best investment option. The investment with higher IRR will be a more attractive option. It is essentially a discount that makes the NPV equal to zero. IRR=R1+(NPV1×(R2−R1)/(NPV1−NPV2); where:R1,R2=randomly selected discount ratesNPV1=higher net present valueNPV2=lower net present value. IRR can not be used as an accurate measure to compare in investment projects of different timeframe. Summing up Investment decisions are profit based. Various Investment metrics can help in analyzing the past performance of an investment and compare different options. It is prudent that these return metrics should always be compared against the risk associated with the investments to determine whether the returns overvalue the risks.
-
Shashikant Adlakha replied to Vishwadeep Khatri's topic in We ask and you answer! The best answer wins!The fourth industrial revolution concept emerged from a highly sophasticated computerized manufacturing project of German government and is accounted due to digital and technological advancements, that are pathbreaking innovations. The four main components that are hallmark of fourth industrial revolution are: Internet of things(IOT) Cloud Computing Cognitive computing Artificial intelligence. The smart factory has : Smart manufacturing system, smart factory and fully equipped to take decisions based on visual sensing. The business models are completely digital, catering to the high and changing demands of customers. The machines can sense the stock, start and cease the production automatically. Machines can also sense the breakdown and repair themselves automatically. Truly industry 4.0 has been a big revolution and many industries are turning more productive and finding more applications.

