Shashikant Adlakha
Members
-
Joined
-
Last visited
Everything posted by Shashikant Adlakha
-
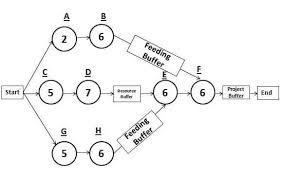
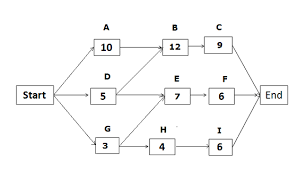
Shashikant Adlakha replied to Vishwadeep Khatri's topic in We ask and you answer! The best answer wins!Critical path and Critical chain method: Both Critical Path and Critical chain methods are types of schedule network diagramming techniques used in developing the project schedule. Critical path is the longest path of schedule network and the duration of critical path is the project duration. Floats are calculated, based on difference between critical and non critical pathway. Free float can be defined as the amount of time an activity can be delayed, without any delay in the successor activity. Total float can be defined as amount of delay in the activity that can be done, without affecting the overall project duration. Floats in all critical path activities are zero. Critical chain is modification of critical pathway with resource optimization. Based on resource availability schedule is prepared. Here buffers are used instead of float. Buffers account for contingency. Buffer is not zero in critical chain pathway. There is no early and late start or early and late finish. There can be only one start and one finish. The Project Buffer is the total buffer at the end of the project. Any delayed activity can consume this buffer. The Feeding Buffer is the buffer added to non critical chain , so that these non critical chain, if delayed, can use this buffer. The Resource Buffer is a resource kept as buffer along critical chain, so that continuity of the work is ensured. Differences Between Critical Path and Critical Chain Method Resources The critical path method does not assume any resource constraint and assumes that it is freely available. The critical chain method, on the contrary assumes resource constraint and builds a realistic schedule based on availability. Critical chain based method schedule may be of longer duration, but is more realistic. Float/Buffer In the critical path method, float can not be utilized before the early start of succeeding activity. While in case of critical chain, if preceding activity gets finished early, succeeding activity can be started earlier and time saved will be added to project buffer. Misuse of Float In the critical path method, team members often do not start an activity, until they utilize the float of the activity completely, till late start. Where as in critical chain, each activity has a realistic schedule and time gained is placed at the end of project as project buffer. Project progress: Floats can not be used to assess project progress, where as buffers can be used to analyze project progress. Critical path method: Critical Chain method: Correlation of Critical chain with lean and theory of constraints: Lean management aims at value creation over entire processes of organization, where as critical chain and theory of constraints are centered on managing time duration and uncertainties of the project. The uncertainties of durations and project completion can be contributed to inadequate management processes, which can be sorted by lean management practices. Lean practice implementation has greater effect on correcting processes unevenness, eliminating wastes and have more impact on whole organization, whereas critical chain and theory of constraint methods are efficacious in task completion on time and project monitoring, by optimizing the resource constraint. Images Sources: Critical Path: www.blog.pmsprout.com Critical Chain: www.blog.pmsprout.com
-
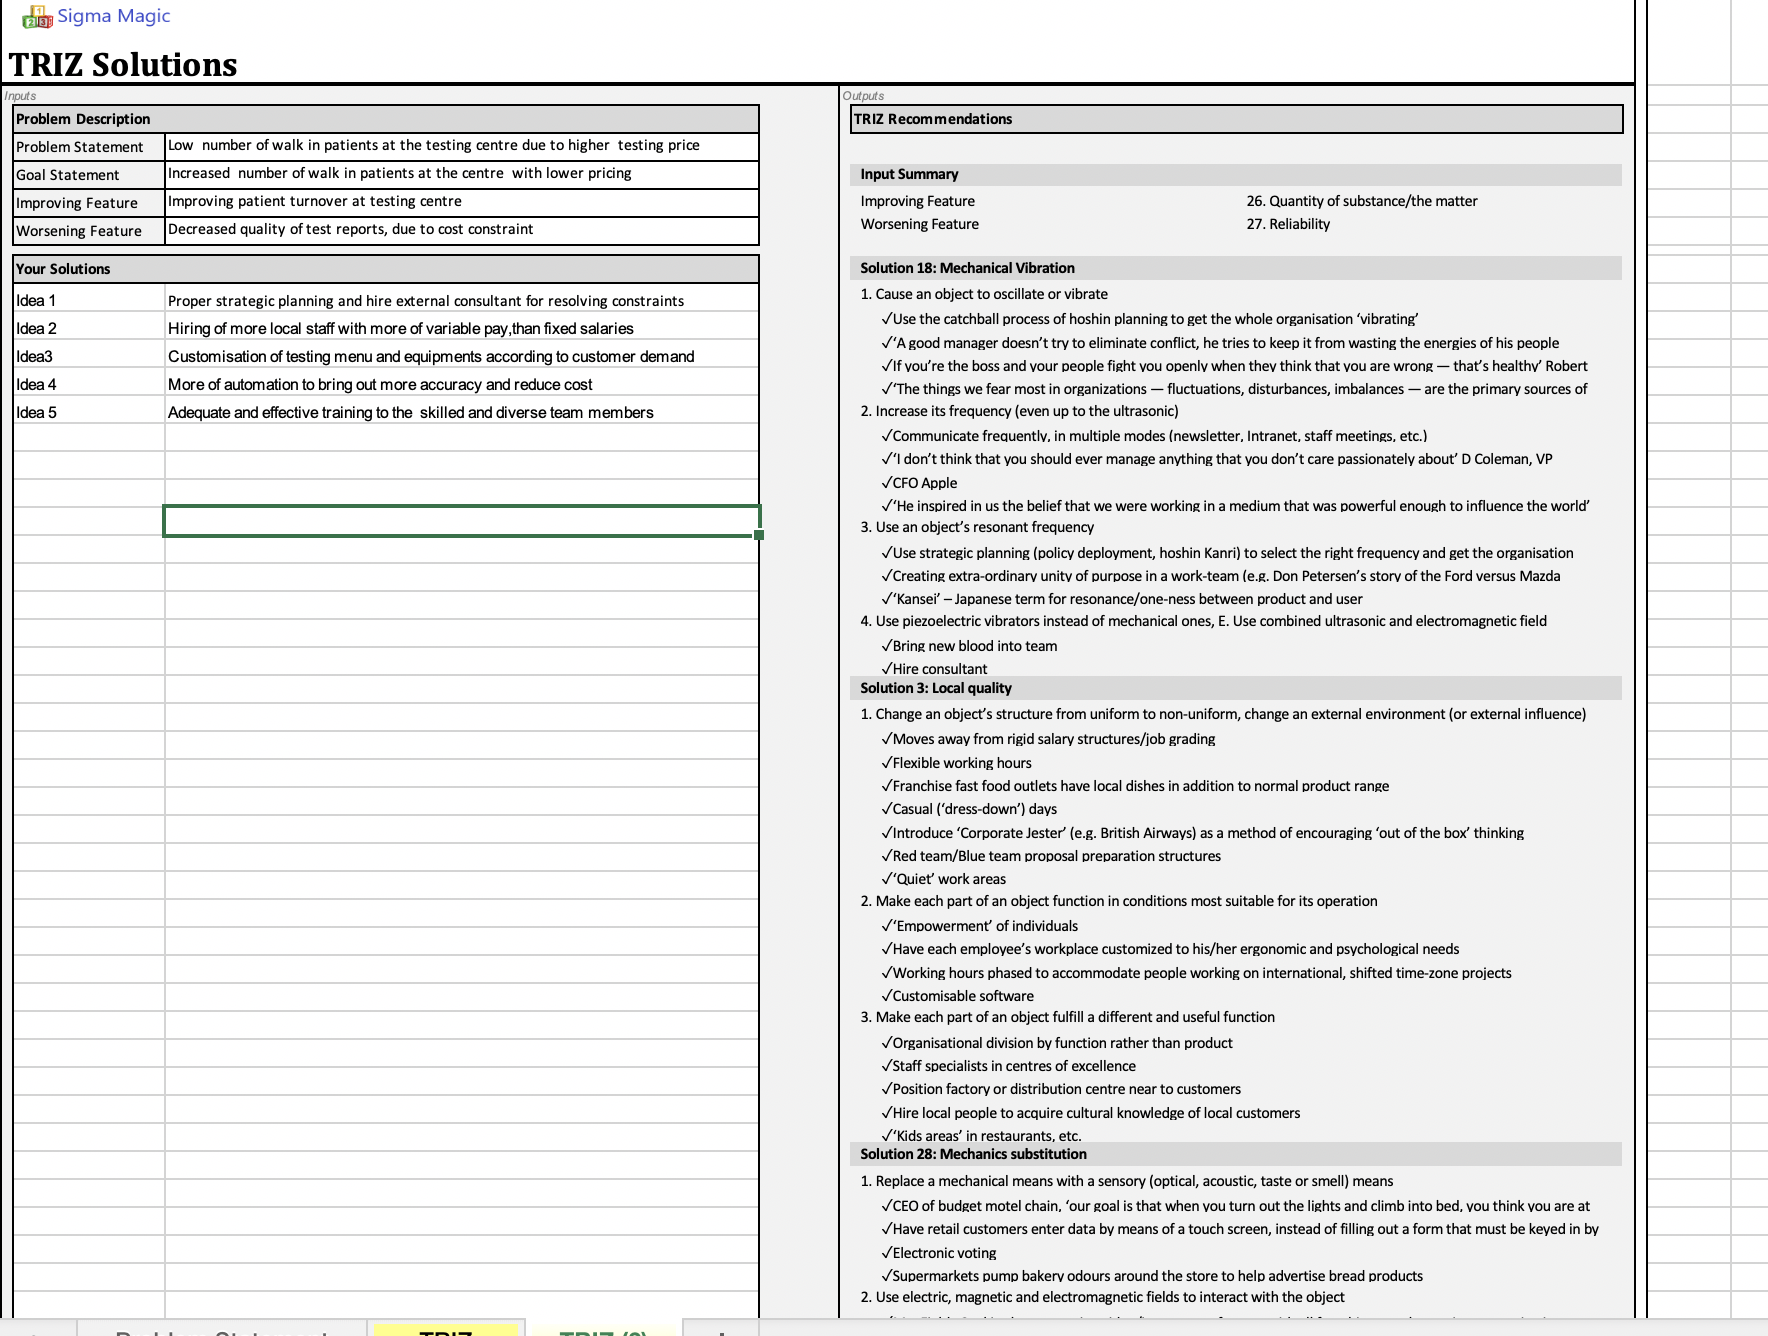
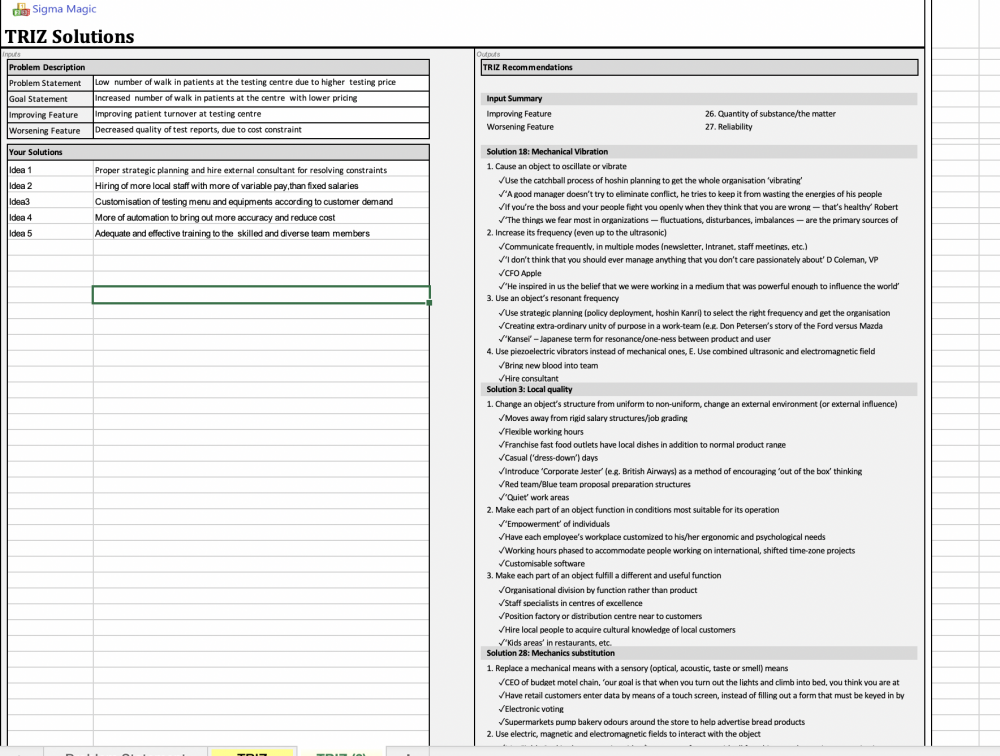
Shashikant Adlakha replied to Vishwadeep Khatri's topic in We ask and you answer! The best answer wins!TRIZ is - theory of Inventive problem solving, postulated by a Soviet engineer Altshuller in 1946. After studying a large number of patents, Altshuller and his colleagues postulated that the inventive principles were present in most of the successful cases. After analysis, they found that when we try to resolve one issue, another issue gets complicated. So an innovative solution is required to overcome and minimize trade-off between contradictory elements. e.g- We want to have hot beverages like tea and coffee, but at the same time we don’t want to burn our oral cavity. - We want a laptop with powerful and fast processor, but at the same time, we don’t want it to be complicated to use or to be much costlier. TRIZ makes use of 40 common principles that have been used in different patents and different areas to find a inventive solution to resolve our present problem. 4 basic principles are generally chosen to look at -supersystems, subsystems, separation of time and space to solve problems. So the primary findings of TRIZ include-The has produced three primary findings: - Problems and solutions repeated across domains(Generalisation) - Technical evolution pattern repeated across industries. - Scientific facts developed across other domain, used to resolve present issue. There has been continuous research and development and invention of new systems with refinement of existing ones. TRIZ practitioners continue to apply the existing and new refined findings to define and improve products, services, and systems Example of TRIZ analysis: TRIZ problem solving can be done by looking individually at each of 40 principles to select the suitable ones or manually taking the help of softwares. Here is my example on Sigma Magic software: Problem:- Low number of walk-in patients at a diagnostic Centre, due to higher testing price. Target: Increase in number of Walk in patients, with out any dilution of quality of test reports. Contradiction: Quality Constraints After analyzing through software and choosing principle 26-Quantity of the substance(Improving feature) and principle 27- reliability(Worsening feature) and opting the business mode: Following principles were selected for obtaining solutions: Principle18: Mechanical Vibration Principle 3: Local Quality Principle 28: Mechanics Substitution Principle 40: Composite material Ideas and ideal solutions were obtained based on the content and recommendation of these principles. The screen shot is attached here. Use of TRIZ across different domains, examples: Samsung: : Samsung has been capitalizing on TRIZ since long and has been used across company and for various projects, patenting the most famous success story Management Problems: for analyzing and solving various simple to complex issues, such as additional revenue generation for various government run departments. -Various consumer based industries, automobiles and aeuronotics companies- Rolls Royce, Ford, Boeing, Johnson and Johnson, GE, LG, Motorola and even NASA – using TRIZ technology for various problem solving in different projects. - Healthcare industry- various principles are used for refinement of patient service- apart from improving healthcare facilities, other comprehensive services have also been included- like ATM, Cafeteria, use of radiology and laboratory services inside the emergency units. Principles commonly used are: Principle 2- Taking out Principle 13- The other way around Principle 25- Self Service Principle 35- Parameter Change .
-
Shashikant Adlakha replied to Vishwadeep Khatri's topic in We ask and you answer! The best answer wins!Analysis paralysis: Analysis paralysis means inability to make a decision on a particular issue in one’s personal life or in a corporate world, especially pertaining to some complex issues, associated with uncertainty or risks. This is attributed to overthinking or overanalyzing data pertaining to the issue. The possible causes may be: - Overwhelming incoming data or with large number of options or possible solutions associated with the issues. - Inexperience to handle the data/information - Extensive experience in data analysis and generating a large number of solutions at each step. - Tremendous risks or uncertainties involved - Striving for perfection There may be overwhelming amount of data to anlyze, The data may be financial data, some health related data etc., in paper or electronic format- graphs, spreadsheets, reports etc. There may be a trend analysis involved in the analytical process. The typical process is Collect data -------- > Analyze data ----------- >Make decision----------> Action In Analysis paralysis, the process gets stuck up at Analyze data step, so rather than going forward, more and more data is collected to analyze further. So a loop is created between these two steps and no decision gets made, leading to process paralysis. Three different types of analysis paralysis are: · Analysis process paralysis: Paralysis is at analyse data step, much time is wasted in going over the information again and again. · Decision precision analysis: decision makers, rather than going over the same information again and again, th seek new information and data, to explore further, rather than making a decision. · Risk uncertainty paralysis: Decision makers want to get rid of all uncertainties/risks, but the information available is not sufficient enough to do that. So decision making is postponed. Common examples of analysis paralysis are: - Dealing with something unusual or new things, with no prior experience - Decisions with associated significant risks, such as human life or financial stability at risk or political influence - Decisions on pricing for the products. Possible outcomes of analysis paralysis: - Extension of deadlines - Loss of opportunities- Opportunity cost - Loss of trust of stakeholders, teammembers - Project failure - Significant impact on financial stability and in worst scenario can lead to loss of human life in health related issues. Ways to avoid analysis paralysis: - Making smaller decisions and decisions with less risk - Use of more trustworthy data - Use experts to Interpret the data - Have a backup plan, if the decision turns out to be a bad one. - Choosing two or three best possible solutions and rethinking between them to choose the best decision/solution - Agile methodology with iterative steps and more emphasis on functionality(value creation), rather than product specification. Extinct by instinct: It is the opposite phenomenon to analysis paralysis, where hasty and careless decisions are taken, just by one’s own instinct or in a corporate, without doing thorough analysis and risk assessment. Extinct by instinct phenomenon can be the consequence of ‘GroupThink’ phenomenon , where a group usually takes a quick, unanimous decision, without any detailed analysis and by conviction of majority of the group members and others who are opposed to it, just give a nod to the decision, for the sake of maintaining good will and groupvalue. The major fall out of Extinct by Instinct: - High risk of turning to be a bad decision, significantly impacting the stability, financial and other key performance indicators of an individual or corporate. - High risk of project failures with significant monetary loss. Ways to prevent Extinction by Instinct: - Data and information analysis to be made before making any decision. - Detailed risk analysis of any decision to be done, before implementing it. - Group thinking phenomenon to be checked, decision based on scientific analysis to be implemented. So it is very important to avoid both contrasting phenomenon- Analysis paralysis and Extinct by Instinct phenomenon and rather a mid state has to be maintained, with prudent decision to be taken based on detailed analysis, but without get stuck at analysis step and making a best possible decision, before the projected deadline.
-
Shashikant Adlakha replied to Vishwadeep Khatri's topic in We ask and you answer! The best answer wins!Standard operating procedures govern all the routine and complex activities in an organization. While utmost care is usually taken in writing SOPS according to quality standards like ISO 9000, keeping in sync with the organization’s internal policies and detailed instruction of each activity being narrated, many of the SOPS(Manual or online) do not have requirements such as associated documents or computerised system to record the proof that all the tasks are actually performed according to the instructions in SOPS. This requirement is sometimes deliberately not included, as these may be audited in various external audits of the company. This results in employees not adhering to the instructions, especially if they are complex ones and giving the lame excuse that –“I forgot”. Also this kind of non compliance can happen when hard copies/soft copies of SOPs are not available at all the workplaces of the organization. Instruction creep refers to increasing number and complexity of instructions, due to changing rules and guidelines from time to time . This happens especially in complex organizations. The constant change and addition of inputs, leads to modification of instructions and considerable overlap , with loss of clarity and effective communications. Regardless of the length or complexity of the instructions, instructions are often perceived at same level and antagonize each other, without proper collaboration. Ways to avoid instruction creep with well-organized SOPS: - Instructions to be written in clear and concise manner. - To be written always from a practical perspective and taking the view and background of the employees, who will be using it on a constant basis. - Instructions must be written in a step by step manner, without having an overlap. - Instructions must be written in simple language with brief sentences, rather than expressed as in technical language or as a jargon. These instructions may be hardly understood by few employees, leading to confusion and chaos amongst other employees. - Directions need to be straightforward with no choices usually and even if it needs to be there- the situation and option must be clearly stated. ‘Must’ word be used, rather than ‘May’, ‘should’- which really have no concrete meaning and do not give a clear cut direction to employees,
-
Shashikant Adlakha replied to Vishwadeep Khatri's topic in We ask and you answer! The best answer wins!Filter bubble phenomenon coined by Eli Pariser, has surged from media personalization, which leads to trapping of users to view particular offerings or a view point without the view of contrasting things. This phenomenon entails use of artificial intelligence and based on features like- past browsing history of user, online searches, demographic data, credit card purchase history etc, it is easy to predict the nature and viewpoint of the user, be it regarding political, social, cultural or commercial products. Filter bubble was allegedly used by third parties like Cambridge Analytica to analyse the facebook profile of millions of people for creating “Psychographic profile’’ of those users and making them view particular political content, thus accentuating bias and influencing the voting behavior and results of election. Use of Filter bubble in business: - Based on the past buying, browsing through particular category of ad contents, users are offered tailored view of that particular categories of product ads, with few preferential sellers, who have subscribed to the business page of platform such as facebook. - This selctive bias of ad contents, works both in same webpage and across the webpage, e.g- Amazon browsing history of certain contents, may cause popping of similar kind of ad contents also in facebook. - Filter bubble helps in generating leads and substantially improve the sales revenue. - Marketing becomes much easier, as interested customers are directly targeted, rather than wasting efforts in finding suitable customers.
-
Shashikant Adlakha replied to Vishwadeep Khatri's topic in We ask and you answer! The best answer wins!Reporting bias means - selective reporting of data/ information or selective ignoring or under reporting of genuine information. Types of Reporting biases and their prevention Publication bias: Causes: Influenced by research findings : Published studies are only included : Positive results more likely published Prevention:- Both published and unpublished studies need to be included - Research should not be directed to a particular outcome- Peer authors involved in similar studies should be contacted. Time lag bias Causes:- Findings with significant or positive results much earlier published, than studies with negative results or null hypothesis. Early positive results of studies are promptly reported, whose long-term results may be actually negative. Prevention: Both positive and negative results need to be published without any discrimination. Multiple (duplicate) publication bias: Causes: Same data published in multiple studies, in different resources as slightly modified versions of the same study. More duplication is found in positive or significant results. Prevention: - Plagiarism check, linking the results of the studies. Location bias: Causes:- Studies may be published in journals with higher indexing in databases, leading to difficultly in tracing. Data may be from a particular location, or group with more chances of desirable result. Prevention: Data to be taken from multiple locations and representative groups. Data to be published in literature, which are easier to retrieve. Citation bias: Citation bias : Citing of studies with more positive results than negative results. Citation of positive findings may be done for funding purpose. Prevention: Citation should include studies with both supporting and contradictory findings. Language bias: Causes: Studies only in particular language, especially English. Non-English studies with positive results are published, where as negative results are not reported. Prevention: All language studies with positive and negative findings should be reported. Knowledge reporting bias Causes: Studies depicting various facts regarding particular action, property, about a particular class of individuals is not reflective of real world frequency and leads to knowledge bias. Prevention: Information about a small group of individuals should not be generalized to the larger population or the entire world. Outcome reporting bias: Causes: The outcome of studies are often influenced by the expected outcome, that leads to erroneous reporting of study results. Prevention: True results should be reported, never altered for the sake of reporting the desired outcomes. Prevention of reporting bias in organizational context: - Reporting of only positive findings and suppressing the flaws in an organization, leads to reporting bias and should be prevented. - Employees should be given free hand to report about any issues concerning management, technical and personal issues to the higher management level personals. - Business research studies and surveys should be conducted regarding possible ways of increasing the market share, revenue generation, possible research and development, and the reporting of results of these studies should not be influenced by any kind of bias due to any person or any particular pre-decided outcome.
-
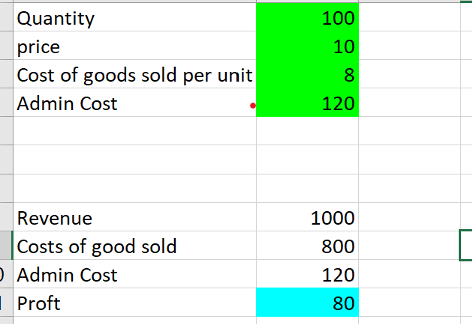
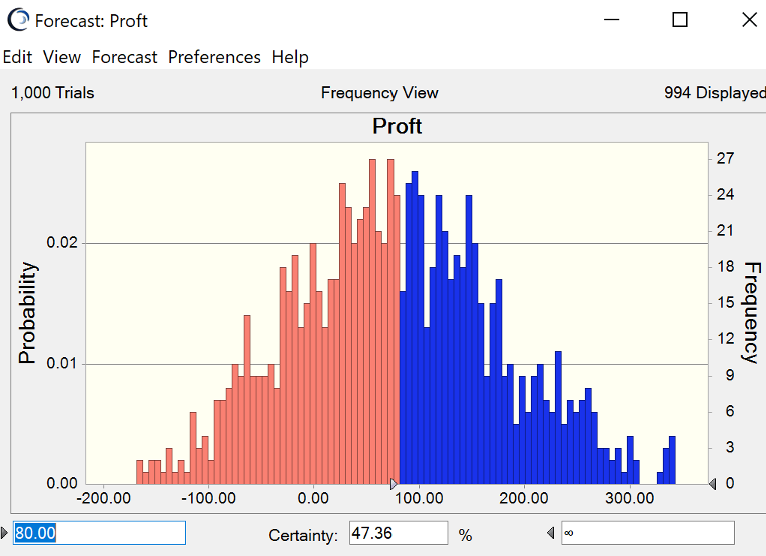
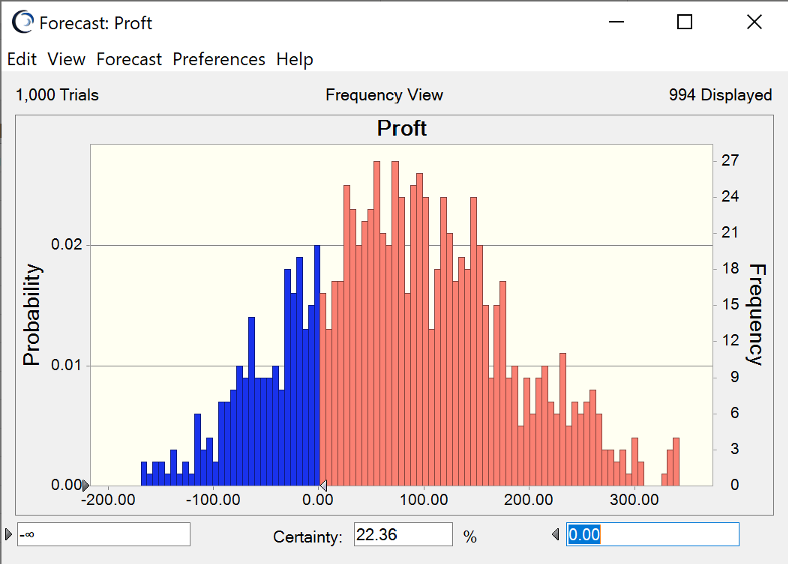
Shashikant Adlakha replied to Vishwadeep Khatri's topic in We ask and you answer! The best answer wins!The Monte Carlo- model is a popular tool and commonly used in risk analysis in a number of scenarios. This model is properly executed by Simulation software- The software runs a large number of what-if scenarios, using random number generator (RNG) to choose a random value for each input value and summarizes the results using relevant statistics and charts. Defining assumptions of input variables with type of distribution, define forecast and correlation if any between variables are required to be filled. All combinations of input parameters are incorporated into the results, using relative frequencies of different type of distributions of the parameters. Common uses of Monte Carlo analysis are:- - Project schedule risk estimation - Project Cost risk estimation - Best combinations of projects or activities selection to maximize the profit - Portfolio construction and management - Volatility of stocks, derivatives - Expected value of investment - Airlines, hotel industries, real estate, oil companies to decide best price of product/service to maximize profits, using OptQuest tool. - Sales projection of different products, using different assumptions/trends. - DFSS for six sigma projects in manufacturing Example- The following example denotes average statistics, pertaining to a sale of a good. We want to determine the probability of atleast a profit of 80$ each day, also we want to determine the risk of having loss rather than profit. After defining assumptions of different variables and running 1000 simulations, we get the following results: So, the probability of having minimum 8o$ profit every day is 47.36% So the chances of sustaining no profit and rather loss is 22.36%
-
Shashikant Adlakha replied to Vishwadeep Khatri's topic in We ask and you answer! The best answer wins!An elevator pitch describes the overview of a business in a very short time, the time it takes to complete an elevator ride, from 30 secs-up to 2 minutes and up to 80-90 word pitch. An elevator pitch may not include all the intrinsic components, but gives a vivid description of an idea, company, product, person. It is a very simple, yet quite effective marketing tool, especially for small businesses. Knowing the audience or market niche is an important pre-requisite for elevator pitch The important aspects of elevator pitch are: § Brief Introduction § Mission statement and activities of business § Value offered and problem solving ability § Unique selling proposition (USP) and difference from competitors § Asking a question to business leads about business/offering, e. g - in networking events § Giving a call for action- providing means for follow up or further contact. .Advantages of elevator pitch: · Simple and convenient and can be prepared in short time, without much preparation. · The information is in a simplified way, explains all the salient aspects and sparks interest to the listeners.
-
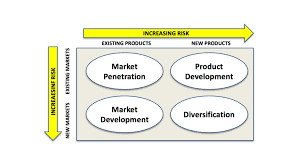
Shashikant Adlakha replied to Vishwadeep Khatri's topic in We ask and you answer! The best answer wins!Ansoff Matrix is a popular strategic framework tool for business growth. It was described by Igor Ansoff , a business manager in 1957. The different growth strategies of this model are: o Market Penetration o Market development o Product development o Diversification Market penetration: This refers to increasing market share within existing segment, by increasing the sale of products or services to the customers. The probable ways are: o Price decrease(economies of scale) o Increased promotion and distribution o Acquisition of competitors o Mild degree of product or service refinement Market Development: This refers to expansion and catching a share of new market in different geographical area, different country etc., using existing product or service with minimal refinement. The probable ways are: o Different Niche/customer segment of market. o Business to Business transactions, rather than only business to customer transactions. o Alliance with a local or regional leading player. Product development: This refers to marked refinement and development of new product or service to gain significant growth in existing market. The probable ways are:- o Significant emphasis and investment in research and development of new products and services o Joint development of new products with other companies o Acquiring quality products from other firms and selling it under own brand. Diversification: This refers to getting increased market shares introducing new product or offerings, in addition to the existing offerings. This can again be classified into: Related diversification: Venturing into related kind of businesses or product, so there is synergy between existing and new products. Unrelated diversification: Venturing into unrelated businesses or products, with different kinds of market segments. In Ansoff Matrix, as move from one to another quadrant, the risk increases. So out of all the strategies, Market penetration option is having the least risk, and diversification entails both product and market development, so two quadrant move is required, so having the maximum risk and unrelated diversification is more riskier than related one, due to lack of synergy. Ansoff matrix, with reference to Apple Inc: Market Penetration: Sale of different products through multiple platforms like Apple Stores, Apple.com, in alliance with various telecommunication companies, like Vodafone. Promotion through various media outlets and own website. Market development: Continuously emerging as a global brand, by manufacturing bases at USA, China and opening exclusive Apple stores and tie up with regional branded stores across different countries. Product development: Product innovation and differentiation has been the major strategy of Apple. Various range of products have evolved with time- I phone, I pad, I watch, I pod, Apple TV, Mac os, ios, I cloud platforms. The versions of different products are also getting updated regularly. The different Apps used in these products are also major source of revenue for Apple. Diversification: Apple started from a simple computer and diversified into a number of related and unrelated products, like Apple watch, Apple Pay, Apple Credit Card, along with new market development for products Image reference: www.tutor2u.net
-
Shashikant Adlakha replied to Vishwadeep Khatri's topic in We ask and you answer! The best answer wins!SERVQUAL model is a widely used multidimensional questionnaire, for inspecting and measuring the service quality of businesses by recording and comparing the expectations and perception of customers/respondants. The questionnaire typically consists of 22 questions of 5 dimensions. Additional questions may be added in the relevant dimensions, e.g- demographics of respondent, brand loyalty with prior use, behavioral patterns such as likelihood of customer for further referral to others. Face to face interview is required and large number of potential customers are to be surveyed for statistical reliability. The dimensions are: Reliability- 5 questions: The ability to execute the promised service accurately and in a time bound manner. Assurance: - 4 questions: The ability of employees to instill confidence and trust in customer’s mind. Tangibles: 4 questions: The physical dimension/appearance of any of the service deliverables or process, like premises, equipment, people etc Empathy: 5 questions: Care and attention to customer perspectives. Responsiveness: 4 questions: Response to customer issues and provision of prompt service. This model can be used in all most all industries and geographical areas,e.g- - In educational context to asses the quality of education - In hospital and other healthcare areas. - IT industry - Art Gallery Example of SERVQUAL model in a hospital scenario Dimension Expectation Perception Reliablity: Hospital promises successful treatment of the disease in shortest time The patient is treated well by doctors and patient is completely disease free in stipulated time Assurance Patient is well informed and assured of best treatment. Patient is well assured by doctors and other staff of hospital. Tangibles Hospital will offer well maintained patient wards and all amenities for comfort. Hospital OPDS and patient wards are hygienic, well maintained and all comfort means are provided. Empathy Hospital provides round the clock emergency services including specialists on call. Emergency services, including doctor consultation, diagnostic testing and pharmacy are provided Responsiveness Patient issues and feedback will be immediately actioned Ward in charge, Quality department and PRO monitors patient comfort and immediately takes action on patient’s grievances. Service quality can be stated as: Service Quality= Perception of service- Expectation of service Service quality is rendered as low, when perception of service is lower compared to expectation and on contrary, service quality is rendered as high, when perception exceed the expectations
-
Shashikant Adlakha replied to Vishwadeep Khatri's topic in We ask and you answer! The best answer wins!A PICK chart is an efficient Lean Six Sigma tool, which was originally proposed by Lockheed Martin, for selecting among different process improvement ideas and methods during define phase of lean six sigma project. A pick chart depicts visual comparison of different actionable tools, with reference to their ease of implementation and their effectiveness or likely improvement gain. In the Visual chart, all the methods can be grouped in 4 categories on a 2*2 matrix; one axis connotes a graded scale of payoff/ benefits/improvement , another axis denotes ease of implementation. The ease of implementation includes the cost factor as well as availability of other resources and compliance to the method. PICK stands for Possible, Implement, Challenge, Kill Possible:- Low payoff, easy to implement These are the ideas, that can be possibly implemented, but the exact payoff needs to be assessed and compared to higher payoff ideas. Implement:- High payoff, easy to do These are the ideas, which are to be immediately implemented, without further deliberations. Challenge- High payoff, Hard to do These are the ideas with good benefits, but because of constraints, it’s difficult to implement. The challenges posed need to be overcome to reap the benefits of the ideas. These ideas are not discarded immediately, and constraints optimization is best tried and still if its not being overcome, then they are rejected. Kill- Low payoff, Hard to do These ideas are to be immediately discarded without much consideration, as there is low benefit and high constraints in implementing ideas. The PICK charts can be implemented anywhere, in any kind of business with much ease and can be quite useful in framing the improvement ideas usually after brainstorming sessions in define phase. Image reference: www.txm.com

-
Shashikant Adlakha replied to Vishwadeep Khatri's topic in We ask and you answer! The best answer wins!- Herd immunity in medical world means overall protection of community, when a substantial proportion of people are immunized or vaccinated against a particular pathogen. Herd immunity acts an important line of defense against the spread of infectious diseases. It protects unprotected individual from infections. - System patches in IT, act equivalent to that of vaccines in medical field. As we can not vaccinate each and every individual due to poor compliance, poor socioeconomic status etc, similarly we can not secure all the systems due to economical constraints, technical and operational issues. e.g-legacy systems in financial and transport sectors, few of the diagnostic equipments in healthcare sector. Network connectivity is now required in all the systems, even for specialized and legacy systems, which are not designed accordingly. Patching or frequently applying software updates, may deter the operations, while not doing so, may jeopardize the security of system. Raising awareness about the cybercrime to employers and employees and installing security measures, helps in enhancing overall online security and confers a herd immunity. So for unprotected systems, apart from active monitoring, herd immunity can play a crucial role in securing the sytems. These systems, should be made to interact with patched systems only, so that spread of malicious code is curtailed and protection is conferred to all the systems. - In business world, by use of strong encryption , anonymized browsing and security software, hacker and government surveillance can be averted. So it will prevent from gaining access to datasets including customer profile, transactions, which can be used for targeting by peers and other companies such as advertisers, insurance companies etc.. If a large number of companies use these privacy tools, they become readily available to other non compliant companies and their employees as well, when ever they needed them and thus ensuring herd immunity and immunity to data invasion. References: -www.mcafee.com - www.lorca.co.uk -www.hbr.org
-
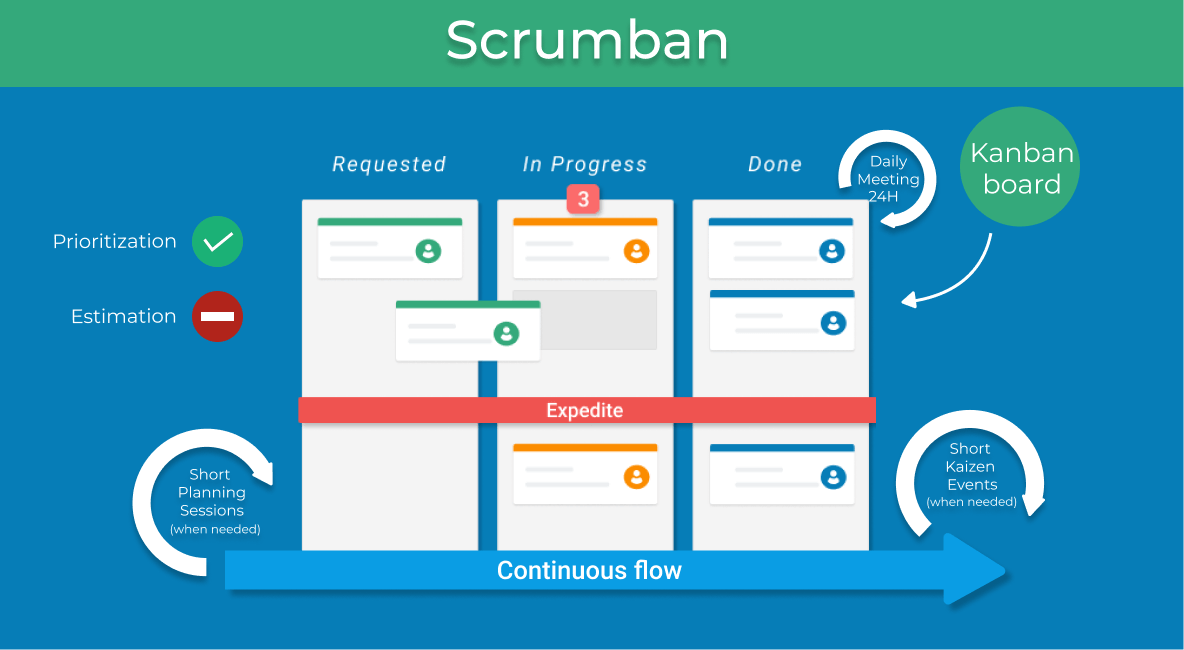
Shashikant Adlakha replied to Vishwadeep Khatri's topic in We ask and you answer! The best answer wins!Scrumban is an evolved agile methodology, in which work is organized in small iterations and monitored with help of a visual board, with combination of tools of scrum and Kanban boards. The main charactersitics of scrumban in comparision to Scrum are: -The iterations(sprints) of scrum are not pre-fixed, but as needed , a kind of replaced by continuous flow system as in Kanban. -The teams involved may be specialized rather than cross functional teams of Scrum. Specialized team obviates the need of a Scrum master, who controls Scrum. - Task limits- Limited by work in progress(WIP), rather than sprint in Scrum. - Tasks are taken up by the team members in a pull system, rather than preassigned tasks to team. - Boards, backlogs and burn downs of Scrum are replaced by Boards only. -The Performance metrics in Scrumban included lead and cycle time, average Cycle time, rather than burndown Chart in Scrum. - Planned meetings are not mandatory, rather on demand and optional meetings are conducted. -Sprint planning is not required and replaced by on demand and bucket planning. - Prioritization of work is carried out by priority columns, rather than backlog refining in Scrum. - New tasks and changes may be added in a live iteration, which is not allowed in Scrum. The key benefits of Scrumban are:- -Quality oriented -Just in time is facilitated - Event driven and caters to the requirement - Continuous improvement(Kaizen) is facilitated -Waste is minimized by eliminating non value added things -Overall process improvement, as and when needed - Workflow issues and resource issues of Scrum get sorted out -Ideal for maintenance projects -Ideal for projects with unexpected user stories and programming errors. Image Source: www.kanbanize.com

-
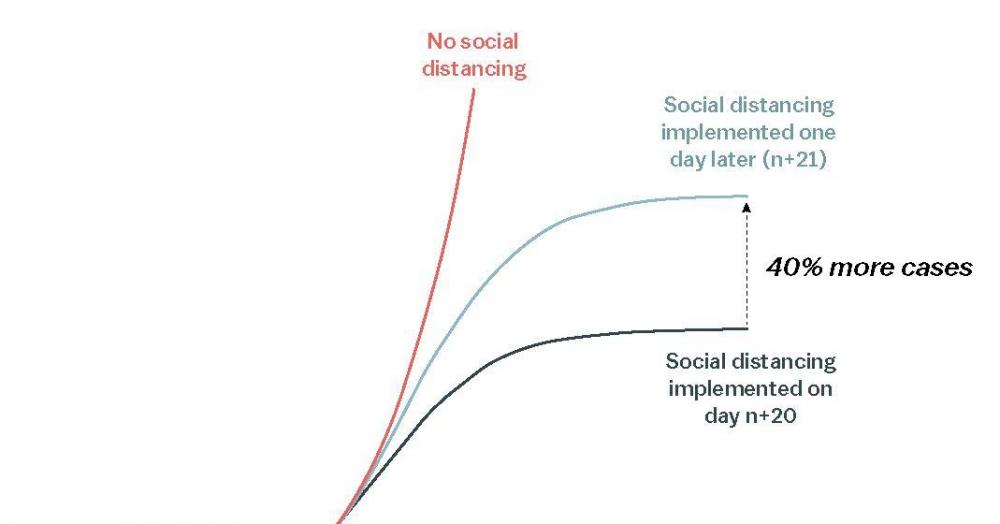
Shashikant Adlakha replied to Vishwadeep Khatri's topic in We ask and you answer! The best answer wins!Corona virus infection pandemic is right now creating havoc in all parts of the world, with infection that originated from China has travelled to 199 countries with a significant surge in the number of case in European countries like Italy, Spain, Germany, France and in a time frame of March 20 th- March 30 th 2020, there has been a marked increase in the number of cases in the United States, with number of cases in USA, going beyond 150,000. The growth pattern is presumed to be exponential type, with number of infected individuals increasing in proportion to the total number of present cases. This pattern can be exemplified by a task assigned to a person, the person tagging the task to three other persons. All the three persons assigning the tasks to three other persons and so on the pattern continues, so the number of involved persons rising from 1 to 3 to 27 to 81 to 243, so there is a rapid and exponential increase in the number of persons involved. Exponential growth of viral infections has led to predictions of new cases day by day, which may fall short of(26 th March 2020) , nearly equal to or may surpass (27 th March 2020) the number of actual cases that are being observed in the data of worldometers.info. The increase in the number of cases than predicted can be attributed to be due to many factors- due to multiple modes of transmission of virus, including airborne route reported in some studies, relapse of cured cases with re-infection by new mutant stains of virus. The decrease in number of cases, compared to predicted number of cases and flattening of curve can be attributed to- proactive measures of social distancing adapted actively by different countries, poor testing facilities of virus in different regions. The number of deaths arising out of these cases is much difficult to predict, as it depends on vulnerability of the population, demographic data and efficacy of healthcare system. The exponential prediction does not take into account the complexity of pandemic and multiple interactions of the variables and also does not account for the flattening of the curve due to social distancing. The equation used for exponential prediction is- x(t) = x0 × (1 + r) t where x(t) is the value at a particular time t x0 is the base value at time t=0. r is the presumed growth rate t is the time interval between time 0 and day of prediction. Imagesource:https://www.google.com/urlsa=i&url=https%3A%2F%2Fwww.vox.com%2F2020%2F3%2F15%2F21180342%2Fcoronavirus-covid-19-us-social-distancing&psig=AOvVaw39XxyUJPlQ32Vjm7sdLYLs&ust=1585689691869000&source=images&cd=vfe&ved=0CAIQjRxqFwoTCMjumc6Qw-gCFQAAAAAdAAAAABBA
-
Shashikant Adlakha replied to Vishwadeep Khatri's topic in We ask and you answer! The best answer wins!Corona Virus infection has severely impacted human life with a heavy bearing on socioeconomic life and bringing the world to the brink of a deep recession. At this critical time, government and most of the business organizations have already taken proactive and reactive measures, so that their critical operations continue unabated, while simultaneously protecting the health and safety of their employees and customers. In terms of employee’s perspective, there are various changes and challenges ahead and adaptive responses that are needed- - There is wide speculation worldwide regarding job losses, salary cut, bonus omission etc. These looming uncertainties are seriously impacting the employee’s performance in this uncertain time. - While majority of the employees are being given task of work from home option, most are not aptly trained for that. IT departments of the companies might be training employees, but not are all tech savvy and it will take lots of effort and time, before they get fully adapted. -The biggest responsibility of employees is to maintain the critical tasks of the organizations, remain safe during this crisis by maintaining social distance and not going to offices, unless and until it is deemed to be dire urgent by the employers. Even if the employees need to go to offices occasionally, they must take all safety precautions, so that they do not get infected, nor do they spread infection to others. - Each organization has different corporate culture and human resource polices, so its important to stay tuned to corporate announcements, align with human resource department. - All the critical tasks, including attending crucial meetings by various online platforms, submission of projects, meeting the important deadlines are utmost necessary - Marketing and sales personals must tune in to complete digital marketing, so that marketing operation can continue unabated. - Last but not the least, in spite of best efforts by employers to conserve jobs and continue the operations, there may be hard realities and bad financial impacts are very likely, so employees should start looking for other likely sources of income, in case their organization is badly hit.
-
Shashikant Adlakha replied to Vishwadeep Khatri's topic in We ask and you answer! The best answer wins!The ongoing Coronavirus infection pandemic has badly impacted the human life. Apart from the serious morbidity and mortality, this kind of rapidly spreading and devastating pandemic poses serious threats to the socioeconomic conditions of humans as well. The economic deterrents could be in the form of o Impeded Capital Access o Strained Inventory and Supply Chain o Diminished Customer demand o Additional Facility Remediation and Clean-up Costs o Deterred marketing operations There are various guidelines issued, including the CDC(Centre for disease control) for the business organizations and employers. Business leaders can play a vital role in putting a curb to this pandemic transmission and simultaneously mitigating the loss to their economic wellbeing. -Put a curb on transmission Among Employees - Sick employees should be instructed to stay at home and possible investigations and treatment for them. - Identification of possible areas of infection, periodic cleaning up and sanitizing the facilities - Educating employees about the disease transmission, ways of prevention and possible complications. -Sustaining Healthy Business Operations - A workplace coordinator appointment for overseeing the COVID 19 related issues and their management. - Leave policies and other human resource policies should be made more flexible to be compliant with public health recommendations. - Taking a decentralized approach and empowering the managers of different units to take decisions based on local conditions and recommendations. Contingent business plans and actions: -Deal with alternate suppliers to maintain supply chain, prioritization of existing customers, critical and essential operations need to be maintained in all possible scenarios. -Hiring of temporary employees to maintain the operations and also cross training of existent employees, in the event of spike of absenteeism. -Delivery of products and services at doorsteps of customers, with appropriate guidelines for the drop up of the products and services. -Mutual sharing of business plans and best business practices with peers and business partners. -Include the pandemics and other natural disasters in FMEAs with emphasis on their control measures. Policies and practices for social distancing: Social distancing ,as recommended by different public health and other government agencies should be implemented. The strategies could be: -Remote online working, including flexible work hours. -Partitioning and increasing the space between employees, between employees and customers. -Digital advertising and promotion of products and services, rather than conventional marketing.
-
Shashikant Adlakha replied to Vishwadeep Khatri's topic in We ask and you answer! The best answer wins!Mistake proofing (Poka Yoke) is based on detecting and solving the problems, as close to the source as possible, rather than identifying and solving when the product or service has already been through the customers. So the products are designed in ways such that auto detection happens at different stages and without manual or auto correction the production or the process gets halted, thereby ensuring that there are no flaws or defects. Mistake proofing is based on these six principles, based on order of priority in addressing issues Elimination: Eliminating the errors by redesigning of part of the product or process. Replacement: Use of automation or robotics in place of manual process to prevent errors Prevention: Using features, that prevent wrong processes, e.g- connectors to avoid misconnecting wire or cables in electrical assembly. Facilitation: Specific methods such as visual controls, that includes use of color coding, labelling on parts to facilitate execution of right process. Detection: Using sensors or detection alarms, whenever wrong parts have been assembled or wrong processe has been executed. Mitigation: Reducing the impact of errors, when they are discovered e.g- Fuses to prevent overloading in short circuits. Mistake-proofing opportunities and their potential control actions can be prioritized by failure modes and effects analysis (FMEA) of process and design. Mistake-proofing techniques need to be developed for every step in both manufacturing and service industry. Visual control methods can be used as a part of mistake proofing in facilitation methods. But the basic difference lies in the fact that visual control mechanisms do not make the process completely mistake free, rather by providing visual inputs of critical processes and statistics, there is marked increase in efficiency and improvement of the process and chances of mistakes is diminished. Where as mistake proof methods by definition should make the product or service process mistake free. Common uses of visual controls, where they are preferred over complete mistake proofing methods are: -Commonly Used with 5S methods to create overall standardization and a part of continuous improvement process. - Kanban boards for inventory controls and Heijunka boxes for production scheduling. -Large scale communication boards for easy display of quality indicators, so that any possible deviation is met with serious contemplation and prompt corrective actions. -Easy display of shop floor schedules, performance measurements, communication and feedbacks mechanisms involving supervisor and workers. Daily work flow in a car service station is a good example of this. -Visual display of prescription pills, so that it is difficult to miss any dosage and mistakenly take wrong pills. -For the safety and warning signs, e.g- stop signs, handicap parking signs, no smoking signs, color coding of bins for collecting different categories of biological wastes etc -Control and maintenance of tools and equipments, displaying their maintenance status and the service dates, calibration dates etc. -Quality management in various organizations by display of quality charts, cause and effect diagrams etc.
-
Shashikant Adlakha replied to Vishwadeep Khatri's topic in We ask and you answer! The best answer wins!Difference between confidence and prediction Intervals: Confidence Interval is used for determining an interval or range with a particular confidence or probability level, which contains the population parameter of interest such as mean, standard deviation, regression coefficients, proportions etc.with specified settings of the predictors. A confidence interval does not reflect the data point distribution. For example we design an experiment to test HbA1c(glycosylated hemoglobin) level in diabetics. We evaluate the HbA1c level in patients with random blood glucose level >150 mg% and <150 mg%. We evaluate 50 patients in each category. Statistical software can predict the responses in these two settings. Minitab calculates a 95% confidence interval of the prediction of 7.5-8.5 % for glucose level >150 mg%. So we can be 95% confident that this range includes the mean of HbA1c for this group of patients. But we cannot say with confidence that 95% of time, the HbA1c values will fall in range. Confidence intervals accounts for the sampling error, when a sample characteristics is represented to characterize the entire population. So with the increase in sample size, there is reduction in sampling error and narrowing of the confidence interval and when sample becomes equal to the population size, confidence interval will narrow down to a single value. Prediction interval determines the future range of a single observation with a confidence/probability, given specified settings of the predictors and enough samples. Prediction interval is a kind of confidence interval, which used in regression analysis for prediction Using the same settings as cited above, Minitab calculates a 95% prediction interval of 7 – 9 gm %. So it implies that 95 % values of HbA1c with specified condition of random blood sugar > 150 mg%, will have HbA1c in this range. The prediction interval is broader than confidence interval , because of having sampling error plus added uncertainty in predicting individual values, as compared to that of only sampling error in confidence interval. Prediction intervals are more commonly affected by deviation of the values from gaussian distribution. Use of Confidence and prediction interval in business world: Businesses can be benefited by statistics in estimating or predicting the future events. Material requirement: For example, a business would require an estimation of raw material required, the amount of raw material required can be predicted with 95% confidence. Only 5% of time, the material used will be out of range. We can compute both prediction and confidence intervals. Market Research: To estimate the sales forecast, range of sales figure can be predicted using the data from past sales, customer data and other demographic data of niche segments. So prediction interval is appropriate in this setting. Budget Forecasting: With values for revenues and costs and deducing the confidence and prediction intervals of those values, businesses can take important financial decisions Risk Management: By forecasting probable risk events by calculating prediction interval , businesses can manage the events very well in the event of it’s occurrence. Prediction intervals are preferred over confidence intervals, when more accurate results are desired, for example- if it is desired to obtain a total monthly expenditure of organization and assume that confidence interval falls in range of 10,000-12,000 USD. If we estimate prediction interval, it will fall in range of 9500- 12700 USD. So we can be 95% confident that total monthly expenditure value will fall in prediction interval value ranges. So businesses are better prepared with prediction interval rather than confidence interval, which estimates monthly averages.
-
Shashikant Adlakha replied to Vishwadeep Khatri's topic in We ask and you answer! The best answer wins!Subgrouping in Process Capbility determination: -As process capability varies inversely to standard deviation, so to enhance process capability (Cp,CpK), there should be decreased variation within subgroups and for enhancing process performance ( Pp,Ppk), there has to be reduced overall variation( sum of within subgroup and in between subgroup variations).Target should be elimination of between subgroup variation and marked reduction of within subgroup variation. - Data should be collected in rational/logical subgroups, which are made of similar item-usually in 3 to 5, produced during a short span of time. Subgroups have to be representative of output and the items included in subgroups have to be collected in same conditions and inputs- suppliers, equipments, personnel, place etc. The data needs to be of long duration to account for process variation. -So the variation obtained with in these small subgroups, can be termed as natural variation. The variation obtained between subgroups is due to some special cause variation, which needs to be identified and eliminated to improve process performance. For example, a heavy industrial machine produces 500 metallic parts per hour. Five random samples are collected every hour and constitute a subgroup. The total variation = Variation within groups of 5 +Variation between different subgroups. Subgrouping not done in process capability calculation: -It may not be feasible to collect rational subgroup data in all the situations, example- In Manufacturing, If there has to be change of batch or raw material, the number of defects and defectives, with each batch may be significantly different. Logical subgrouping may not be possible , as the conditions are different in each batch of products.
-
Shashikant Adlakha replied to Vishwadeep Khatri's topic in We ask and you answer! The best answer wins!Lean and Six Sigma in Sales and Marketing: Sales and Marketing are indeed the areas of revenue generation. So there must be utmost efficiency in these processes. Lean Six Sigma in sales projects can increase profitability by standardizing and improving sales and marketing activities. Most implementations require use of a combination of key tools such as – data collection plans, fishbone diagrams, Pareto charts, 5 whys, and a few others –which can be flexibly adapted in sales environment. Based on best practices of many of the famous organizations, Lean Six Sigma (LSS) has applications in following domains of sales and marketing- -Lead generation -Sales proposal process -Forecasting of sales -Launch of new products -Sales force efficiency and effectiveness -Voice of the customer(VOC) The first four categories of projects together are assigned as category 1 projects. All of these processes have in common - supportive of the core sales activity, improve the internal processes and activities, the data and metrics of process performance are easy to collect and the processes are fairly repeatable. Increased number of lead generation, periodic forecasting of sales, increasing the proposal of sales to customer and launch of new products, all can significantly impact the sales process. The category 2 projects include “sales force efficiency and effectiveness” and “voice of the customer”. They are tougher in -identifying consistent processes, collection of reliable quantitative data, root causes delineation, generating and implementing solutions. They directly impact the sales force and have an impact on sales and revenue. Efficiency and Effectiveness of Sales force: Industries such as pharmaceuticals, medical devices, hospital products, financial services, Information technology, have selling forces which call on many customers and have significant variation in the performance output of individual sale representatives. Six sigma tools can be applied to reduce much of the process variation and improve the overall efficacy of sales effectiveness. Six sigma tools such as Ishikawa, 5 whys can identify the root causes of variation in performance of sales of different representatives and across different territories. Important factors of variation can include-selling behavior, skills, job experience of representatives. The best practices and selling tactics can be traced and replicated to entire sales force, by imparting training by sales manager and experts, discussing and awarding the best sale achievers. Voice of the Customer Projects Voice of the customer (VOC) projects are more apt for the industries, having concentrated market and customer segment- like aerospace, automotive and household appliances and most have a highly active and relatively smaller sales force. VOC projects targeted on improving customer share, first by identifying the basic requirements of a product or process, by conducting various customer-based surveys regarding their expectations. Apart from basic requirements of customer, these projects also identify various customer delights (add on features apart from basic requirements), which can lead to significant competitive advantage and huge jump in company’s revenue. Identification of root causes of drop in sales, through surveys, coupled with finding new opportunities(customer delights) and implementing them, can have a huge positive impact in revenue growth. Theory of Constraints (ToC): Theory of Constraints (ToC) is a management theory, based on assumption that every output is limited by constraining processes. So resolving these constraints, can significantly improve the output. TOC is always been a continuous process. Identification of weakest link, fixing it up, again identifying the next weakest link in sales management and so on. TOC also includes hiring of new resources and supplementing the stretched-out resources of the organization, so that all the components of sales management work in full capacity. Sales teams usually work with a number of constraints – the number of sales representatives, average number of clients to handle, leads generated by marketing etc. So enriching each of these constraints can significantly increase the output. Each of these enriching activities have to be coordinated with others for significant gains. Identify the Weakest Link: The weakest link has to be identified, which is derailing all other processes. The weakest link can be in inbound sales team or in outreach team. By working on weakest link and resolving it, many of the constraints get resolved. Outsourcing: Outsourcing the hindering processes, that are retarding the full functionality of the sales team. The outsourced agencies can generate leads, sales list, transform other sales related processes. Sandboxing New Resources: Addition of new resources to fix the constraints is a desirable option. But checking the quality of the output of these external agencies is very important. Sandboxing is a software management strategy of creating an isolated testing mechanism of running programs, executing files, without affecting the system or platform in which they are operating. Assimilation After the external agency is tested in its quality, sandboxes are removed and they are assimilated in the existing sales process. Outsourcing may not be a sustainable solution for the constraints. It is always more prudent to hire new resources, which can be integrated as part of the internal resources and complement the existing resources. Combining the TOC and Lean Six Sigma: An integrated approach to process improvement can be: Define the problem and the business case Measure the current state in terms of data and metrics Analyze: Use a number of root cause analysis tools-like Fishbone, 5 whys, paretos, FMEA. A current reality tree to be constituted, explaining the interlink of the constraints. State the assumptions and evaluate them. Improve performance by : a) constraint exploitation b) system subordinating to the constraint and c) Constraint elevation to break it. Lean and Six sigma tools to statistically validate the improvement Follow up, sustain and control the improved performance.
-
Shashikant Adlakha replied to Vishwadeep Khatri's topic in We ask and you answer! The best answer wins!General Electronics(GE) adapted the “Work out” theory of Jack Welch, who was CEO and Chairman of GE. Work out is a kind of team based problem solving and employee empowerment process. Work-Out proved to be revolutionary in GE success and the result of this process was the Change Acceleration Process, commonly referred to within GE simply as “CAP.” Change Acceleration Process (CAP) is the process of significantly improving the current state of any process/product by accelerating the transition steps. ARMI (Approver, Resource, Member, Interested Party) is an integral tool of CAP. . ARMI stands for: A - Approval of team decisions R - Resource of the team, pertaining to the skills and expertise M - Member of team I - Interested Party, who need to keep himself and others informed during the process ARMI clarifies the role of each individual in process and resolves any ambiguity in roles and responsibilities. Other commonly used CAP tools are: - Critical Success Factor analysis - Stakeholder Analysis The effectiveness of the change in CAP is measured by: Effectiveness=quality x Acceptability Quality and Acceptability denotes the quality and acceptance of technical strategy respectively. So it implies that apart from technical excellence, the process must be friendly and accepted by the people/employee. THE CHANGE ACCELERATION PROCESS (CAP) MODEL 1. Leading Change Authentic and committed leadership throughout the process is of prime importance. 2. Creating a Shared Need The need for change must be well felt throughout the organization and must be able to overcome the inertia of change. 3. Shaping a Vision: Clear vision of the organization after the change initiative, must be well articulated and understood. 4. Mobilizing Commitment Influencing strategy to mobilize commitment to drive the change. 5. Making change last The change must last, the gains and knowledge of pilots, must be integrated with existing processes to achieve a sustainable change. 6. Monitoring process Measuring the progress of change initiative, benchmarking them and developing accountability for any lack of progress. 7. Changing Systems and Structures The underlying systems and processes, Standard operating procedures(SOPS) must be altered to accommodate the changes, so that improvement becomes tenable. The key advantages of CAP are:: - Speed to action - Simplicity of tools - Self confidence to bring innovative and sustainable solution - Faster and cost effective Six Sigma Versus Workout: -Six Sigma projects are based on systemic methodology of reducing defects and making improvement in process through problem statement, statistical analysis, testing hypothesis, implementing and controlling the improvement process. The major limitations of six sigma projects are – time consuming, significant funding and resources may be needed in complex projects, difficulty in meeting the expectations of non belts (non six sigma professionals). Work out on the other end is much faster, improvement can be demonstrated at earliest. The managers and employees can quickly implement their ideas in work out and improvements are visible very early for internal and external customers. A structured format is made in work out, assigning specific responsibilities to each of the employee in bringing out accelerated change. So the level of engagement of employees is better in work out compared to six sigma process. Work out process, if integrated with six sigma process, can significantly add in efficacy of six sigma implementation in companies by accelerating implementation of solutions of six sigma, improving employee satisfaction and significant savings in financial costs of six sigma process.
-
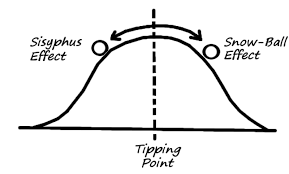
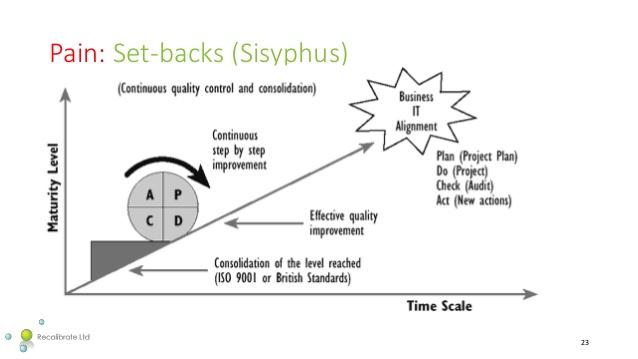
Shashikant Adlakha replied to Vishwadeep Khatri's topic in We ask and you answer! The best answer wins!Sisyphus effect, emanates from a Sisyphus who was a king in ancient Greek, was being punished for his craftiness and cruelness. He was being punished to carry a rock up the hill. As he used to reach the hilltop, the stone was being forced down the hill by god. His repetitive actions were all futile and never-ending. The Sisyphus effect is seen in day to day activities and continuous improvement activities and projects. It is due a never ending to do list due to large number of incoming and demanding activities. The employees get demotivated and struggle in their work, when their leaders do not value their hard work and dedication in accomplishing the activities, urgent work and continuous improvement activities. Rather some of the leaders criticize their workers. So the leaders are killing the usefulness of their team member’s contributions and leads to accumulation of their day to day activities, which are rendered as worthless by leaders . Strategies to combat Sisyphus effect: - Give a continuous ongoing feedback to team members in their day to day activities. Give acknowledgment, appreciation and rewards for their good performance. - Trust the team members in accomplishing improvement and project related work, without managing them all the time. - Remain connected with the team members, explain them clearly their role in doing improvement activities and how their contribution adds in achievement of the goals and upliftment of the organization. - To do list with prioritization of the work, based on the level of importance is utmost important to have a clear vision. - Start doing the things, according to the order of importance. - It is important to keep a track of effort/input and likely outcome. - Daily review of workload is important, before starting to just get going - Root cause analysis to find out the causes of Sisyphus effects, continuous quality improvement to tackle them and overcome the tipping point(threshold at which sudden downfall occurs) Sources for the images www.researchgate.net www.slideshare.com
-
Shashikant Adlakha replied to Vishwadeep Khatri's topic in We ask and you answer! The best answer wins!The Wisdom of Crowds implies the amalgamation of information/ideas/guesses in groups, that are regarded as better, compared to that could have been put forward by any particular member belonging to that group. The theory came into existence with Francis Galton’s discovery that a crowd of a particular country together did a much better guess of the weight of an ox, when their guesses were averaged, in comparison to the guess of all the members taken individually The advantages of wisdom of crowd is attributed to be due to following factors: Cognition: Individual thinking and opining are much faster compared to the contemplation of experts or expert committees, which offer many a times biased decision, out of each other’s influence or under external influence. Diversity of opinion Independent opinions: Not influenced by other’s opinion Decentralisation: drawing opinion on local knowledge Aggregation: Assembling all individual decisions and leading to a collective decision Trust: Every person has a trust on collective group and respects it's decision. The reasons for failure of wisdom of crowd and strategies to combat: 1. Homogeneity/Lack of diversity: There has to be enough diversity to generate much of variance in thought process and private information 2. Centralization: The opinion must be derived from local knowledge, rather than a centralized controlling factor. 3. Division/Lack of dissemination of information: There needs to be free flow of information from one subdivision to another, lack of which can lead to failures, such as in 9/11 attack, lack of information from one to another subdivision led to failure of intelligence in prevention of such attacks. On the contrary, free flow of research information on SARS virus and its isolation, without any central control led to better curb on viral infection. 4. Imitation: The focus should be to make right decisions based on the current choices, rather than looking for any similar kind of decisions in the past and imitating it. 5. Emotionality: Emotional factors , such as togetherness can lead to peer pressure and members get influenced by each other and create collective hysteria. So the members should be divergent, without significant peer pressure. Application of Wisdom of Crowd in real world: Prediction markets: one of the most common application is that of prediction market, which creates speculative or betting markets, based on common questions, such as “who do you think, will win the polls’’. The current market values are indicators of probability of the event. The best example is Betfair, which is world’s biggest prediction exchange, with a very high trade volume, based on collective prediction. Many web based quasi-prediction market companies make use of this phenomenon to offer predictions based on things like sporting events, stock market etc. Prediction marketing principle is also being used in project management software to enable the team members to predict it’s real time deadline and probable budget. Delphi methods: The Delphi method is a kind of planned and interactive decision, based on a panel of independent experts. The selected experts , answers questionnaires in few rounds. After each round, a moderator provides summary of all the expert opinions. The participants are encouraged to modify their answers, in light of other answers. The range of answers decrease in the process and lead to convergence towards correct and better answer compared to individual answers. Human Swarming: It is enabled using software such as UNU collective intelligence platforms, in which groups of networked users can collectively respond to questions, generate ideas and make collective predictions. Studies have shown that human swarms perform better than individuals across a number of real-world predictions. Stock Markets: Wisdom of crowd aspect of stock markets enables decision makers (e.g. firms’ managers, capital providers, regulators, or central bankers) to use stock markets and their own information for a large scale predictive market.
-
Shashikant Adlakha replied to Vishwadeep Khatri's topic in We ask and you answer! The best answer wins!The Kaplan–Meier estimator, named after statisticians Edward L. Kaplan and Paul Meir and also called as the product limit estimator, is widely used for estimating the survival function from lifetime data. It is a type of survival models, which models time to an event. Examples include- In medical sector-Time to death after first heart attack, proportion of patients, living for a particular period of time. Some other uses are- time to loan repayment, time to get a job after graduating, in the insurance sector, in credit and banking sectors to estimate the fraction of delinquency and default. A plot of the Kaplan–Meier estimator contains a number of horizontal steps, with a large sample size and approaches the true survival function of the studied population. Kaplan–Meier curve takes into account censored data, which occurs if a patient is not being followed up, the patient voluntarily withdraws from study or the patient is still alive, without event occurrence at the time of last follow up. Small vertical tick-marks on the plot indicate individual patients with censored survival time. Without censoring, the Kaplan–Meier curve shows the empirical distribution function. In medical research, a typical application may be - grouping the studied patients into different categories, those with a certain type of gene profile-Gene A, and those with another type of gene profile-gene B. Both are treated with a similar treatment protocol. In graph, patients with gene profile B, succumb much faster to a disease, for example, breast cancer, compared to those with gene A. So, if we estimate and compare the 5-year survival rates of two categories of patients, 70% survival, will be found for gene A, compared to 20% for gene B type patients. Kaplan–Meier estimator curve generation, utilizes two types of data for each patient- A. Status at last observation(event occurrence or censored) and time to event(or time to censoring). Apart from survival function estimation through Kaplan-Meier estimator, other parameters that can be estimated directly from survival function are: Density function: the probability of happening of event at time t Hazard function: connotes instantaneous event rate, the force of mortality For example- 50 patients have entered the study, out of 50- 1 has died at time 1, so the probability of survival at time 1, P1=49/50. Out of 49 patients alive, 2 more die at time 2, so probability of survival at time 2, P2=47/49 So survival function-time 2= P1*P2 The survival function is the unconditional probability of survival and is estimated by the multiplication of conditional probability at different time of observations. The curve of Kaplan- Meier estimator curve starts with the probability being 1 at time zero and will decrease subsequently and may reach 0 at particular time , if the study is continued for a long period of time, or the disease has a very high hazard function.
-
Shashikant Adlakha replied to Vishwadeep Khatri's topic in We ask and you answer! The best answer wins!Bootstrapping is a kind of sampling technique, which involves random sampling along with replacement of the sample and was documented by Bradley efron. it is a simple, yet powerful tool for drawing statistical inference without banking on much of the assumptions. Entire sampling distribution can be done just from one sample data and the best thing is that no formula is needed for any statistical inference. it is also applied in other statistical derivations such as confidence interval, regression model and machine learning. Bootstrapping evaluates the property of a predictor (such as variance), by assessing these properties, when sampling again and again from the distribution. When the observations are coming from independent population, a number of resamples can be constituted with replacement, of the observed data set. Bootstrapping is based on the principle that representation of a population from sample data(sample→ population) can be further modelled by resampling the sample data and draw the inference about sample data (resampled→ sample). The error in a sample statistic against the original population value is unknown, as we are unaware of entire population. As we are aware of the sample taken in, the quality of representativeness of resampled data (resampled → sample) to original sample data can be evaluated by bootstrapping. I. Confidence Intervals: There are different tests available to build confidence intervals: · T-Test · Two sample t-test · Z-test · chi-square Test Bootstrapping approach can be substituted in place of any of these. First, we calculate the mean of the original sample, that is presumed to be representative of the entire population. By bootstrapping thousands of samples from original sample, means of all the samples can be obtained . We can plot the sampling mean distribution curve and compute 95% confidence interval of means and evaluate if our original mean is falling in 95% interval. II. Hypothesis Testing with bootstrapped data: After defining null and alternate hypothesis clearly, we can verify according to 95% confidence interval of means of bootstrapped samples and conclude, if we are rejecting the null hypothesis and go with alternate hypothesis or fail to reject the null hypothesis. We can also compute P values and also reject or go with null hypothesis. III. Power calculation: Power and sample size calculations are dependent mostly on the variance and standard deviation of the statistic of interest. When a small pilot sample is available, bootstrapping can be done to derive large number of samples and calculation of variance. IV. Assessing the distribution of the statistical data of interest: To evaluate a theoretical distribution of a data, when it is unknown and analyse the different parameters arising from this data. Bootstrapping is distribution independent and provides indirect assessment of distribution of the data.