Ajay Sharma.
Lean Six Sigma Black Belt
-
Joined
-
Last visited
-
A Top-Down Diagram is a visual representation that illustrates the hierarchical relationships between different components or elements of a system or process. It is commonly used in various fields, including project management, software development, systems analysis, and process improvement methodologies like DMAIC (Define, Measure, Analyze, Improve, Control). In a DMAIC project, a Top-Down Diagram can be useful in several ways: Process Understanding: A Top-Down Diagram can help in gaining a high-level understanding of the process under investigation. It provides an overview of the process flow, its main components, and their interconnections. Process Mapping: The diagram can be used to map out the entire process, starting from the top-level process and breaking it down into subprocesses or subcomponents. This helps identify all the steps involved, inputs and outputs, decision points, and areas of potential improvement. Problem Identification: By visually representing the process, a Top-Down Diagram can help identify areas where problems or bottlenecks occur. It allows project teams to pinpoint specific subprocesses or components that require closer examination. Root Cause Analysis: During the Analyze phase of DMAIC, a Top-Down Diagram can be used to identify potential root causes of the identified problems. It assists in tracing the flow of inputs and activities to determine which factors may be contributing to the issues. Prioritization: The diagram can aid in prioritizing improvement opportunities. By visually representing the process hierarchy, teams can focus on critical areas that have the most significant impact on the overall process performance. Communication and Collaboration: Top-Down Diagrams serve as effective communication tools. They enable project teams to share a common understanding of the process and facilitate collaboration by visualizing the roles, responsibilities, and relationships of different stakeholders. Process Standardization: A Top-Down Diagram can be used to document and standardize the process. It provides a reference point for creating standard operating procedures (SOPs) and ensures consistency in the execution of tasks. Training and Onboarding: The diagram can be used as a training resource for new employees or team members. It helps them understand the overall process flow and their role within it. It's worth noting that the number of valid use cases for a Top-Down Diagram can vary depending on the complexity and nature of the process being analyzed. The list above outlines some of the common and essential use cases, but there may be additional ways to leverage this tool based on specific project requirements.
-
A probability plot, also known as a quantile-quantile (Q-Q) plot, is a graphical tool used to assess the distribution of data. It compares the observed data quantiles to the expected quantiles of a specified theoretical distribution, typically assuming a normal distribution. To construct a probability plot, we sort the data in ascending order and calculate the corresponding quantiles. These quantiles represent the probabilities below which a certain percentage of the data falls. For example, the 25th percentile corresponds to the value below which 25% of the data lies. Next, we determine the expected quantiles based on the theoretical distribution we want to compare against. For instance, if we assume a normal distribution, we calculate the expected quantiles using the inverse of the cumulative distribution function (CDF) of the normal distribution. Plotting the observed quantiles against the expected quantiles produces a scatter plot. If the data closely follows the assumed distribution, the plot will exhibit a roughly straight line. Deviations from a straight line can provide valuable insights into the distribution of the data. Here are a few insights we can gain from a curve that deviates from a straight line in a probability plot: Skewness: If the curve deviates from a straight line in the tails, it suggests that the data might have a skewed distribution. Positive skewness occurs when the tail on the right side of the distribution is longer or fatter than the left side, while negative skewness is the opposite. Heavy-tailed distribution: If the curve deviates upward in the middle or near the ends, it indicates heavy tails in the distribution. Heavy-tailed distributions have more extreme values than expected in comparison to the assumed distribution. Light-tailed distribution: Conversely, if the curve deviates downward in the middle or near the ends, it suggests a light-tailed distribution. Light-tailed distributions have fewer extreme values than expected. Deviation in the center: If the curve deviates from a straight line in the central portion, it might suggest a different location or spread than what is expected under the assumed distribution. This can indicate issues such as outliers, a shift in the mean, or a difference in variability. By examining the deviations from the straight line in a probability plot, we can gain insights into the shape, skewness, tail behavior, and location of the data distribution. This information helps us assess the appropriateness of the assumed distribution and guides further analysis and modeling decisions.
-
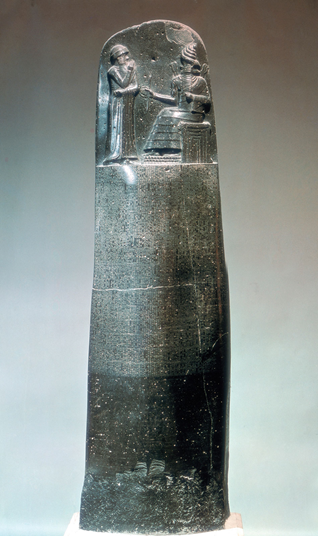
“If a man put out the eye of another man, his eye shall be put out” -Hammurabi The Hammurabi code is the oldest written legal code by the king of Babylon, Hammurabi, who ruled over 42 years from 1792BC to 1750BC. The Hammurabi code is a collection of 282 rules to meet the justice for the standards of business interactions, fines and punishments. It was written over a black stone, finger shaped as shown below in figure (sourced from History.com) This code is earliest written law ever known (shown below in pic, sourced from history.com) Hammurabi code was carved to enforce a moral obligation for fair play over the single 4 ton weighed black stone. On the top, there is carving of standing Hammurabi receiving the law from the seated Shamash, Babylonian god of justice. Rest of the stone is divided into columns with script carved over there. Hammurabi’s Code serves the earliest example of laws of retribution and sometimes known as “an eye for an eye.” The Code includes many harsh punishments, as demanding the removal of the guilty person’s tongue, hands, eye or ear. This is also an earliest example of “an accused is innocent until proven guilty”. The 282 rules are in the “if-then” form. For example, if a man steals an ox, then he has to pay back 30 times of its value. It outlines different standards of justice for the three classes of the society, the propertied class, middle class and the slaves. A doctor’s fee for curing a severe wound would be 10 silver coins for a propertied man, five for a middle class man and two for a slave. Penalties for mal-practicing the rules: a doctor who killed a propertied patient would have his hands cut off, while only financial punishment was required if the victim was a slave. The code also includes the earliest construction laws, designed to align the incentives of builder and occupants to ensure that builders create safe homes If a builder makes a house for a man whose construction is not good, and then the same house collapses and causes the death of the owner, that builder shall be life penalized. If the house collapses and the son of the owner is succumbed to death then the builder’s son would also be put to death. If the house collapses and the slave of the owner is dead then builder shall give to the house owner slave of equal value. If the property is destroyed, then the builder shall restore whatever damages. Doctors get respect and promotions if they do their jobs fairly and also risk heavy penalties for medical mal-practicing. With the exception of experiments in which patients are fully informed of and consent to the risks, doctors don’t get a free pass for taking risks that cause harm to patients. The same goes for military and security personnel. They get honor and promotions if they succeed and the severe disincentive of shame when they fail. Hammurabi and his advisors were unconcerned with complex laws and legalese. Instead, they wanted the Code to produce results and to be understandable by everyone. When we align incentives of everyone in both positive and negative ways, we create a system that takes care of itself. The little extra profit that builders can generate is same as the bonus system in some of today’s industries. It rewards those who take unwise risks, trick their customers, and harm other people for their own benefit. Hammurabi’s code of system had the opposite effect, it merged the interests of the person getting paid and the person paying. Rather than the builder being motivated to earn as much profit as possible and the homeowner being motivated to get a safe house, they both shared the latter goal. The Code illustrates the efficacy of using self-preservation as an incentive. We feel safer in airplanes that are flown by a person and not by a machine because, in part, we believe that pilots want to protect their own lives along with ours. This code can be formalized in today’s industries also to entrust the moral obligations and discipline. Areas where it can fetch desired results 1- HR policies- if a person is not following the SOP deliberately, then he shall be punished with suspension or termination. 2- Banking sector- If someone misuse the details of a customer or leaks the data, then he shall be punished with termination. Or shall be handover to police. 3- Manufacturing industry- if someone is not obeying his customer, then he shall not get any promotion or bonus. 4- Service industry- if someone is not providing the quality service then he should be penalized with shame. 5- Marketing industry- If any company making the false promises and marketing the fake benefits of the product they are selling, then the company shall be shut down. 6- Education sector- If any school or college is charging excessive fees (unfair fees structure) then the school or college shall be barred. 7- Sports- If a sports person found guilty of doping or using unfair means to win the game. Then he shall be banned from sports for lifetime. 8- Sales and marketing- If a team leader is promoting the unfair practices then he shall be terminated. 9- Medical industry- if a doctor is mal-practicing, then his license shall be cancelled. 10- Judiciary- if an advocate is favoring serving the wrong facts then his license shall be cancelled. 11- Administration- If an Officer is found involved in corruption then he shall be terminated and put in jail. 12- Food supply chain- If fruits and vegetable producer is found to use chemicals hazardous to human health. Then he shall be punished with life imprisonment. These are the few areas where implementation of such code is required to create a moral obligation to build trust between people, employees of an organization, and strengthen the customer supplier relationship.

-
“We become, neurologically, what we think.” — Nicholas Carr Popular lines by Nicholas Carr, supports and also briefly explains about the filter bubble. We become what we see repeatedly and we see what internet assumes we would like to see. When websites uses algorithms to assume what a user want to see and then fetches the information to the user related to his/her wants, then this is called as filter bubble which is a type of internet isolation. We see example of filter bubble in our daily routine life. When we browse some specific product on amazon or flipkart but don’t buy that. Then whenever we go to any site we will see marketing ads of that product and of those products which are much similar to the product. Which creates an environment for the user to push him/her neurologically to purchase that product. This happens because of the algorithms used by companies. This uses the information of user like past browsing history, click behaviour and location to create such environment. Which we can call as intellectual isolation. This is a classic example of filter bubble. Google search engine and facebook news stream are the two perfect examples of filter bubble. This phenomenon is well explained by Pariser in his book named” Filter Bubble: What the internet is hiding from you”. He explains that suppose a person X searches for Term RIL on google, then he will start getting news on RIL and shares of RIL creating an environment for investing in RIL. But when another person searches for the same keyword, he will be getting some other news on investment based on his previous click pattern and browsing history. This will create two different impressions on mind of X and Y, according to Pariser, this could have good or bad effects on social discourse. But others say that it will impact negligibly. In US elections in 2016, elections’ results are often called to be influenced by the filter bubble with facebook being the key electoral battle ground. Just with-in two weeks until voters votes, whatever happens on facebook and other social media platforms will have a deep impression on how the country votes and no one will eventually understand what is happening on the real ground. This is why our Facebook news feed is personalized to our likes and dislikes. And it’s done automatically. Basically we are in a filter bubble. Potential Areas where filter bubble can fetch fantastic results are as below: 1-E-commerce 2-Sales and Marketing 3-Brand Promotion 4-Electoral battle, i.e. influencing the voters 5-Introduction of new products to the existing market 6-Introduction of existing products to the new market 7-Film Promotion 8-Event promotion 9-Personalized Music Applications 10-Personalized News feed 11-Information Websites 12-Sharemarket 13-Investment firms Basically, filter bubble is a phenomenon by virtue of which a user will be isolated from his dislikes and only his likes and positive content will be served to him to influence the user to make decision in the favour of the creator of filter bubble.
-
“Decisions are the hardest thing to make, Especially when it is a choice.” Analysis Paralysis and extinct by instinct both are two opposite sides of a coin. Where Analysis Paralysis is over analysing a situation so that a decision or action is never taken. Most of the corporates face this type of situation when they keep on thinking for even taking small steps or making decisions. In this scenario, Organizations bear losses of new businesses, potential customers and the money of course, which they could have earn. While on the other hand Extinct by instinct refers to making a fatal decision based on gut reaction. This kind of behaviour is also very hazardous for organizations. When management make decisions without analysing the situation just by gut feeling. In this case, if the decision turns good, then they make profits and if it turns to bad then it becomes disaster. Both types of behaviours are not good for organizations. So, must be avoided and only a balanced approach should be used on the basis of Analysis and calculations. Factors that affect the Quantity of analysis can be understood as Paralysis Analysis 1. Wide Spread 2. Diffuse 3. Divergent 4. Consensual/Passive 5. Analytical Extinction by instinct 1. Limited 2. Concentrated 3. Convergent 4. Autocratic 5. Intuitive
-
“The best SOPs are the product of iterative process. Get a draft SOP displayed as fast as possible and make optimizations over time” SOP stands for standard operating procedure. It is the best tool to bring the standardization in process and reduce the variation due to operator’s way of doing a job. Generally a good SOP includes process parameters, product parameters, SOP identification and traceability no. and the flow of process with in an operation with PPE guidelines and do’s don’ts. But it has been noticed over time that even the detailed SOPs are available and displayed properly, still operators end up doing mistakes. And after analysis RCA found mostly is – ‘I forgot’. It has been seen that when instructions increases in number and size doing optimization over time, instruction creep occur. And it can be insidious and damage the success of large groups, originating the ignorance of the KISS principle (acronym for keep it simple, stupid) resulting in complex procedures (opposite to simplified) which are generally misunderstood, followed by ignorance. Instruction creep is common in large organizations, where guidelines are created by changing people groups over period of time. This results in adding of more instructions rather than simplifying existing ones. Over period of time, instructions will start over lapping at the cost of clarity, efficiency, consistency and communication. The biggest irony of instruction creep is that SOP makers believe that people read instructions with same level of comprehension, no matter how complex those instructions are. Instruction creep can be and must be removed by the process owners keeping in mind at the time of SOP making and adding on instruction while optimization. Just follow “KISS principle”, i.e. follow “ keep it simple, stupid” rule. Whenever adding more instruction, considering the earlier instructions and make visible to operator what they are supposed to read again and again. Keeping guidelines and SOPs to the point is the key to remove instruction creep and most effective way of preserving transparency. Addition of instructions should be in case of real problem not just a perceived problem or hypothetical problem. The addition if implemented should make a real or positive difference and all implementations should have a clear consensus. All instructions must be as clear as possible.
-
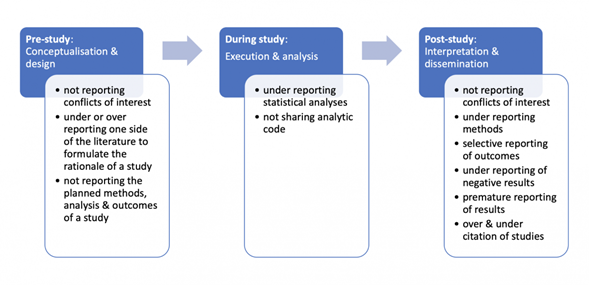
Although medical writers have acknowledged the problem of reporting biases for over a century, it was not until the second half of the 20th century that researchers began to investigate root and size of the problem of the reporting biases. Depending on the outcomes, the decision to publish or not the research findings whether positive or negative. Over the last 20 years, enough evidences have been collected that speaks that failure of publishing research studies which includes clinical trials and testing reports and their effectiveness is pervasive. Almost 90% of all failures to publish is due to the failure of researcher to submit. Rest of the failures are due to the rejection by journals. Reporting Bias covers a range of different types of bias acting like an umbrella. Community is using biases since 17th century for hundreds of years. Since then, different definitions of reporting bias have been proposed like “Selective revelation or suppression of information”, “when the dissemination of research findings is influenced by the nature and direction of results.” The reporting bias of research comes to existence when the data or direction of significant results influence how the research is being reported. The definition of reporting biases is an element of the presented information from research due to the selective disclosure or withholding of information by parties involved with regards to the topic selected for study and the design, conduct, analysis, or dissemination of study methods, findings or both. Researchers have define seven types of reporting biases including 1-Publication Bias 2-Time-lag bias 3-Multiple or duplicate publication bias 4-Location bias 5-Citation Bias 6-Language Bias 7-Outcome reporting bias These seven types of reporting biases can be understood with the help of below diagram of a lifecycle of a research Example of reporting bias :- When a review conducted by researchers, it was found that reporting bias is a widespread phenomenon in the medical literature. The researchers identified reporting biases in 50 types of pharmacological, surgical, diagnostic and preventative interventions which included the withholding of study data or the active attempt of manufacturers to suppress the publication of findings. Later review conducted that compared the results of random trials under controlled environment with the subsequent peer-reviewed journal articles. Then it was found that there were discrepancies between prespecified and reported outcomes. 13% of trials introduced a new outcome in the published articles compared with those specified in the registered protocols. Another study found considerable inconsistency in the reporting of adverse events when comparing sponsors databases with study protocols. Out of 22 studies, it was found that in 14, the number of adverse events in the sponsor’s database differed from the published articles by 20% and more. When more detailed information for interventions was analyzed for trials, 55% of the previous risk of bias assessments were reclassified from ‘low’ risk of bias to ‘high’ Trials and systematic reviews are used by clinicians and policymakers to develop evidence-based guidelines and make decisions about treatment or prevention of health problems. When the evidence base available to clinicians, policymakers or patients is incomplete or distorted, healthcare decisions and recommendations are made on biased evidence. The first safety analysis of the largest study found a 79% greater risk of death or serious cardiovascular event in one treatment group compared with the other. This information was not disclosed by the manufacturer and the trial continued. The cardiovascular risk associated was obscured in several ways. A number of significant conflicts of interest among board members were undisclosed, and not made public while the trial was in progress or when it was published. This serves a classic example of mis-reporting and under-reporting. If benefits are over-reported and harms are under-reported, clinicians, patients and the public will have a false sense of security about the safety of treatments. This results in unnecessary suffering and death which will misguides future research. Preventive Steps: Transparency is the most important action that can save from under-reporting, over-reporting or mis-reporting and can avoid bigger loses in medical industry. Pre-study: The results of prospectively registered trials are significantly more likely to be published than those of unregistered trials. Prospective registration of all clinical trials should be required, and encouraged for other study designs, by journal editors, regulators, research ethics committees, funders, and sponsors. During the study: Open science practices, such as making unidentified data and analytical code publicly available through digital platforms which aids reproducibility, prevents duplication, reduces waste, accelerates innovation, identifies errors and prevents reporting biases. Post-study: Reporting guidelines such as CONSORT can help guide researchers to improve their reporting of randomized trials. The most obvious evidences come from medical fields of publication bias from studies of research which are identified at the funding stage or at the time of approval of ethics. These studies have shown that “positive findings” is the principal factor associated with subsequent publication, researchers say that the reason they don't write up and submit reports of their research for publication is generally due to their disinterest in the outcomes. Even the researchers who have published their results initially as the conference abstracts do not want to publish in full just because they are not satisfied with the results. This happens because of the data which is presented in abstracts is preliminary or interim result. And may not be reliable of what was found once all data were collected and analyzed. In addition, abstracts are often not accessible to the public through journals, or easily accessed databases. Many are published in conference programs, conference proceedings and are made available only to meeting registrants. The main reason of failure to publish is negative or irrelevant findings. Controlled trials those are published in full are more likely to be positive results. Publication bias lead to underestimate the adverse effects of treatment, which in turn can lead doctors and decision makers to believe a treatment is more useful than it is. It is now well-established that publication bias with more favorable efficacy results is associated with the source of funding for studies that would not otherwise be explained through usual risk of bias assessments.
-
An elevator Pitch or elevator speech is a quick & effective introduction of one’s background and experience. It is called as elevator Pitch as it should be short enough to present during a small elevator ride. Elevator Speech is all about you, who you are and What you want to share your expertise and credentials quickly and effectively with the people who don’t know you. Elevator Pitch or elevator speech can be used at Job interviews, Marketing of new products ,Sales, job Fairs and career expos, Seminars, etc. How to prepare: 1-Your Elevator speech must be brief: Brief the speech to 1 to 2 minute. Need not to include the entire work history and career objectives. It should be short recap of who you are, what you do and skills you have. 2-You need to be persuasive: Elevator speech should be compelling enough to spark the listener’s interest in you, your skills and your background. 3-Share your skills: Elevator speech be focussed on assets that can add value to organization. 4-Practice: The best way to become confident to present an elevator speech is practising it until the speech and pitch come naturally. 5-Be Positive and flexible: Always be Positive and flexible as you are not often interviewing for a specific position when you present an elevator speech. Never include the stuff you are not supposed to do or not going to do. “First impression is the last impression”. So this is the chance where you can make a spark in the listener’s mind. 6-Mention Your goals: Don’t be too specific and an overly targeted goal does not work since your pitch can be used many circumstances. But always add what are you looking for. 7-Know your audience: Using jargons can be a good move , it demonstrates your knowledge in the industry. But remember to whom you are speaking, listeners may not be aware of those critical words. So keep it simple and focused. 8-Have a business card ready: Always keep your business card ready and offer it at the end of conversation. If you don’t have a business card then you should use your smartphone to share contact details. Don’ts of presenting elevator speech: 1-Don’t speak too fast: You have a lot of information to convey during an elevator speech but don’t speak quickly to overcome this dilemma. This will make listeners hard to absorb the information. 2-Avoid rambling: You don’t want to have unfocused and unclear statements in your pitch or get off track. Give the opportunity to the listener to respond and interject. 3-Don’t speak in a monotone way: Keep your energy high, be confident and enthusiastic. And focus on how you are carrying yourself rather than using the exact words you want to use. Keep your facial expressions friendly and smile on face. 4-Don’t speak in a single elevator pitch: Prepare your elevator pitch according to the person you are talking with. You may also want to have a casual, personal pitch prepared for social settings. Few examples for reference: Use below examples as guidelines in preparing your elevator pitch. Make sure your elevator speech includes details on background as well as your goal. · My name is Rajat, I graduated with a degree in mechanical engineering. I have an overall experience of 8 years working with auto electrical companies as an engineer and I’m looking for a job that will put my skills as a manger to work. · I have a decade’s worth of experience in Quality department. Working primarily with large auto firms like Ashok Leyland and Mahindra. If your company is ever in need of a unit head, I’d be thrilled to consult. · I create websites and brands. My passion is to come up with innovative and creative ways to express an idea and drawing the illustrations that people share on social media.
-
Ansoff Matrix was developed by Businessman and mathematician, H. Igor Ansoff. And was published first in Harvard business review in 1957, in an article titled “strategies for diversification”. It forced marketers and business leaders a quick and simple way to think about the risks of growth. Ansoff matrix gives four possible elements of growth, which vary in risk. 1. Market Penetration: Focusing on the sales increase of existing product in the existing market.. 2. Product Development: Focusing on new products development for an existing market. 3. Market Development: Focusing on the new market with existing products. 4. Diversification: Focusing on introducing new products in new market. This gives the idea that whenever we move from one quadrant to another the risk increases. And also it helps in analyzing the risks associated with each quadrant. To use this matrix, we have to write the options in appropriate quadrant and then look for the risks associated with each option. Then develop a contingency plan to address the risks. This activity will help in decision making best for the organization. Below is the example of the Ansoff matrix: This is the way organizations take benefits of Ansoff matrix in making decisions. Few examples of matrix points and their benefits companies made, Decreasing price to penetrate the market and attract the new customers,e.g. Godaddy (website domain and hosting provider) provides additional discount for startups and first log in’s. Increasing the expenditure on advertisement of the same product to increase the sale, e.g. most of the film producers do to increase the revenue on the first week of release. Introducing new products to beat the competitors, e.g. Patanjali introduces a wide range of FMCG products to penetrate the market. Taking over the competitors business in the same market, e.g. TATA acquired Range Rover and Jaguar.

-
The SERVQUAL model initially designed for service sector and retailers those were interested in understanding and measuring service quality. Therefore broadly it is a perspective of Service as opposed to the manufacturing sector that focuses on inspection and physical goods testing. SERVQUAL model is a different concept. Service Quality is the customer’s assessment of delivery and value of the firm. SERVQUAL model is often called RATER model too, which denotes five factors of service sector. Where as SERVQUAL model stands for service Quality. Earlier this is the form of structured market research that expands over the five areas. Five factors that stands for RATER model are: · Reliability-means the ability of a firm to perform the service accurately and dependably · Assurance-means courtesy of the employees and their ability to gain the trust and confidence of service seeker. · Tangibles-means of physical appearance such as equipments, personnel, materials used for communication · Empathy-means caring and individualized attention by the specific firm and employees · Responsiveness-means the will of service provider firm to help customer and provide best quality service. SERVQUAL model is consisted of 22 questions classified into two main sections 1. Clients are asked about their expectations and experiences of their ideal service company in that service sector like banking, hotels, education, etc. 2. Then the clients are asked about the service quality delivery of the same industry. The 22 questions can be divided under five factors as shown below: SERVQUAL: 1. TANGIBLES § Up to date equipment § Visually appealing facilities § Well dressed employees § Facilities consistent with the industry 2. RELIABILITY § Respond within time frame § Reassuring when problem arise § Dependable § Service delivered at promised time § Accurate records 3. Responsiveness § Inform customers when service occur § Prompt service from employees § Employees willing to help § Employees respond to requests 4. Assurance § Employees are trustworthy § Customers feel safe in dealings § Employees are polite § Employees have support to do their job well 5. Empathy § Firms Provide individualized attention § Employees provide individualized attention § Employees understand customer needs § Employees have the best interests of the customer in mind § Operate at convenient hours This approach provides the service provider the basis for comparison of service quality levels between the competing companies, the difference between expected and service quality of each firm and the ability to drill down to the questionnaire to find out whether the specific firm is performing below or above customers’ expectations.
-
PICK chart a lean six sigma tools was developed by Lockheed Martin for Lean Production. Initially this was developed to prioritize implementation of process improvements/Kaizen in plant P=Possible-Low Pay off and Easy to Do I=Implement-High Pay off and Easy to do C=Challenge-High Pay off and Hard to do K=Kill- Low Pay off and Hard to do This is 2X2 matrix in which 4 Category available for decision where X axis has scale of benefits or payoff and Y axis has easiness of implementation. Then we have to make a decision and see in which quadrant of PICK chart which is divided into categories viz. Implement, Possible, kill and Challenge. Example:-In Kaizen month We have collected 310 Kaizen/Improvement and CFT is going to review . Basic of Review is High Impact / High Investment/Pay Off & Low Investment/ ROI/Pay Off Easy to do/Hard to do KAIZEN /IDEA SUMMARY Low pay Off High Payoff Easy 132(Possible) 86(Implement) Hard 38(kill) 54(challenge) Total 170 140 Team focus and priortize first on low hanging fruits which we can easily implements which are easy and High Pay off than will plan for Hard and High Pay off . · First we focus “Implement” ideas the ones that should be acted upon, · the “Challenge” ideas may still be viable if there’s an easier way to do them. · “Possible” should probably only be done if there’s spare time. · And “Kill” ideas are generally dismissed, but Kill-ideas should be revised and reviewed into accomplishable ideas. The steps to be followed to create PICK chart are as below : Step 1: Raise the question and put it on the chart. Ask the team the question and then the team is supposed to answer the question at different stages and ensure that the data collected is relevant. Step 2: Every component of the data should be post on a different note like a sticky note. Arrange these notes on the left side of the chart. Step 3: Then each team member should read all notes and draw it’s relevance and importance. Then each team member should decide themselves whether the idea should remain as the element of significant sample. Then these notes should be removed and stick on the other side of the chart. Then, the data is filtered enough to be processed by tools like affinity diagram, etc. - All team members write open-ended questions that are addressed to the learning objectives. - All team members have their own notes. - The mediator randomly picks one note from the group. - After all the notes are read, then the mediator will ask the group if there is any question about the idea which is just read. - Then mediator collects all notes that are being raised. Then make clusters of notes. - The above steps are repeated again and again until all notes are set in the cluster. - Then these clusters are subdivided in small groups and titles are assigned to each small cluster. Applications:- Identify Projects on the base of priority Make & Buy Decision Kaizen Implementation Priority Data Analysis Education Marketing Agile software development Use of PICK charts in define phase of six sigma - to evaluate pre-process unprocessed data. -to reduce big raw data to get to the reach base problem. -to broken down the data into the needs and is often called as pre-processing. -to analyze customer responses and extracting key phrases to verify the needs and their context. -to ensure the traceability to the unique starting place. This will help in organizing the data for further classification. -Prioritize the Project selection on the basis of PICK chart,

-
An American Writer, philosopher, politician, scientist, inventor, civic activist, and diplomat Benjamin Franklin wrote in his autobiography "He that has once done you a kindness will be more ready to do you another favor, than to whom you yourself have obliged". Means that it a psychological phenomena that a person who has already performed a favor for another is more likely to do another favor for the other person. If we ask people they will say that they help people because they like them, even if that is not true, but their mind will keep on struggling to maintain a logical consistency between their perceptions and actions. How does the Ben Franklin effect work? Apply this to the favor-requesting method of boosting loyalty and you get the following sequence: You ask someone (who is not a friend) to do you a favor. For whatever reason, they agree to do it. They mind looks for a logical justification. It struggles to reconcile the attitude towards you with the favor. It “reinterprets” the former, concluding that you’re viewed positively. Application of Benjamin effect:- In the sales and marketing sector, the Ben Franklin effect can be used to build reputation in the client’s eye. Rather than helping a potential client, a salesperson can ask the potential client for assistance e.g. sales person can ask the potential customer to share which product or benefits or services are most compelling to them, or what’s trending or what products they would like to experience in future. This kind of favour can build likeability that will enhance the sales person’s ability to gain that client's time and investment in the future. Parallely for Regular customer also we can ask for the feedback and this will eliminate negative feeling will leading to more business. their feedback are important for us and will help improve offer. Make customer your partner in helping the under privileged. Also ask customer for referral and guidance Network Building:- In case of linked in for connection/Job search sometimes we take guidance on projects or knowledge sharing or writing Good comments or birthday wishes .That will enhance our effective networking and increase interelation
-
Herd immunity is also known as herd effect, community, population immunity and social immunity. As the name says itself about it, It is a type of protection of a large community from a contagious disease. It happens when large number of population has become immune to the infection, whether by the vaccination on large scale to protect the people who are not immune. When in a population a large number of individuals posses immunity will not contribute to transmit the disease , the chain of infection will disrupt which will slows the spread or eventually stops. In case, any person who can not become immune from the infection, herd immunity is becomes crucial. Such people can be protected when a certain proportion of population become immune, herd immunity gradually eliminates a disease from a population. Herd immunity is natural phenomenon observed in 1930, when large number of children were has become immune to measles by large number of vaccination. Then this phenomenon also observed in 1977, when small pox was eradicated by herd immunity. This phenomenon will also end present pandemic Corona Covid-19 contagion spread with large number of vaccination over the globe. Concept Herd immunity also apply to businesses and online security. Biological infections and their spread are much similar to online security. Local connectivity network or IT environment is a necessity today and maintaining a stable connection with a wide network. In such environment herd immunity becomes crucial and being done by upgrading the software which may lead to disruption in connectivity or effect the functionality. Eventually decision makers prefer the functionality over security fearing the potential disruption in the functionality. Though it is not easy to patch unvaccinated systems, Herd immunity concept is used to protect the unvaccinated systems and is being used by agencies against the cyber attacks. This concept can be applied to many areas such as 1. Education sector – to eradicate the illiteracy from country, we have to educate a large proportion of population. Then the literate people will directly or indiractly provide education to other remaining illiterate people. 2. Medical Sector – to eradicate the contagious disease spread. 3. Corruption in Society – If large number of individuals say no to corruption then eventually left over corrupted people will also turn around and corruption will be eradicated. 4. Cyber security – If large number systems are immune to virus then the spread will be stopped or slow down. 5. Quality management – If large number of companies follow any specific certification then it will become necessity for all companies to acquire the same certificate to get the business. 6. New Manufacturing technology – If large number of companies adopt the new technology for manufacturing then customer will automatically start asking the suppliers without new technology to use it.
-
First, We need to understand the term “Business Excellence” and Elements of Sales and marketing, before we start to find the areas in sales and marketing which can be benefitted from business excellence. What is business Excellence model? Business Excellence is a set of Core values, Sometimes it is called as World Class Best Practices for managing organization and hitting the Organizational Goals. These best practices evolved into a Business model for “how to run a world class organization”. This Business model is developed and evolved with thorough Study of the world class Organization’s best managerial practices and core values. Many Big Companies have developed their own model of Business Excellence and use as a benchmark to assess the Organization’s Performance and recognize through award programs. There was a decline in awards applications in 1990s. There has been an upward trend for organizations to follow these models and integrate the business goals with the best practices in their daily Operations. And achieving the benefits what Business Excellence model brings. Business Excellence models are frameworks which when applied within an organization can help us to focus on new ideas and actions in a systematic way that will lead to an accelerated growth. These business models are internationally accepted for both providing a framework for implementing the world’s best Practices and an effective measurement of how this model is implemented. Few examples of Business Excellence models accepted worldwide are given below: · Baldrige (MBNQA) · European Foundation for Quality Management(EFQM) · Singapore Quality Award Model · Japan Quality Award Model · Canadian Business Excellence Model · Australian Business Excellence Framework(ABEF) Malcolm Baldrige is the most popular model in the western countries and is launched by U.S. Government and commonly known as Malcolm Baldrige Award Model This model is incorporated of 6 pillars with one result category. 1. Leadership 2. Strategic Planning 3. Customer and Market Focus 4. Measurement, Analysis and knowledge Management 5. Manpower focus 6. Process management 7. Business Results The values of Baldrige Model includes · Visionary leadership · Customer driven excellence · Organizational and personal learning · Valuing and Employees and partners · Agility · Focus on the future · Managing for Innovation · Management by fact · Social responsibility · Focus on Results and generating value · Systems Perspective European foundation for Quality Management Model is also consists of six process elements and one result category 1. Leadership 2. Policy and Strategy 3. People 4. Partnerships and resources 5. Processes 6. Customer results 7. People Results 8. Society Results 9. Key Performance Results The Fundamentals of all business excellence models are more or less in common and includes Ø Results Orientation Ø Customer Focus Ø Leadership and constancy of purpose Ø Management by processes and facts Ø People development and involvement Ø Continuous learning, innovation and improvement Ø Partnership development Ø Public responsibility In General, for most of the organizations, the awards are secondary in importance to the concept of business excellence, which will ultimately lead to the national economic growth. Now we can discuss areas where business excellence model can be applied to the goals of sales and marketing. Knowingly that other operational areas are commonly targeted by six sigma, lean, Theory of constraints, etc. Areas of Sales and Marketing are as 1- Identifying the Right opportunities-understanding “skate where the puck is going” is that organizations must focus on the opportunities coming next year and year after year. Best example of this is Google which identified the future opportunities in digital marketing and advertising and today they are monitoring 140million real time businesses and generating revenue. 2- Pair the right opportunity with right people- To Match the right people with right opportunities, three things organizations must consider a. Go-to-market architecture-finding the routes of market b. Sales Planning process-allocate people to those routes c. Skill Assessment-ensure people are equipped to win the deals Perfect example of getting the right skills in the right people at the right time is an insurance call center. They identified that there is 3times difference between the lowest and highest performing sales-things like call cancellation handling. Then they use this information to build sales capability and employee hiring process. Which in return increased the sales by almost 30% 3- Deliver the Perfect customer pitch- Once you have identified the right opportunity and placed the right people in right places with right skills at right time, then you must deliver the perfect customer pitch. You should apply the collected information and shouldn’t leave the chance. This can be done in 2 ways: a. Segment the customer base so that you can trace the different needs of different segments b. Equip the sales force with listening skills so they can match the customer to value proposition. c. Provide the sales force with predictive analytics, next product to buy to understand what to pitch especially in companies that have complex portfolios. Then marketing and sales teams should become the best friends. Marketing is supposed to help the sales force by either getting the right collateral at the proposal stage or lead generation and demand generation. But matching the marketing investment to the right spots in the sales funnel is critical. 4-Do the above three consistently-If the sales force dispersed across geographies, product lines and routes to market. Same time organization wants to drive sales excellence, especially in large and complex companies, you have a degree of centrally driven initiatives and change. The companies those are good at this, invest in sales force building a set of sales capabilities and then allow them to drive the different elements of sales excellence. Even the research shows that the best performing companies invest heavily in sales Operations. 5-Building the right operating model-In order to drive sales excellence in a company those are operating globally need to be able to get in front of the right opportunities at the right time, with the right people, deliver the right pitch, and be able to execute the sales operations so that the organization is consistent and effective. Business Excellence is not just a slogan or a matter of opinion. It is a fact that businesses that achieve Business excellence produce the most consistent growth that profit performance in the long run.
-
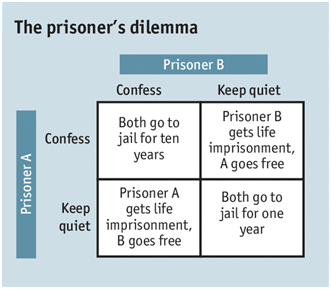
Nash equilibrium came from an American mathematician and inventor, John Nash. It is a decision making theorem of game theory. This theory determines the actions that participants of a game should take for best results in their favour. The Nash equilibrium can be used in many disciplines viz. Economics, social sciences etc. According to this theorem a player can achieve the best outcome without changing the initial strategy. One popular example is prisoner’s dilemma which adequately shows the effect of the Nash Equilibrium. The Prisoner’s Dilemma is a common situation of game theory that can showcase the Nash equilibrium. In this situation two criminals are arrested and both are held in solitary confinement with no means of communication with each other. The prosecutors do not have any evidence to convict anyone of them, So they offer both either to betray the other and get free or remain silent. If Prisoner A betrays prisoner B and B remains silent, then A will get free and B will be jailed for 10 years. If Prisoner B betrays prisoner A and A remains silent, then B will get free and A will be jailed for 10 years. If Prisoner A betrays B and B betrays A then both will be jailed for 5 years. If both remain silent then both will be jailed for 1 year. In this example, if both chooses for mutual cooperation then outcome will be better for both and if one chooses to cooperate and other doesn’t then outcome will be worst for one of them. As per Nash equilibrium theorem, Decisions that are good for individuals can sometimes be worst for groups. In the Practical world, Companies use Nash Equilibrium Theorem in Organizational decision making to predict how companies will respond to their Prices. Two companies will probably squeeze the customers more than they can if they face thousands of competitors. According to Nash Equilibrium, one company cannot predict the result of the choices of multiple decision makers if one company analyzes those decisions in isolation. Instead, companies must ask other competitor companies what they would do, taking into account the decision-making of the others.